Neutron inelastic scattering measurements on at 0.7 to 100 MeV
Abstract
Experiments searching for neutrinoless double beta decay () require precise energy calibration and extremely low backgrounds. One of the most popular isotopes for experiments is . In support of these experiments, the neutron inelastic scattering properties of this isotope have been measured at the GErmanium Array for Neutron Induced Excitations (GEANIE) at the Los Alamos Neutron Science Center. Time-of-flight techniques are utilized with high-purity germanium detectors to search for inelastic scattering rays for neutron energies between 0.7 and 100 MeV. Limits are set on production of yet-unobserved rays in the energy range critical for studies, and measurements are made of multiple -ray production cross sections. In particular, we have measured the production of the 1313 keV ray which comes from the transition of the first-excited to ground state of . This neutron-induced line may be useful for a novel energy calibration technique, described in this paper.
I Introduction
Neutrinoless double beta decay () is a hypothetical lepton-number-violating decay mode of great interest to nuclear and particle physics. Its observation would confirm that neutrinos are Majorana particles, meaning there is no distinction between neutrinos and antineutrinos. Measurement of this process could, in the Majorana neutrino case, also be used to infer the absolute mass of the neutrino. Given the interest in these neutrino properties, several experimental collaborations are running or developing experiments to search for .
One of the most popular and successful isotopes for this search is Al Kharusi et al. (2018); Brunner and Winslow (2017); Albert et al. (2018); Gando et al. (2016); Martín-Albo et al. (2013); Chen et al. (2017). This isotope has several advantages, including the large value (2457.83 keV Redshaw et al. (2007)), ease of enrichment and purification, and physical characteristics allowing for scaling to large monolithic detectors. While the signal for is a spatially-compact mono-energetic peak at the value, signals detected at other energies and with spatially-separated (multi-site) energy deposits can be used to identify and constrain backgrounds. Proposed next-generation experiments (such as nEXO Al Kharusi et al. (2018)) will have reduced radiogenic backgrounds (such as the 2448 keV line from 214Bi decay) due to purification, high-radiopurity shielding, topological discrimination, and other techniques. With these backgrounds mitigated, less common backgrounds will become more prominent. Current and future experiments using (including nEXO, NEXT Martín-Albo et al. (2013), PandaX-III Chen et al. (2017), and KamLAND-Zen Gando et al. (2016)) will benefit from having the best possible understanding of all potential backgrounds.
As such, we have measured the production of rays in from fast neutron interactions. This complements previous work Albert et al. (2016) studying rays from neutron capture on . While neutron-induced rays are not expected to be a significant background in future deep underground detectors, a detailed understanding of them may help identify otherwise mysterious signals. Cross sections as a function of neutron energy have been measured for several of the major ray energies, and limits have been set on the potential cross sections of unknown lines which might mimic a signal. The measured cross sections for lines produced in fast neutron-induced reactions may be used to refine future nuclear evaluations and improve simulations of the reactions.
This work also suggests a novel method for detector energy calibration. The keV level of is the first-excited state, and can be reached through neutron inelastic scattering . Thus, fast neutrons could be produced and sent into the detector to excite nuclei to this state, causing them to emit this mono-energetic line, offering a calibration signal.
II Experimental Setup
Data were collected at the Los Alamos Neutron Science Center (LANSCE) Weapons Neutron Research (WNR) facility Lisowski et al. (1990). There, an 800-MeV proton beam incident on a natural tungsten target produces neutrons in a wide energy range. The proton beam is delivered in short pulses spaced 1.8 s apart (micropulses), in groups lasting for 625 s (macropulses). There are 100 macropulses per second.
Our sample of 99.925% enriched was contained in a thin cylindrical aluminum vessel with thin kapton windows for neutrons to pass through. The target vessel window diameter of 3.4 cm is larger than the measured beam diameter, so the precise beam profile is not relevant to the cross-section measurement. The vessel was pressurized to near 2700 torr absolute, with pressure monitored in real time using a capacitance manometer to account for changes due to temperature and a very slow leak. The xenon volume is 7.2 cm long and 3.4 cm diameter, located on flight path 60R of the WNR neutron beam, centered 20.34 m downstream of the proton target, in the center of the GErmanium Array for Neutron Induced Excitations (GEANIE) spectrometer Becker and Nelson (1997).
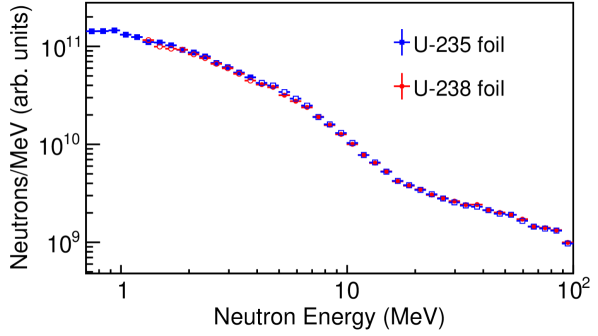
GEANIE features an array of 20 Compton-suppressed high purity germanium (HPGe) detectors to detect neutron-induced rays. Neutron energy is determined via time of flight. Neutron flux is measured by a fission chamber in the beam line upstream from the target with and foils Wender et al. (1993). Figure 1 shows the measured neutron flux as a function of neutron energy. More details on GEANIE, the WNR beam, and the procedures for cross-section measurement can be found in other papers Guiseppe et al. (2009); Fotiades et al. (2004); MacMullin (2013); MacMullin et al. (2012).
III Data Analysis
III.1 Absolute Cross Sections
To minimize uncertainties due to absolute detector efficiency and neutron flux, we normalized our xenon cross-section measurements to a reference cross section. To do so, we added 50 m thick natural iron foils to the ends of the target vessel for certain runs. Our reference cross section was b for production of the 847 keV in 56Fe at MeV, taken from a measurement by Beyer Beyer et al. (2014) at the nELBE photoneutron source. This line is the transition from the first-excited to ground state of . We corrected this cross section for small angular variations using angular coefficients from another measurement at nELBE, by Dietz Dietz, Mirco et al. (2017). After corrections for detector live-time, this line provided a reliable calibration for measurement of the absolute cross section. Our vessel was filled with nitrogen during most of the iron foil calibration runs to keep neutron scattering rates similar to xenon while avoiding any possible interference due to the 847 keV -rays emitted from 134Xe produced via interactions. We also took some iron foil data with the vessel filled with xenon to confirm the validity of our analysis. Lastly, runs with the target vessel filled with nitrogen (both with and without iron foils) were used to identify backgrounds not due to neutron interactions on xenon.
The relative detector efficiencies at different energies were determined using a 152Eu source placed at the center of the detector array. This provided rays with known relative intensities between 444 and 1299 keV. We determined an efficiency curve by fitting the data with Radford (2000)
| (1) |
Successful extrapolation of this efficiency curve to higher -ray energies has been demonstrated in previous GEANIE measurements MacMullin (2013); Fotiades et al. (2013). The known 152Eu lines, along with some higher energy lines from interactions on , were also used to calibrate the conversion from ADC counts to measured -ray energy.
The GEANIE spectrometer includes both coaxial and planar HPGe detectors, though we utilized only the coaxial ones. The planar detectors can only measure rays up to 1 MeV, well below the energies of interest to experiments. Some of the coaxial detectors showed poor performance in neutron or energy reconstruction, possibly due to neutron damage, and were excluded from the analysis, leaving five detectors with usable data.
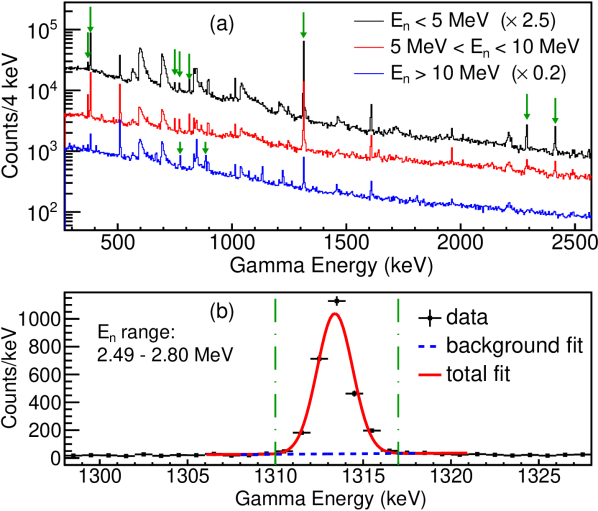
A simple Gaussian-plus-linear fit is performed for each bin in for each peak to define the integration range in each of the HPGe detectors used. The yield is then determined by summing counts in the peak range of and subtracting the background (estimated as the linear part of the fit). Figure 2 shows example spectra and an example fit. Live-time fractions for the fission chambers and HPGe detectors are determined for each run by comparing ADC triggers with dead-time free scaler counts. The measured yields, live-times, efficiencies, and -ray attenuation corrections are combined similarly to the method described in Ref. Guiseppe et al. (2009) to determine partial gamma-ray cross sections. Our analysis differs in that we normalize to an iron cross section, rather than lead, and that we neglect internal conversion coefficients, looking only at production. The influence of internal conversion is very weak (much smaller than measurement uncertainties) for all measured -rays Kibédi et al. (2008).
Our analysis also differs in the method of dealing with anisotropic emission. The neutron-induced emission will not be isotropic, but rather will have some angular distribution which may be, for known spin states, estimated. The estimation of these angular distributions is non-trivial, and we chose instead to minimize the angular effects where possible, and accept a larger uncertainty elsewhere. We model the angular correction, as is typical, with
| (2) |
| (3) |
where are coefficients and are the Legendre polynomials Dietz, Mirco et al. (2017). With cross-section measurements at three distinct values, it is possible to add the three measurements linearly with coefficients for different detectors such that the deviations from will cancel out, regardless of the coefficients. This calculation uses the approximation for small , and is accurate to order . Among our five detectors, we have three detectors at nearly the same value of , and two others at sufficiently different values. Unfortunately, one of the detectors at a unique angle was unable to record rays above 2 MeV, so this cancellation only works below MeV. Above that energy, uncertainties are higher due to both angular correction uncertainties as well as larger uncertainties on the absolute detector efficiency. For all lines below 2 MeV, the measured cross sections from individual detectors are added together with appropriate coefficients to cancel out anisotropic effects. Above MeV, the four detectors simply have their measured cross sections averaged, so . Our final cross section is then given as the weighted sum of that from individual detectors after normalization to the iron measurement,
| (4) |
III.2 Systematic Uncertainties
Table 1 summarizes the cross section measurement systematic uncertainties. By design, large uncertainties associated with absolute detector efficiency and absolute neutron flux are canceled by the iron normalization. Thus, for , the systematic uncertainty is dominated by the precision of the reference iron cross-section measurements. We chose to treat discrepancies in angular-correction measurements between different detectors from Ref. Dietz, Mirco et al. (2017) as an angular uncertainty, making the iron angular distribution a leading uncertainty term.
Angular-distribution uncertainties for xenon were estimated by assuming that the xenon anisotropy should be similar to that of iron Dietz, Mirco et al. (2017) or lead Guiseppe et al. (2009), and using the largest anisotropy factors as a conservative estimate. Variations in measured xenon cross sections between individual HPGe detectors at different angles are consistent with or smaller than the 18% deviations found in other measurements, so this uncertainty is appropriate. For , this anisotropy is largely canceled as described in Sec. III.1, giving a smaller uncertainty.
| Source | Uncertainty |
| reference | 6.7% |
| angular correction | 7.9% |
| iron thickness | 2% |
| iron/xenon efficiency difference | 4% |
| ray attenuation | 3% |
| HPGe detector | 3% |
| HPGe detector | 6% |
| xenon thickness | 3.3% |
| xenon angular effects | 3% |
| xenon angular effects | 18% |
Attenuation corrections were calculated using MCNPX Pelowitz (2011), and the corrections are conservatively treated also as an uncertainty. The geometric efficiency differences between xenon and iron were computed with a simple custom Monte Carlo simulation, and are kept small by the use of multiple detectors at different angles. Detector -efficiency uncertainty is based on the efficiency fit to the 152Eu data. An additional uncertainty is added above 2 MeV to account for deviations in the efficiency curve extrapolation Blank et al. (2015); MacMullin (2013); Fotiades et al. (2013). Xenon-thickness uncertainty comes from temperature uncertainty, changing xenon pressure, and a slight ballooning of the kapton windows at the ends of the target vessel.
III.3 Metastable state
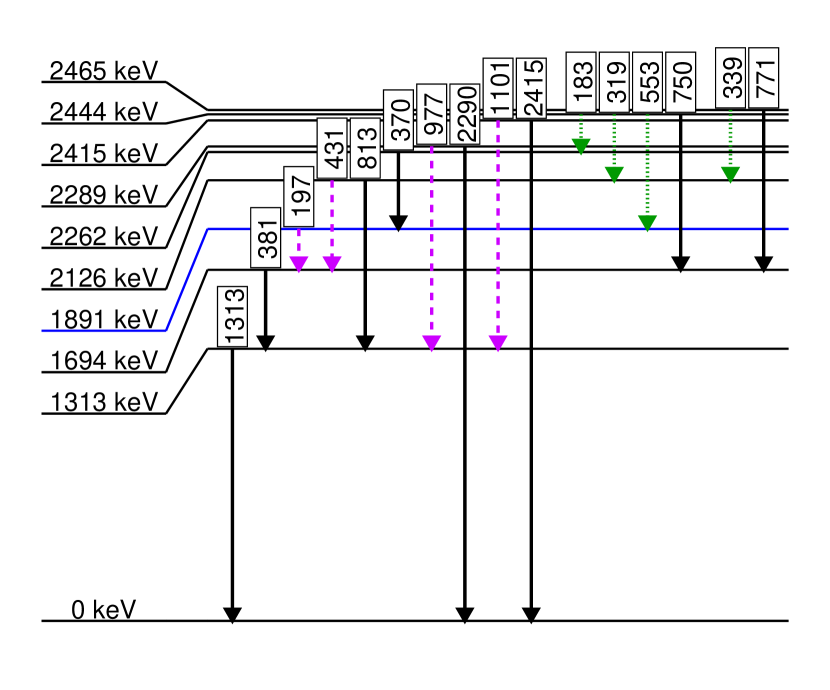
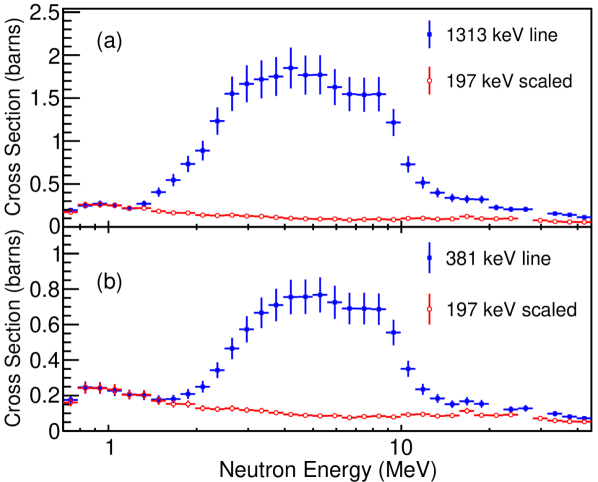
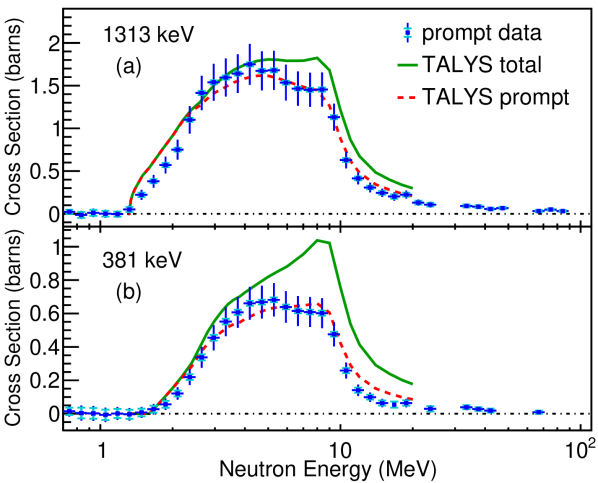
Figure 3 shows the level diagram for , with levels up to 2500 keV. Notably, the 1891 keV level is much longer-lived than the others, with a nearly 3 s half-life Sonzogni (2002). This meta-stable state interferes with the time-of-flight measurement of . As a result, the 197 keV -emission cross section cannot be properly measured, and there is a delayed component to the 1313 keV and 381 keV lines that interferes. We subtract off the delayed component of these lines (which has the same time-of-flight distribution as the 197 keV line) to leave only prompt emission. Figure 4 shows this subtraction for both these lines. While the full cross section for this delayed emission cannot be precisely determined, we estimate from our measurements that 28% (12%) of emission is delayed for the 381 keV (1313 keV) line.
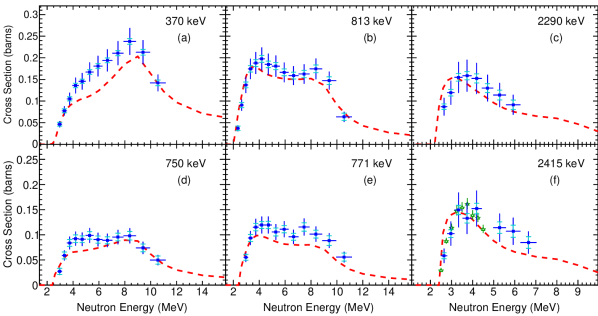
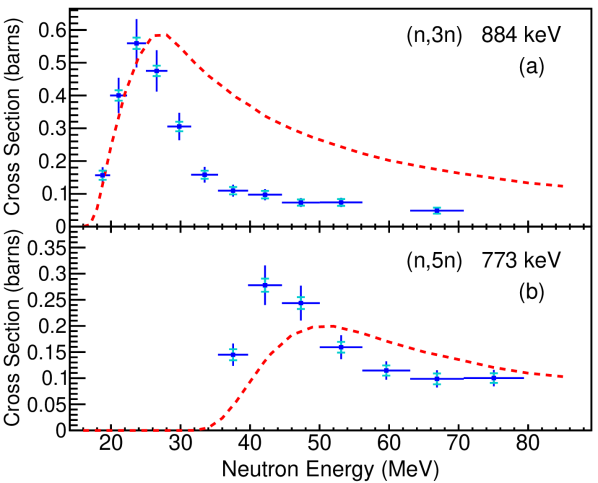
IV Inelastic Scattering Measurements
Cross sections could only be determined for lines with sufficient yield to be fit successfully in all available detectors, and only if a ray of similar intensity and energy is not present in background. After these selections, we are left with eight lines from interactions. These measured cross sections are shown in Fig. 5 and Fig. 6, along with estimates from TALYS 1.8 Koning et al. (2008). Several other lines were observed, with most of them identified as being due to interactions for . Most of these either had low statistics or an interfering background, and so a full cross section determination was not possible. The cross section for one line each from and could be determined, and are shown in Fig. 7. In these figures, bins in with no marker do not necessarily indicate zero cross section, but may be bins where, due to low statistics, the peak fit for data from one or more detectors failed. Lines at 1640, 1690, and 2009 keV appeared for MeV and were identified as likely being from , though were not measurable due to interfering nearby lines or low statistics. These lines do not correspond to any obvious known transition in the ENSDF database Bhat (1992). Another unknown line at 1355 keV was seen, though it only appeared with MeV, and is likely an unknown line from some daughter nucleus of a neutron-induced reaction.
V Limits on new lines relevant to
The discovery of a new line produced from neutron interactions on could be an important consideration for next-generation experiments. As such, we have searched for peaks between 2350 and 2550 keV around the Q-value of 2457.8 keV Redshaw et al. (2007). The count spectra from the four HPGe detectors summed is shown in Fig. 8. For the calculation of cross-section limits, we use only data from one detector (systematic uncertainties are larger than statistical ones here). Limits are based on a sliding 5 keV window, in which counts above background are considered with Poisson statistics to determine a 90% upper limit on peak intensity. The rest of the cross-section determination and systematic uncertainties are as described in Sec. III.
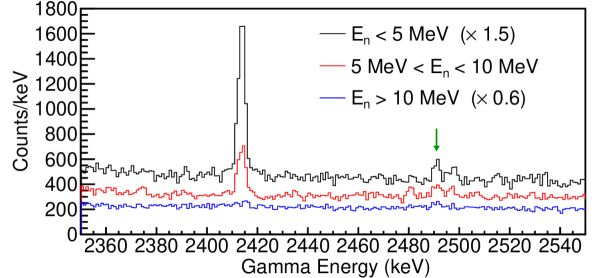
There is a known line at 2415 keV from a transition to the ground state of . This is separated in energy from the Q-value by 1.8%. Our measurements of this line are shown in Fig. 6(f). The rest of the spectrum is relatively flat, though there is a small peak near 2491 keV, 1.4% away from the Q-value. This peak is seen in all three regions, and we determined cross section upper limits on this peak to be 13, 48, and 37 mb in the MeV, MeV MeV, and MeV ranges, respectively. Note that these limits are for cross sections averaged over the neutron energy range, weighted by the GEANIE flux. The source of this peak is unknown, but its energy matches a known transition in , and a search for this peak in our non-xenon data was inconclusive. No other new peaks of comparable magnitude were found near the Q-value, so these cross-section limits hold for any new peaks in this energy range.
VI Novel Calibration Technique
Neutron-induced excitation to the 1313 keV level is the primary -producing interaction observed for fast neutrons below 2.5 MeV in energy. Thus, neutron inelastic scattering could potentially be a source of mono-energetic 1313 keV rays for calibration of a future detector. A great strength of proposed experiments, such as nEXO Al Kharusi et al. (2018), is the pure, monolithic, self-shielding, active detector volume. Without radioisotopes being introduced into the detector, very few rays will reach the central part of the xenon volume. This is excellent for background reduction, but potentially problematic for calibration.
It may be possible to use DD (deuterium-deuterium) generator located outside the xenon volume to deliver 2.5 MeV neutrons deep into the detector, exciting nuclei and producing 1313 keV rays. The neutrons from the DD generator will scatter in the xenon both elastically and inelastically. Elastic scatters will tend to deposit small amounts of energy in nuclear recoils, but most neutrons will inelastically scatter or leave the xenon volume before slowing down to an energy below the threshold for inelastic scattering. Using a Geant4 Agostinelli et al. (2003); Allison et al. (2006) simulation with liquid xenon enriched to 90% , we found the effective interaction length for DD generator neutrons to inelastically scatter to be 23 cm. This compares very favorably to rays, which have an interaction length below 10 cm. Thus, this could be a useful alternative to external sources for calibrating detector response for interactions near the detector center. While calibration using neutron inelastic scatters has been proposed for nuclear recoil measurements in liquid noble gas detectors Polosatkin et al. (2014), we believe this would be a new technique for detectors designed for electron recoil measurements.
There would be some challenges in implementing this calibration method. The elastic scattering would deposit additional energy in the detector beyond the mono-energetic 1313 keV line. However, these depositions will produce only small amounts of scintillation and ionization (reduced further by quenching), and the position-dependence of this could be corrected for via simulations which do not depend on the detector response, only the neutron propagation physics and quenching factors. The generator would need to be brought near the xenon volume in such a way as to avoid negatively impacting radiopurity during normal running. Neutron captures could likely be excluded from calibration data based on interaction timing, but possible activation or neutron damage to electronics, while unlikely with neutrons below 3 MeV, would need to be considered. Finally, the costs and benefits of this method must be weighed against other techniques for calibrating deep inside detectors, including external -ray calibration and dissolving a radioisotope in the xenon volume Aprile et al. (2017).
VII Discussion and Summary
The cross sections measured here are similar to estimates from TALYS simulations. The cross sections are not well estimated by TALYS, so this measurement may suggest possible improvements to reaction modeling. All TALYS predictions presented in this work were obtained with the TALYS 1.8 default settings. We have not attempted to test the dependence of the predictions on different models or involved quantities. These measurements, along with newly observed lines, may also be used to refine future nuclear evaluations and improve simulations. The measured cross section for the 2415 keV line matches well with recent measurements using MeV made by Peters et al. Peters et al. (2017). The dependence of the cross sections for the 1313 keV and 884 keV lines agree within uncertainties with unnormalized measurements from Fotiades et al. Fotiades et al. (2007).
We have searched for new lines near the Q-value, and set limits on their possible neutron interaction cross sections for a wide range of . Any lines which may interfere with measurement have considerably smaller cross sections than the known line at 2415 keV. Thus, potential fast-neutron-induced backgrounds to have been well-catalogued, and are unlikely to impact future experiments.
The calibration technique proposed here for large liquid noble gas detectors using neutron inelastic scattering to provide a mono-energetic -ray could be valuable for future experiments. The costs and challenges of this technique will need to be weighed against existing techniques to determine viability, but, for relevant experiments, it should be worth considering.
VIII Acknowledgments
This work was funded by US Department of Energy Grant No. DE-SC0012191. This work was performed under the auspices of the U.S. Department of Energy (DOE) under Contract No. DE-AC52-06NA25396. This work has benefitted from use of the LANSCE accelerator facility supported under DOE Contract No. DE-AC52-06NA25396. We thank Vladimir Belov for his help studying neutron inelastic scattering as a calibration technique.
References
- Al Kharusi et al. (2018) S. Al Kharusi et al. (nEXO), (2018), arXiv:1805.11142 [physics.ins-det] .
- Brunner and Winslow (2017) T. Brunner and L. Winslow, Nucl. Phys. News 27, 14 (2017), arXiv:1704.01528 [hep-ex] .
- Albert et al. (2018) J. B. Albert et al. (nEXO Collaboration), Phys. Rev. C 97, 065503 (2018), arXiv:1710.05075 .
- Gando et al. (2016) A. Gando et al. (KamLAND-Zen Collaboration), Phys. Rev. Lett. 117, 082503 (2016).
- Martín-Albo et al. (2013) J. Martín-Albo et al. (NEXT Collaboration), Journal of Physics: Conference Series 460, 012010 (2013).
- Chen et al. (2017) X. Chen et al., Science China Physics, Mechanics & Astronomy 60, 061011 (2017).
- Redshaw et al. (2007) M. Redshaw, E. Wingfield, J. McDaniel, and E. G. Myers, Phys. Rev. Lett. 98, 053003 (2007).
- Albert et al. (2016) J. B. Albert et al., Phys. Rev. C94, 034617 (2016), arXiv:1605.05794 [nucl-ex] .
- Lisowski et al. (1990) P. W. Lisowski, C. D. Bowman, G. J. Russell, and S. A. Wender, Nuclear Science and Engineering 106, 208 (1990), https://doi.org/10.13182/NSE90-A27471 .
- Becker and Nelson (1997) J. A. Becker and R. O. Nelson, Nuclear Physics News 7, 11 (1997), https://doi.org/10.1080/10506899709410550 .
- Wender et al. (1993) S. Wender, S. Balestrini, A. Brown, R. Haight, C. Laymon, T. Lee, P. Lisowski, W. McCorkle, R. Nelson, W. Parker, and N. Hill, Nuclear Instruments and Methods in Physics Research Section A: Accelerators, Spectrometers, Detectors and Associated Equipment 336, 226 (1993).
- Guiseppe et al. (2009) V. E. Guiseppe, M. Devlin, S. R. Elliott, N. Fotiades, A. Hime, D. M. Mei, R. O. Nelson, and D. V. Perepelitsa, Phys. Rev. C79, 054604 (2009), arXiv:0809.5074 [nucl-ex] .
- Fotiades et al. (2004) N. Fotiades et al., Phys. Rev. C69, 024601 (2004).
- MacMullin (2013) S. MacMullin, Elastic and Inelastic Scattering of Neutrons from Neon and Argon: Impact on Neutrinoless Double-Beta Decay and Dark Matter Experimental Programs, Ph.D. thesis, University of North Carolina at Chapel Hill (2013).
- MacMullin et al. (2012) S. MacMullin, M. Boswell, M. Devlin, S. R. Elliott, N. Fotiades, V. E. Guiseppe, R. Henning, T. Kawano, B. H. LaRoque, R. O. Nelson, and J. M. O’Donnell, Phys. Rev. C 85, 064614 (2012).
- Beyer et al. (2014) R. Beyer et al., Nucl. Phys. A927, 41 (2014).
- Dietz, Mirco et al. (2017) Dietz, Mirco et al., EPJ Web Conf. 146, 11040 (2017).
- Radford (2000) D. Radford, “Notes on the use of the program gf3,” (2000).
- Fotiades et al. (2013) N. Fotiades, M. Devlin, R. O. Nelson, and T. Granier, Phys. Rev. C87, 044336 (2013).
- Kibédi et al. (2008) T. Kibédi, T. Burrows, M. Trzhaskovskaya, P. Davidson, and C. Nestor, Nuclear Instruments and Methods in Physics Research Section A: Accelerators, Spectrometers, Detectors and Associated Equipment 589, 202 (2008).
- Pelowitz (2011) D. B. Pelowitz, “MCNPX User’s Manual Version 2.7.0,” (2011), LA-CP-11-00438.
- Blank et al. (2015) B. Blank et al., Nucl. Instrum. Meth. A776, 34 (2015), arXiv:1404.1246 [physics.ins-det] .
- Sonzogni (2002) A. Sonzogni, Nuclear Data Sheets 95, 837 (2002).
- Koning et al. (2008) A. J. Koning, S. Hilaire, and M. C. Duijvestijn, in Proceedings of the International Conference on Nuclear Data for Science and Technology, edited by O. Bersillon, F. Gunsing, E. Bauge, R. Jacqmin, and S. Leray (EDP Sciences, 2008) pp. 211–214.
- Bhat (1992) M. R. Bhat, in Nuclear Data for Science and Technology, edited by S. M. Qaim (Springer Berlin Heidelberg, Berlin, Heidelberg, 1992) pp. 817–821, Data extracted using the NNDC On-Line Data Service from the ENSDF database, file revised as of 5/4/2018.
- Peters et al. (2017) E. E. Peters, T. J. Ross, S. H. Liu, M. T. McEllistrem, and S. W. Yates, Phys. Rev. C95, 014325 (2017).
- Agostinelli et al. (2003) S. Agostinelli et al. (GEANT4), Nucl. Inst. Methods Phys. Res., Sect. A 506, 250 (2003).
- Allison et al. (2006) J. Allison et al., IEEE Trans. Nucl. Sci. 53, 270 (2006).
- Polosatkin et al. (2014) S. Polosatkin, E. Grishnyaev, and A. Dolgov, Journal of Instrumentation 9, P10017 (2014), 1407.2718 [physics.ins-det] .
- Aprile et al. (2017) E. Aprile et al. (XENON), Phys. Rev. D95, 072008 (2017), arXiv:1611.03585 [physics.ins-det] .
- Fotiades et al. (2007) N. Fotiades et al., Phys. Rev. C75, 054322 (2007).