Status of the Chiral Magnetic Effect Search in Relativistic Heavy-Ion Collisions
Abstract
Quark interactions with topological gluon fields in QCD can yield local and violations which could explain the matter-antimatter asymmetry in our universe. Effects of and violations can result in charge separation under a strong magnetic field, a phenomenon called the chiral magnetic effect (CME). Experimental measurements of the CME-induced charge separation in heavy-ion collisions are dominated by physics backgrounds. Major theoretical and experimental efforts have been devoted to eliminating or reducing those backgrounds. We review the current status of these efforts in the search for the CME in heavy-ion collisions.
pacs:
Valid PACS appear hereI Introduction
Quantum chromodynamics (QCD) governs the strong interaction among quarks and gluons. Transitions between gluonic configurations from QCD vacuum fluctuations can be described by instantons/sphelarons and characterized by the Chern-Simons topological charge number Lee (1973); Lee and Wick (1974); Morley and Schmidt (1985); Kharzeev et al. (1998); Kharzeev (2006); Kharzeev et al. (2008); Fukushima et al. (2008); Kharzeev et al. (2016). Quark interactions with gluonic fields, causing transitions of nonzero topological charges, would change their chirality (an imbalance in left- and right-handed quarks), leading to parity () and charge conjugation parity () violations in local metastable domains Kharzeev et al. (1998); Kharzeev (2006); Kharzeev et al. (2008); Fukushima et al. (2008); Kharzeev et al. (2016). Such local violation in the strong interaction could explain the magnitude of the matter-antimatter asymmetry in the present universe Dine and Kusenko (2003).
In relativistic heavy-ion collisions, the approximate chiral symmetry is likely restored and the relevant degrees of freedom are quarks and gluons Adams et al. (2005); Adcox et al. (2005); Arsene et al. (2005); Back et al. (2005); Muller et al. (2012). In addition, an extremely strong magnetic field is produced by the spectator protons in the early times of those collisions Kharzeev (2006); Kharzeev et al. (2008); Fukushima et al. (2008); Muller and Schafer (2010); Kharzeev et al. (2016). It is possible that the magnetic field and the parity-violating local domains are on similar time scales in relativistic heavy-ion collisions. A chirality imbalanced domain of quarks under the strong magnetic field can then lead to a net electromagnetic current along the direction of the magnetic field Kharzeev (2006); Kharzeev et al. (2008); Fukushima et al. (2008); Muller and Schafer (2010); Kharzeev et al. (2016). This phenomenon is called the chiral magnetic effect (CME). Quarks hadronize into (charged) hadrons in the final state, leading to an experimentally observable charge separation.
An observation of the CME-induced charge separation in heavy-ion collisions would confirm several fundamental properties of QCD, namely, the approximate chiral symmetry restoration, topological charge fluctuations, and local and violations. The measurements of such a charge separation would provide a means to study the non-trivial QCD topological structures in relativistic heavy-ion collisions Lee (1973); Lee and Wick (1974); Morley and Schmidt (1985); Kharzeev et al. (1998); Kharzeev and Pisarski (2000). Extensive theoretical efforts have been devoted to characterize the CME, and intensive experimental efforts have been invested to search for the CME in heavy-ion collisions at BNL’s Relativistic Heavy Ion Collider (RHIC) and CERN’s Large Hadron Collider (LHC) Kharzeev et al. (2016).
II Early measurements and background contamination
In heavy-ion collisions, the particle azimuthal angle () distribution in momentum space is often described by a Fourier decomposition,
| (1) |
where is the reaction-plane (RP) direction, defined to be the direction of the impact parameter vector and is expected on average to be perpendicular to the magnetic field direction. The parameters and account for the directed flow and elliptic flow Reisdorf and Ritter (1997). The parameters can be used to describe the charge separation effects. Usually only the first harmonic coefficient is considered. Positively and negatively charged particles have opposite values, . However, they average to zero because of the random topological charge fluctuations from event to event Kharzeev (2006), making a direct observation of this parity violation effect impossible. It is possible only via correlations, e.g. measuring with the average taken over all events in a given event sample. The three-point correlator is designed for this purpose Voloshin (2004),
| (2) |
Technically, the correlator can also be calculated by the three-particle correlation method without an explicit determination of the RP Voloshin (2004),
| (3) |
The role of the RP is instead fulfilled by the third particle, , and is the elliptic flow parameter of the particle . The two sides in Eq. (3) would be equal if particle is correlated with particles and via only the common correlation to the RP, without contamination of nonflow (few-particle) correlations between and and/or .
The variable is vulnerable to particle correlation backgrounds, such as those caused by general momentum conservation Pratt et al. (2011); Bzdak et al. (2011). Those backgrounds are charge independent and thus the difference between opposite-sign (OS) and same-sign (SS) charge pairs is usaully used to search for the CME,
| (4) |
Here OS (, ) and SS (, ) stand for the charge sign combinations of the and particles.
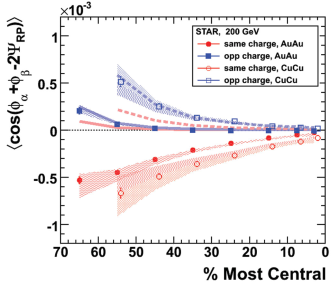
A significant has indeed been observed in heavy-ion collisions at RHIC and LHC Abelev et al. (2010, 2009); Adamczyk et al. (2013, 2014a); Abelev et al. (2013a); N. N. Ajitanand (2010). Figure 1 shows the correlator as a function of the collision centrality in Au+Au and Cu+Cu collisions at = 200 GeV from STAR Abelev et al. (2010). Similarly, and correlators have been observed in Au+Au collisions at = 7.7-200 GeV from STAR Adamczyk et al. (2014a) and in Pb+Pb collisions at 2.76 TeV from ALICE Abelev et al. (2013a). At high collision energies is larger than , consistent with the CME expectations Abelev et al. (2010, 2009). The difference between and decreases with increasing centrality, mainly because of the combinatorial dilution effect by the multiplicity. Under the CME scenario, such a decrease would also be consistent with the expectation of the magnetic field strength to decrease with increasing centrality Kharzeev (2006); Kharzeev et al. (2008); Fukushima et al. (2008); Muller and Schafer (2010); Kharzeev et al. (2016). At the low collision energy of =7.7 GeV, the difference between and disappears. This could be consistent with the disappearance of the CME at this energy, where hadronic interactions dominate Adamczyk et al. (2014a). Thus, the correlator measurements are qualitatively consistent with the CME expectation Abelev et al. (2010, 2009); Adamczyk et al. (2013, 2014a).
There are, however, mundane physics that could produce the same effect as the CME in the variable Wang (2010); Pratt et al. (2011); Bzdak et al. (2011); Zhao (2018a). An example would be decays of resonances (or clusters in general) coupled with their Wang (2010); Wang and Zhao (2017); the variable is ambiguous between a back-to-back OS pair from the CME perpendicular to the RP and an OS pair from a resonance decay along the RP. The resonance background was pointed out earlier but the magnitude estimate of the background contribution was wrong by 1-2 orders of magnitude Voloshin (2004). Calculations with local charge conservation and momentum conservation effects can almost fully account for the measured signal at RHIC Pratt et al. (2011); Schlichting and Pratt (2011); Bzdak et al. (2011). A Multi-Phase Transport (AMPT) Zhang et al. (2000); Lin and Ko (2002); Lin et al. (2005) model simulations can also largely account for the measured signal Ma and Zhang (2011); Shou et al. (2014). In general, these backgrounds are generated by two particle correlations (e.g. from resonance decays) coupled with elliptic flow of the parent sources (resonances):
| (5) |
where is the angular correlation from the resonance decay, is the of the resonance. The factorization of with is only approximate, because both depend on of the resonance Wang and Zhao (2017).
The first unambiguous experimental evidence that background dominates was from small system collisoins Khachatryan et al. (2017). The small system p+A or d+A collisions provide a control experiment, where the CME signal can be “turned off”, but the -related backgrounds still persist. In non-central heavy-ion collisions, the , although fluctuating Alver et al. (2007), is generally aligned with the RP, thus generally perpendicular to the magnetic field. The measurement is thus entangled by the two contributions of the possible CME and the -induced background. In small-system p+A or d+A collisions, however, the is determined purely by geometry fluctuations, uncorrelated to the impact parameter or the magnetic field direction Khachatryan et al. (2017); Belmont and Nagle (2017); Tu (2017). As a result, any CME signal would average to zero in the measurements with respect to the . Background sources, on the other hand, contribute to small-system p+A or d+A collisions similarly as to heavy-ion collisions. Comparing the small system p+A or d+A collisions to A + A collisions could thus further our understanding of the background issue in the measurements.
Figure 2 upper panel shows the first measurements in small system p+Pb collisions at 5.02 TeV by CMS Khachatryan et al. (2017), compared with Pb+Pb at the same energy. Within uncertainties, the SS and OS correlators in p+Pb and Pb+Pb collisions exhibit the same magnitude and trend as a function of the event multiplicity. The CMS data further show that the and multiplicity dependences of the correlators are similar between p+Pb and Pb+Pb collisions Khachatryan et al. (2017). The dependence shows a traditional short-range correlation structure, a behavior also observed in the early STAR data Abelev et al. (2010). This indicates that the correlations may come from the hadonic stage of the collisions, while the CME is expected to be a long-range correlation arising from the early stage. The similarity seen between high-multiplicity p+Pb and peripheral Pb+Pb collisions strongly suggests a common physical origin, challenging the attribution of the observed charge-dependent correlations to the CME Khachatryan et al. (2017).
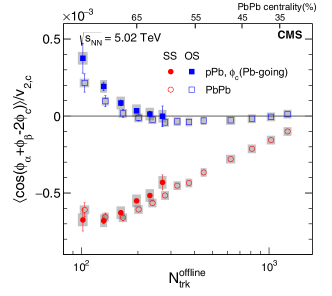
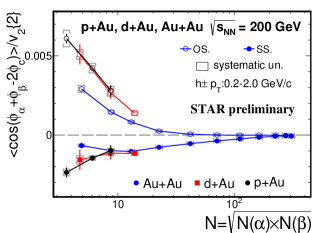
Similar control experiments have also been performed at RHIC, using p+Au and d+Au collisions Zhao (2018b, c). Figure 2 lower panel shows the and correlators as functions of particle multiplicity () in p+A and d+A collisions at GeV. Here is taken as the geometric mean of the multiplicities of particle and . The corresponding Au+Au results are also shown for comparison. The trends of the correlators are similar, decreasing with increasing . Similar to LHC, the small system data at RHIC are found to be comparable to Au+Au results at similar multiplicities. However, quantitative differences may exist. The CMS p+Pb data are from high multiplicity collisions, overlapping with Pb+Pb data in the 30-50% centrality range, whereas the RHIC p(d)+Au data are from minimum bias collisions, overlapping with Au+Au data only in peripheral centrality bins. Since the decreasing rate of with is larger in p(d)+Au than in Au+Au collisions, the p(d)+Au data could be quantitatively consistent with the Au+Au data at large in the range of the 30-50% centrality. Given that the STAR data are preliminary and that the multiplicity coverages are different between RHIC and LHC, the similarities in the RHIC and LHC data regarding the comparisons between small-system and heavy-ion collisions are astonishing.
III Current status of CME measurements
Experimentally, there have been many efforts to reduce or eliminate backgrounds. These include: (1) event shape selection, by varying the event-by-event exploiting statistical (and dynamical) fluctuations Adamczyk et al. (2014b); Wen et al. (2018), (2) event shape engineering exploiting dynamical fluctuations in Schukraft et al. (2013); Acharya et al. (2018); Sirunyan et al. (2018); (3) comparative measurements with respect to the RP and the participant plane (PP) Xu et al. (2017a, b); Zhao (2018d) taking advantage of the geometry fluctuation effects on the PP and the magnetic field direction; and (4) the invariant mass dependence of the to identify and remove the resonance decay backgrounds Zhao et al. (2017); Zhao (2018c, b, d); Wang (2018a). We will review these efforts in this section.
There have been several other studies related to CME that we do not cover in this review. One is to take the ratio of the measured to the “expected” elliptic flow background Bzdak et al. (2013); Adamczyk et al. (2014a); Wen (2017), the so-called variable, and study its behavior as functions of centrality and particle species. Such a study has yielded limited insights because the expected background is not well determined. The other study is to investigate the broadness of the variable Ajitanand et al. (2011); Magdy et al. (2018) and compare it to CME signal and background models. However, it is unclear whether such comparisons lead to unique conclusions Bozek (2018); Feng et al. (2018). It has been suggested Voloshin (2010) that, because the Uranium (U) nucleus is strongly deformed, U+U collisions could give insights into the background issue. In very central U+U collisions, the magnetic field is negligible and the elliptic flow is appreciable because of the deformed nuclei in the initial state. This would yield appreciable measurement in those very central collisions. However, because the initial geometry from random orientations of the colliding nuclei is difficult to experimentally disentangle, the U+U data have so far not generated enough insights as anticipated Wang (2013); Tribedy (2017).
III.1 Event-by-event selection methods
The main background sources of the measurements are from the -induced effects. These backgrounds are expected to be proportional to ; see Eq. (5). One possible way to eliminate or suppress these -induced backgrounds is to select “spherical” events with exploiting the statistical and dynamical fluctuations of the event-by-event (ExE) . Due to finite multiplicity fluctuations, one can easily vary the shape of the final particle momentum space, which is directly related to the backgrounds Adamczyk et al. (2014b).
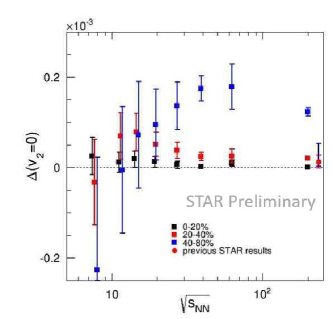
By using the ExE , STAR has carried out the first attempt to remove the backgrounds Adamczyk et al. (2014b) in their measurement of the charge multiplicity asymmetry correlations, called the observable (which is similar to the correlator). The ExE can be measured by the vector method:
| (6) |
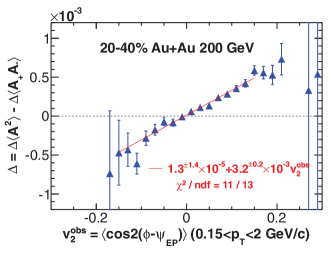
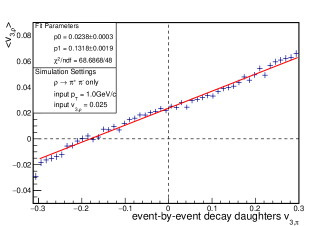
sums over all particles of interest (used for the variable) in each event; is the azimuthal angle of the -th particle, and is the weight. Depending on experiments and detectors, the weights are applied in order to account for finite detector granularity or efficiency. In Eq. (6), is the event plane (EP) azimuthal angle, reconstructed from final-state particles, as a proxy for the PP azimuthal angle () that is not experimentally accessible. To avoid self-correlation, particles used for the EP calculations are exclusive from the particles of interest used for and . Figure 3 upper panel shows the as a function of in 20-40% Au+Au collisions at GeV Adamczyk et al. (2014b). A clear linear dependence is observed as expected from backgrounds. By selecting the events with , the backgrounds in the observable are largely reduced Adamczyk et al. (2014b); Tu (2015); Zhao (2017). The intercept of a linear fit, sensitive to potential CME signals, is consistent with zero. The lower panel of Fig. 3 shows the extracted intercept as a function of centrality for Au+Au collisions of different beam energies Tu (2015); Zhao (2017). Positive intercepts are observed, including at beam energy of GeV with more statistics of the preliminary data.
A similar method selecting events with the ExE variable has been proposed recently Wen et al. (2018). Here is the magnitude of the second-order reduced flow vector Adler et al. (2002), defined as:
| (7) |
and is related to . To suppress the -induced background, a tight cut, , is proposed. The cut is tight because corresponds to a zero harmonic to any plane, while corresponds to zero harmonic with respect to the reconstructed EP in the event. This method is therefore more difficult than the ExE method because the extrapolation to zero is statistics limited and because it is unclear whether the background is linear in or not. Figure 4 shows the preliminary results from this method by STAR Wang (2018b). An extrapolation to zero indicates a positive intercept (see Fig. 4 upper panel). A similar study using the third harmonic EP indicates a positive intercept as well (see Fig. 4 lower panel), comparable in magnitude to that from the method.
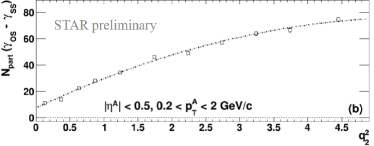
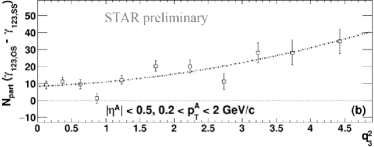
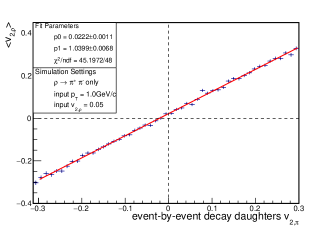
These methods assume the backgrounds to be linear in of the final-state particles. However, the backgrounds arise from the correlated pairs from resonance/cluster decays coupled with the of the parent sources, not that of the final-state particles. In case of resonance decays, depends on the of the resonances, not that of the decay particles or all final-state particles. Since the in this method is the event-by-event quantity, the resonance is unnecesarily zero when the final-state particle is selected to be zero. This is shown in Fig. 5 in a resonance toy model simulation Wang and Zhao (2017) where the average of the resonances in events with are found be to nonzero. It is interesting to note that the intercepts are similar for and , and the slope for is significantly smaller than that for . This would explain the features in Fig. 4 where the inclusive is much smaller than the inclusive but the projection intercepts are similar. We conclude that the positive intercept results from the ExE and methods are likely still contaminated by flow backgrounds. Moreover, it is difficult, if not at all possible, to ensure the of all the background sources to be zero on event-by-event basis. Therefore, it is challenging to completely remove the flow backgrounds by using the ExE or method Wang and Zhao (2017).
III.2 Event shape engineering
Based on the -driven background Wang (2010); Bzdak et al. (2011); Schlichting and Pratt (2011), it is essential to explicitly investigate the dependence of the CME observable. One of the main diffuculties is that the conventional method of varying the is to select different centralities on an event-averaged basis, which will inevitably alter the initial magnetic field due to its initial-geometry dependence. However, this difficulty can be overcome by a new experimental method, called “Event Shape Engineering” (ESE), to select events with very different within a narrow centrality range, where the expected CME signal is mostly independent of this event-by-event selection Schukraft et al. (2013); Acharya et al. (2018); Sirunyan et al. (2018). This provides a way to decouple effects from the magnetic field and the , and thus a possible solution to disentangle background contributions from potential CME signals.
In the method of ESE, instead of selecting on directly, one uses the -vector [Eqs. (6), (7)] to access the initial participant geometry, which selects different event shapes from the initial-state geometry fluctuations Schukraft et al. (2013); Voloshin (2010); Bzdak (2012); Acharya et al. (2018); Sirunyan et al. (2018). In particular, the ESE is performed based on the magnitude Adler et al. (2002). This is very similar to the ExE method described in Sect. III.1, with one important distinction. In the ExE method, the is computed using particles of interest, whereas in ESE, the is computed using particles displaced away (e.g. in pseudorapidity) from the particles of interest. Thus, the of the particles of interest differ for different ESE selections because of dynamical fluctuations of , while the variation in in the ExE method is due to mainly statistical fluctuations.
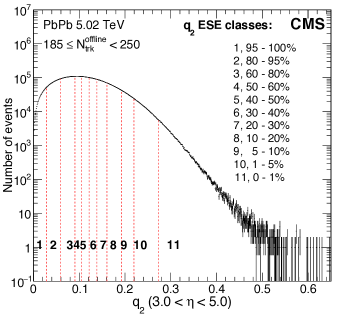
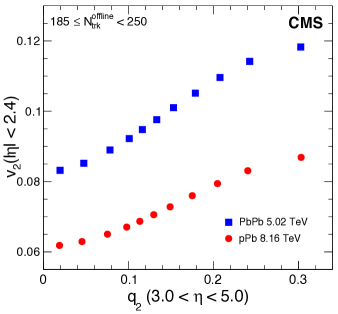
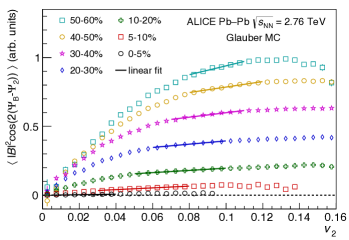
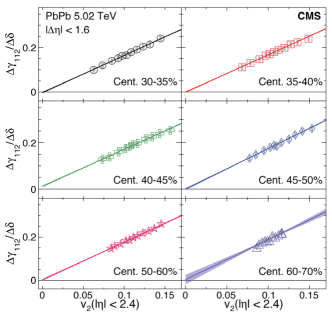
Figure 6 (upper) shows the distribution in Pb+Pb collisions from the CMS Collaboration Sirunyan et al. (2018). Events within a narrow multiplicity range are divided into several classes with each corresponding to a fraction of the full distribution, where the 0-1% represents the class with the largest value. In Fig. 6 (lower), the average values at mid-rapidity are presented in each selected class, where the strong proportionality between these two quantities suggests their underlying correlation from the initial-state geometry Sirunyan et al. (2018). Therefore, the correlator can be studied as a function of explicitly using the selections.
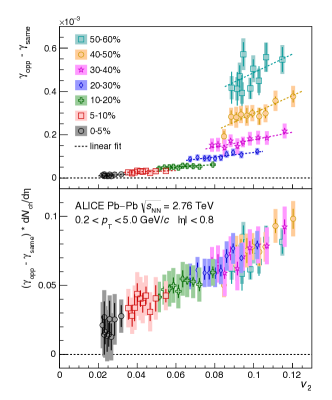
The correlator has been studied as a function of using the ESE method in different centrality classes in Pb+Pb collisions from the ALICE Collaboration Acharya et al. (2018), shown in Fig. 7 (upper). In order to remove the trivial multiplicity dilution effect, the correlator that is scaled by the charge-particle density () in a given centrality range, is also shown in Fig. 7 (lower). The data indicate a strong linear dependence on the measured , where different centralities fall onto the same linear trend after the multiplicity scaling. This observation is qualitatively consistent with a background scenario, i.e., local charge conservation coupled with anisotropic flow Wang (2010); Pratt et al. (2011); Bzdak et al. (2011); Hori et al. (2012); Wang and Zhao (2017); see Eq. (5).
As argued earlier, the advantage of using the ESE is to independently evaluate the -dependent background from the correlator without significantly changing the CME signal due to the magnetic field. However, this assumption is not exactly true as the observable signal of the CME also depends on how precise the can be measured; in other words, the signal extraction depends on the resolution. From the study of the ALICE experiment Acharya et al. (2018), the signal dependence on the (resolution) has been explicitly investigated using different Monte Carlo (MC) Glauber calculations, shown in Fig. 8. Specifically, the CME signal is assumed to be proportional to , where and are the magnitude and azimuthal direction of the magnetic field. As one can see, the dependence is stronger in small region than in large , and in most central or most peripheral events than in mid-central. Therefore, with the input of the signal dependence on , the residual CME signal can be extracted based on the different dependences of signal and background correlation on the measured .
To extract the contribution of the possible CME signal from the current measurements, a linear function is fit to the data:
| (8) |
Here accounts for an overall scale, and the is the normalized slope, reflecting the dependence. In a pure background scenario, the correlator is proportional to and the parameter is expected to be unity, thus Eq. 8 is reduced to . On the other hand, a significant CME contribution would result in a non-zero intercept at of the linear functional fits.
In a two-component model with signal and background, a measured observable () can be expressed as:
| (9) |
and are the values of the observable from signal and background respectively, and represents the fraction of signal contribution in the measurement. The from the fit to the measured data is thus a combination of CME signal slope () and the background slope ():
| (10) |
where represents the CME fraction to the correlator from the measurements, and is the slope parameter from the MC calculations in Fig. 8.
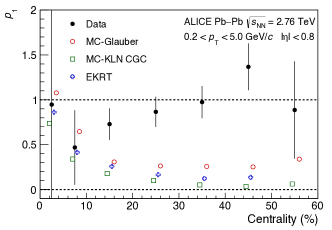
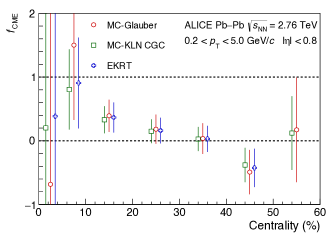
Figure 9 (upper) shows the centrality dependence of from data and from signal expectations based on MC-Glauber, MC-KLN CGC and EKRT models Acharya et al. (2018). Figure 9 (lower) presents the estimate from the three models. The extracted from central (0-10%) and peripheral (50-60%) events have large statistical uncertainties. Combining the data from 10-50% centrality with an assumption of a constant CME contribution, it gives a value of , , and for the MC-Glauber, MC-KLN CGC and EKRT models, respectively. These results are consistent with zero CME fraction within the uncertainty, and correspond to upper limits on of 33%, 26% and 29%, respectively, at 95% confidence level (CL) for the centrality range of 10-50% Acharya et al. (2018).
The above analysis method is model-dependent, which relies on precise modeling of the correlation between magnetic field and in a given centrality range. Another approach, adopted by CMS, is to select very narrow centrality ranges with wide coverage Sirunyan et al. (2018). The signal and background contribution to the correlator can be separated as Bzdak et al. (2013):
| (11) |
Here, represents the charge-dependent two-particle azimuthal correlator and is a parameter independent of , mainly determined by the kinematics and acceptance of particle detection Bzdak et al. (2013). Using the ESE to select events with different , the above Eq. (11) can be explicitly tested and the -independent component of the correlator (), which is related to the CME signal, can be extracted. The charge-independent background sources are eliminated by taking the difference of the correlators () between same- and opposite-sign pairs, as was done in Ref. Acharya et al. (2018). Therefore, Eq. (11) becomes:
| (12) |
From the ESE, it is assumed that the correlator is independent of , while it has been found that it is not the case for peripheral events, mainly due to the multiplicity bias from the selection Sirunyan et al. (2018). Therefore, in order to remove the dependence on correlator, both sides of Eq. (12) are divided by and the equation can be simplified into
| (13) |
where represents the -independent component (scaled by ) that could be caused by the contribution of a CME signal.
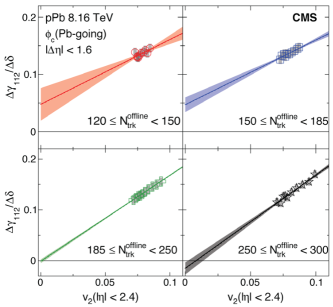
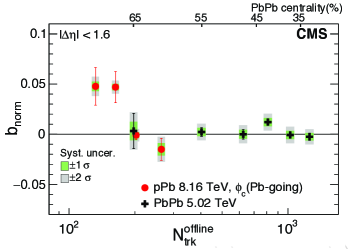
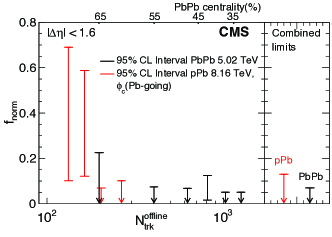
Figure 10 shows the ratio of as function of for different multiplicity ranges in p+Pb (upper) and for different centrality ranges in Pb+Pb (lower) collisions Sirunyan et al. (2018) with linear fits and their statistical uncertainty bands. The extracted values of the intercept parameter are shown as a function of event multiplicity in Fig. 11 (upper). Within statistical and systematic uncertainties, no significant positive value of is observed. Result shows that the -independent contribution to the correlator is consistent with zero, which suggests the underlying mechanism of the observed charge-dependent correlation is due to a background-only scenario Sirunyan et al. (2018). Based on the assumption of a nonnegative CME signal, the upper limit of the -independent fraction in the correlator is obtained from the Feldman-Cousins approach Feldman and Cousins (1998) with the measured statistical and systematic uncertainties. Figure 11 (lower) shows the upper limit of the fraction , the ratio of the value to the value of , as a function of event multiplicity at 95% CL. The fraction of the -independent component of the correlator is less than 8-15% for most of the multiplicity or centrality ranges. The combined limits from all presented multiplicities and centralities are also shown in p+Pb and Pb+Pb collisions in Fig. 11 (lower). An upper limit on the -independent fraction of the correlator, or possibly the CME signal contribution, is estimated to be 13% in p+Pb and 7% in Pb+Pb collisions, at 95% CL. The results are consistent with a -dependent background-only scenario, posing a significant challenge to the search for the CME in heavy ion collisions using three-particle azimuthal correlations Sirunyan et al. (2018).
III.3 Measurements with respect to RP and PP
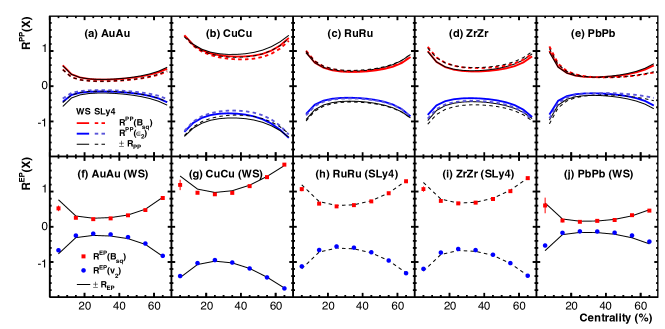
The CME-induced charge separation is driven by the magnetic field, and is therefore the strongest along the magnetic field direction. The major background to the CME is related to the elliptic flow anisotropy, determined by the participant geometry, and is therefore the largest with respect to the . The magnetic field direction and the PP direction are different. These facts led to the novel idea to determine the CME signal (and flow background) from measurements with respect to the RP and PP in the same collision event Xu et al. (2017a).
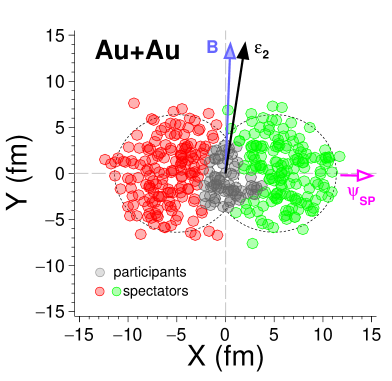
In general, the and are correlated with the , and therefore are indirectly correlated with each other. While the magnetic field is mainly produced by spectator protons, their positions fluctuate, so is not always perpendicular to the . The position fluctuations of participant nucleons and spectator protons are independent, thus and fluctuate independently about . Figure 12 depicts the various azimuthal directions in the overlap transverse plane from a single MC Glauber event in mid-central Au+Au collision at 200 GeV.
The eccentricity of the transverse overlap geometry is related to the PP. It yields the largest . The with respect to the RP is smaller, by the factor of given by the relative angle between RP and PP. Because of fluctuations Alver et al. (2007), the PP and RP do not coincide, so has a value always smaller than unity. The magnetic field effect for CME, , is, on the other hand, strongest along the RP direction because the magnetic field is mainly generated by the spectator protons. The effect is smaller along the PP, again by the same factor . The relative difference
| (14) |
in the eccentricity (i.e. is ) and magnetic field strength (i.e. is ) are the opposite. Namely
| (15) |
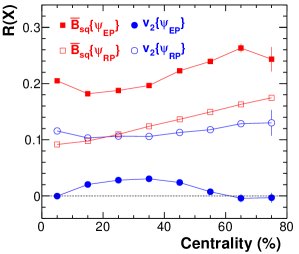
This is verified by MC Glauber model calculations Xu et al. (2014); Zhu et al. (2017) for various collision systems, shown in the upper panels of Fig. 13 Xu et al. (2017a). The AMPT Lin et al. (2005); Lin and Ko (2002) simulations using the reconstructed EP, shown in the lower panels of Fig. 13, also confirm the conclusion Xu et al. (2017a).
The , and are all theoretical concepts, and cannot be experimentally measured. Usually 1st-order harmonic EP from zero-degree calorimeters (ZDC), which measure spectator neutrons Reisdorf and Ritter (1997); Abelev et al. (2013b); Adamczyk et al. (2017), is a good proxy for . As a proxy for , the 2nd-order harmonic EP () reconstructed from final-state particles is used. Since is generally proportional to , one can obtain the factor by
| (16) |
The variable contains CME signal and the -induced background:
| (17) |
Assuming the is proportional to and is proportional to , one obtains the relative CME signal to background contribution:
| (18) |
where the definition is given by Eq. (14). The CME signal fraction in the measurements with respect to is
| (19) |
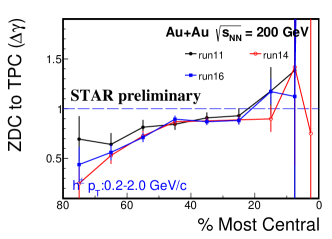
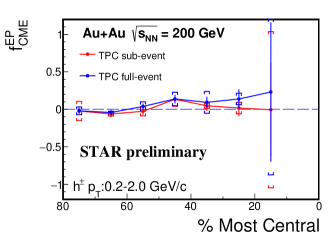
STAR has employed this novel method to extract the CME signal Zhao (2018d). Figure 14 upper panel shows the ratio of measured with respect to the ZDC 1st-order harmonic plane and that with respect to the TPC 2nd-order harmonic EP, and the middle panel shows the corresponding ratio of Zhao (2018d). The sub-event method is used where the particles of interest ( and ) are from one half of the TPC in pseudorapidity and the reference particle () is from the other half. The lower panel of Fig. 14 shows the extracted CME fraction by Eq. (19) Zhao (2018d). The full-event method , where all three particles are from anywhere of the TPC, is also shown. Within errors, there is no measurable difference between sub-events and full events, though nonflow contribution is expected to be larger in the latter. The extracted CME fraction is % from TPC sub-events and % from TPC full events in 20-50% centrality Au+Au collisions at 200 GeV Zhao (2018d).
III.4 Invariant mass method
It has been known since the very beginning that the were contaminated by background from resonance decays coupled with the elliptic flow () Voloshin (2004); Wang (2010); see Eq. (5). Because of resonance elliptic anisotropy, more OS pairs align in the than the magnetic field direction, and it is an anti-charge separation along . This would mimic the same effect as the CME in the variable Voloshin (2004); Abelev et al. (2009, 2010), which refers to the opposite-sign charges moving in the opposite directions along the magnetic field. Although the pair invariant mass () dependence of the would be the first thing to examine in terms of resonance background, it has been studied only recently Zhao et al. (2017). The invariant mass provides the ability to identify and remove resonance decay backgrounds, enhancing the sensitivity of the measurements to potential CME signals.
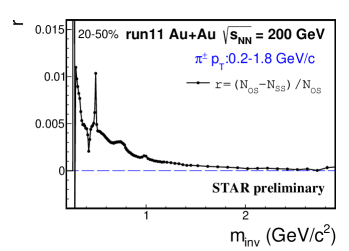
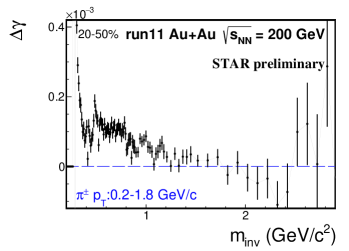
Figure 15 shows the preliminary results in mid-central Au+Au collisions from STAR experiments Zhao (2018b, d). The upper panel shows the dependence of the relative OS and SS pair difference, ; the lower panel shows that of the correlator. The structures are similar in and . In other words, the correlator traces the distribution of the resonances.
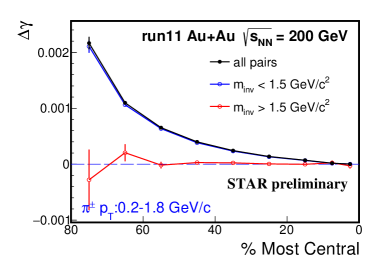
Most of the - resonances contributions are located in the low region Olive et al. (2014); Adams et al. (2004). It is possible to exclude them entirely by applying a lower cut. Results from AMPT model show that such a cut, although significantly reducing the statistics, can eliminate essentially all resonance decay backgrounds Zhao et al. (2017); Zhao (2018b, d). Figure 16 shows the average with a lower mass cut, GeV/ , in comparison to the inclusive measurement Zhao (2018b, d). The high mass is drastically reduced from the inclusive data. Preliminary STAR data combining Run-11, 14, and 16 yield a at GeV/ of % of the inclusive measurements Zhao (2018d); the systematic uncertainty is currently estimated from the differences among the runs Zhao (2018d).
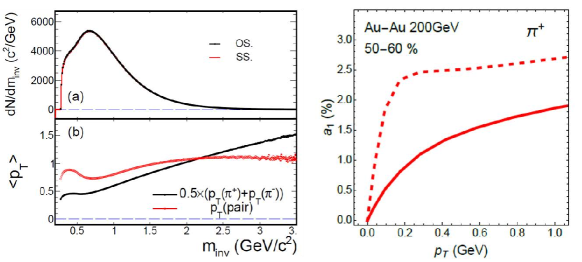
It is generally expected that the CME is a low phenomenon and its contribution to high mass may be small Kharzeev et al. (2008); Abelev et al. (2010). However, as shown in Fig. 17 left panel, a cut of 1.5 GeV/ corresponds to GeV/ which is not very high. Moreover, a recent study Shi et al. (2018) indicates that the CME signal is rather independent of at GeV/ (Fig. 17 right panel), suggesting that the signal may persist to high .
Nevertheless, one can use the low data to extract the possible CME signal. In order to do so, resonance contributions must be subtracted. In a two-component model, the dependence of the can be expressed Zhao et al. (2017) as
| (20) |
The first term is resonance contributions, where the response function is a smooth function of , while contains resonance mass shapes. Consequently, the first term is not “smooth” but a peaked function of . The second term in Eq. (20) is the CME signal which should be a smooth function of . The dependences of the CME signal and the background are distinctively different, and this can be exploited to identify CME signals at low . The feasibility of this method was investigated by a toy-MC simulation Wang and Zhao (2017) as well as in STAR data Zhao (2018b). A linear response function was assumed, guided by AMPT input Wang and Zhao (2017), and various forms of CME were studied Zhao (2018b).
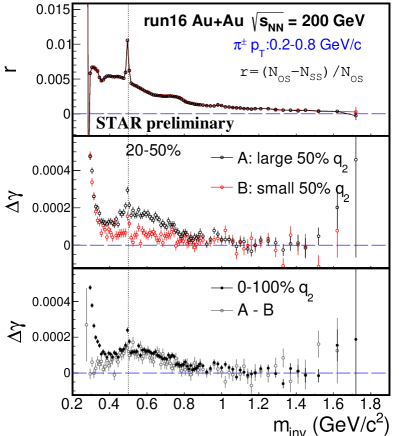
One difficulty in the above method is that the exact functional form of is presently unknown and requires rigorous modeling and experimental inputs. To overcome this difficulty, STAR has recently developed a method using the ESE technique Zhao (2018d). The events in each narrow centrality bin are divided into two classes according to the ExE , calculated by Eqs. (6) and (7) using particles of interest. Since the magnetic fields are approximately equal for the two classes while the backgrounds differ, the difference in is a good representation of the background shape. Figure 18 shows the distributions for such two classes ( and ) in the middle panel and the difference in the lower panel in 20-50% Au+Au collisions Zhao (2018d). The selection is applied in narrower centrality bins than 20-50%, and then the data are combined. The of all events is also shown in the lower panel of Fig. 18. Note that the pion identification here was done using the TPC energy loss () information only, different from that in Fig. 16.
The overall contains both background and the possible CME. With the background shape given by , the CME can be extracted from a fit . Note that in this fit model the background is not required to be strictly proportional to Wang (2018a). Figure 19 upper panel shows as a function of , where each data point corresponds to one bin in Fig 18 Zhao (2018d). Only the GeV/ data points are included in Fig. 19 because the from the lower region is affected by edge effects of the STAR TPC acceptance. Since the same data are used in and , their statistical errors are somewhat correlated. To propoerly handle statistical errors, one can simply fit the indendent measurements of versus , namely where and are the fit parameters. Figure 19 lower panel shows such a fit for the Run-16 Au+Au data Zhao (2018d). Combining Run-11, 14, and 16 data, STAR obtained the possible CME signal to be % of the inclusive , where the systematic uncertainty is presently assessed from the differences among the runs Zhao (2018d).
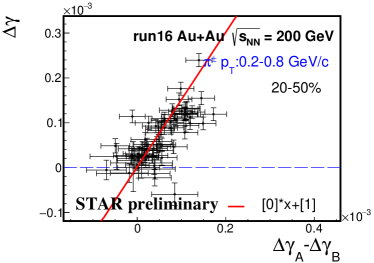
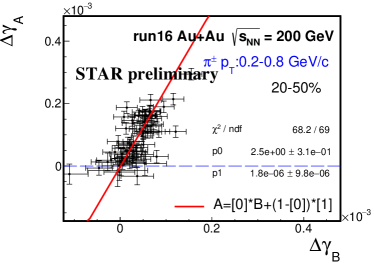
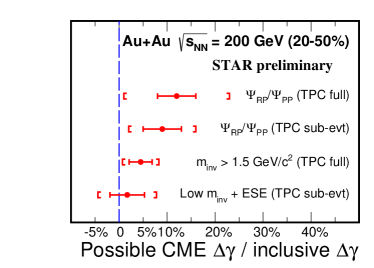
Figure 20 summarizes the current status of the CME results from STAR in 20-50% centrality Au+Au collisions at GeV Zhao (2018d), using the novel methods described in this subsection and in Sect. III.3. The data Zhao (2018d) show that the CME signal is small, on the order of a few percent of the inclusive , with relatively large errors. Note that the data points in Fig. 20 are from the same data using four different analysis methods. It is intriguing to note that all methods, although consistent with zero, seem to favor a positive value.
IV Outlook
The CME is related to the magnetic field while the background is produced by -induced correlations. In order to gauge differently the magnetic field relative to the , isobaric collisions have been proposed, such as and Voloshin (2010). and have the same mass number but different charge (proton) number. One would thus expect the same , which is insensitive to isospin, and 10% difference in the magnetic field. To test the idea of the isobaric collisions, MC Glauber calculations of the spatial eccentricity () and the magnetic field strength in Ru+Ru and Zr+Zr collisions have been carried out Deng et al. (2016); Huang et al. (2017). The Woods-Saxon spatial distribution is used Deng et al. (2016); Huang et al. (2017),
| (21) |
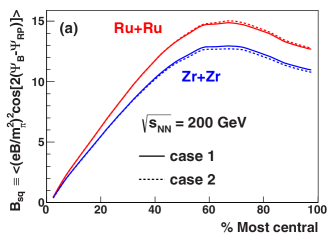
where is the charge radius parameter of the nucleus, represent the surface diffuseness parameter, is the spherical harmonic, and is the normalization factor. The parameter fm is almost identical for and . The charge radii of fm and 5.020 fm were used for and , respectively, for both the proton and neutron densities. The deformity quadrupole parameter has large uncertainties; extreme cases were taken and yielded less than 2% difference in between Ru+Ru and Zr+Zr collisions in the 20-60% centrality range Deng et al. (2016); Huang et al. (2017). The magnetic field strengths in Ru+Ru and Zr+Zr collisions were calculated by using Lienard-Wiechert potentials with the HIJING model taking into account the event-by-event azimuthal fluctuations of the magnetic field orientation Deng and Huang (2012). The quantity relevant to the CME is the average magnetic field squared with correction from the event-by-event azimuthal fluctuation of the magnetic field orientation,
| (22) |
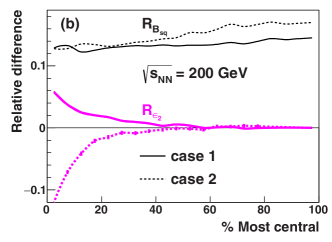
Figure 21(a) shows the calculated at the initial encounter time of the nuclei in Ru+Ru and Zr+Zr collisions at 200 GeV. Figure 21(b) shows the relative difference in ,
| (23) |
The difference is approximately 15%. Figure 21(b) also shows the relative difference in the initial eccentricity,
| (24) |
The relative difference in is practically zero, at most 2% in 20-60% centrality. This suggests that the -induced backgrounds are almost the same for Ru+Ru and Zr+Zr collisions in the 20-60% centrality range.
Based on the available experimental measurements in Au+Au collisions at 200 GeV and the calculated magnetic field and eccentricity differences between Ru+Ru and Zr+Zr collisions, it was estimated that 400 million events each for Ru+Ru and Zr+Zr collisions, assuming 1/3 of the currently measured to be CME signal, would yield a difference between the two systems Deng et al. (2016); Huang et al. (2017). The isobar run, just concluded at RHIC, has accumulated 2 billion events each for Ru+Ru and Zr+Zr collisions in the STAR detector. If the CME signal is 5% of the inclusive measurement, as implied by the latest STAR results Zhao (2018d), then the isobar data would yield a 1-2 effect.
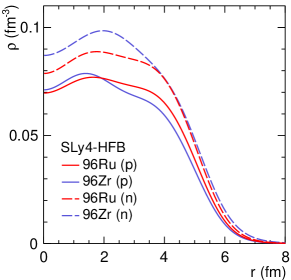
The above estimates assume Woods-Saxon densities, identical for proton and neutron distributions. Using the energy density functional theory (DFT) with the well-known SLy4 mean field Chabanat et al. (1998) including pairing correlations (Hartree-Fock-Bogoliubov, HFB approach) Wang et al. (2016); Bender et al. (2003); Ring and Schuck (1980), the ground-state density distributions of and , assumed spherical, were calculated Xu et al. (2017b). The results are shown in the upper panel of Fig. 22 Xu et al. (2017b). They show that protons in Zr are more concentrated in the core, while protons in Ru, 10% more than in Zr, are pushed more toward outer regions. The neutrons in Zr, four more than in Ru, are more concentrated in the core but also more populated on the nuclear skin. The lower panel of Fig. 22 shows the relative differences in and between Ru+Ru and Zr+Zr collisions as functions of centrality from AMPT simulations with the densities calculated by the DFT method Xu et al. (2017b). Results with respect to both and are depicted. They suggest that the relative difference in and with respect to are as large as 3%, and that in is the expected 20%. With respect to , the differences in and are both on the order of 10%. These results suggest that the premise of isobaric sollisions for the CME search may not be as good as originally anticipated, and could provide important guidance to the experimental isobaric collision program.
No matter what the outcome of the isobaric collision data is, the search for the CME shall continue. More statistics should be accumulated for Au+Au collisions at RHIC and Pb+Pb collisions at the LHC. Future detector upgrades should be considered to improve the sensitivities to the CME. Additional novel analysis techniques should be developed.
V summary
Relativistic heavy-ion collisions provide an ideal environment to study the the chiral magnetic effect (CME) induced by topological charge fluctuations in QCD. Since the first three-point correlator () measurements in 2009, experimental results have been abundant in relativistic heavy-ion as well as small system collisions. Those measurements are contaminated by major physics backgrounds. In this article, experimental efforts in addressing those backgrounds in both heavy-ion and small-system collisions are reviewed, and several novel methods to search for the CME with various background sensitivities are discussed. These include event-by-event elliptic flow (), event-shape engineering, comparative measurements with respect to the participant plane (PP) and reaction plane (RP), and pair invariant-mass () dependence. The current estimates on the strength of the possible CME signal are on the order of a few percent of the inclusive values, consistent with zero with large uncertainties. The prospect of the recently taken isobaric collision data is discussed.
It is clear that the experimental challenges in the CME search are dauting. Major efforts have been devoted to the CME search from both experimental and theoretical sides (the latter is not reviewed here). There is no doubt that the physics of the CME is of paramount importance. The unremitting pursuit for the CME in heavy-ion collisions will not be wasted.
Acknowledgements.
We thank Professor Wei Li for valuable discussions. J.Z. and F.W. thank Professor Zi-Wei Lin, Professor Hanlin Li, and Mr. Yicheng Feng for collaboration. The work of J.Z. and F.W. was supported in part by National Natural Science Foundation of China (Grant No. 11747312) and U.S. Department of Energy (Grant No. de-sc0012910). The work of Z.T. was supported in part by an Early Career Award (Contract No. de-sc0012185) from the U.S. Department of Energy Office of Science, the Robert Welch Foundation (Grant No. C-1845) and an Alfred P. Sloan Research Fellowship (No. FR-2015-65911).References
- Lee (1973) T. D. Lee, Phys. Rev. D8, 1226 (1973).
- Lee and Wick (1974) T. D. Lee and G. C. Wick, Phys. Rev. D9, 2291 (1974).
- Morley and Schmidt (1985) P. D. Morley and I. A. Schmidt, Z. Phys. C26, 627 (1985).
- Kharzeev et al. (1998) D. Kharzeev, R. D. Pisarski, and M. H. G. Tytgat, Phys. Rev. Lett. 81, 512 (1998), arXiv:hep-ph/9804221 [hep-ph] .
- Kharzeev (2006) D. Kharzeev, Phys. Lett. B633, 260 (2006), arXiv:hep-ph/0406125 [hep-ph] .
- Kharzeev et al. (2008) D. E. Kharzeev, L. D. McLerran, and H. J. Warringa, Nucl. Phys. A803, 227 (2008), arXiv:0711.0950 [hep-ph] .
- Fukushima et al. (2008) K. Fukushima, D. E. Kharzeev, and H. J. Warringa, Phys. Rev. D78, 074033 (2008), arXiv:0808.3382 [hep-ph] .
- Kharzeev et al. (2016) D. E. Kharzeev, J. Liao, S. A. Voloshin, and G. Wang, Prog. Part. Nucl. Phys. 88, 1 (2016), arXiv:1511.04050 [hep-ph] .
- Dine and Kusenko (2003) M. Dine and A. Kusenko, Rev. Mod. Phys. 76, 1 (2003).
- Adams et al. (2005) J. Adams et al. (STAR), Nucl. Phys. A757, 102 (2005), arXiv:nucl-ex/0501009 [nucl-ex] .
- Adcox et al. (2005) K. Adcox et al. (PHENIX), Nucl. Phys. A757, 184 (2005), arXiv:nucl-ex/0410003 [nucl-ex] .
- Arsene et al. (2005) I. Arsene et al. (BRAHMS), Nucl. Phys. A757, 1 (2005), arXiv:nucl-ex/0410020 [nucl-ex] .
- Back et al. (2005) B. B. Back et al., Nucl. Phys. A757, 28 (2005), arXiv:nucl-ex/0410022 [nucl-ex] .
- Muller et al. (2012) B. Muller, J. Schukraft, and B. Wyslouch, Ann. Rev. Nucl. Part. Sci. 62, 361 (2012), arXiv:1202.3233 [hep-ex] .
- Muller and Schafer (2010) B. Muller and A. Schafer, Phys. Rev. C82, 057902 (2010), arXiv:1009.1053 [hep-ph] .
- Kharzeev and Pisarski (2000) D. Kharzeev and R. D. Pisarski, Phys. Rev. D61, 111901 (2000), arXiv:hep-ph/9906401 [hep-ph] .
- Reisdorf and Ritter (1997) W. Reisdorf and H. Ritter, Ann.Rev.Nucl.Part.Sci. 47 (1997).
- Voloshin (2004) S. A. Voloshin, Phys. Rev. C70, 057901 (2004), arXiv:hep-ph/0406311 [hep-ph] .
- Pratt et al. (2011) S. Pratt, S. Schlichting, and S. Gavin, Phys.Rev. C84, 024909 (2011), arXiv:1011.6053 [nucl-th] .
- Bzdak et al. (2011) A. Bzdak, V. Koch, and J. Liao, Phys.Rev. C83, 014905 (2011), arXiv:1008.4919 [nucl-th] .
- Abelev et al. (2010) B. I. Abelev et al. (STAR), Phys. Rev. C81, 054908 (2010), arXiv:0909.1717 [nucl-ex] .
- Abelev et al. (2009) B. I. Abelev et al. (STAR), Phys. Rev. Lett. 103, 251601 (2009), arXiv:0909.1739 [nucl-ex] .
- Adamczyk et al. (2013) L. Adamczyk et al. (STAR), Phys. Rev. C88, 064911 (2013), arXiv:1302.3802 [nucl-ex] .
- Adamczyk et al. (2014a) L. Adamczyk et al. (STAR), Phys. Rev. Lett. 113, 052302 (2014a), arXiv:1404.1433 [nucl-ex] .
- Abelev et al. (2013a) B. Abelev et al. (ALICE), Phys. Rev. Lett. 110, 012301 (2013a), arXiv:1207.0900 [nucl-ex] .
- N. N. Ajitanand (2010) R. A. L. N. N. Ajitanand, S. Esumi (PHENIX), Proc. of the RBRC Workshops 96, 230 (2010).
- Wang (2010) F. Wang, Phys. Rev. C81, 064902 (2010), arXiv:0911.1482 [nucl-ex] .
- Zhao (2018a) J. Zhao, Int. J. Mod. Phys. A33, 1830010 (2018a), arXiv:1805.02814 [nucl-ex] .
- Wang and Zhao (2017) F. Wang and J. Zhao, Phys. Rev. C95, 051901 (R) (2017), arXiv:1608.06610 [nucl-th] .
- Schlichting and Pratt (2011) S. Schlichting and S. Pratt, Phys.Rev. C83, 014913 (2011), arXiv:1009.4283 [nucl-th] .
- Zhang et al. (2000) B. Zhang, C. M. Ko, B.-A. Li, and Z.-w. Lin, Phys. Rev. C61, 067901 (2000), arXiv:nucl-th/9907017 [nucl-th] .
- Lin and Ko (2002) Z.-w. Lin and C. M. Ko, Phys. Rev. C65, 034904 (2002), arXiv:nucl-th/0108039 [nucl-th] .
- Lin et al. (2005) Z.-W. Lin, C. M. Ko, B.-A. Li, B. Zhang, and S. Pal, Phys. Rev. C72, 064901 (2005), arXiv:nucl-th/0411110 [nucl-th] .
- Ma and Zhang (2011) G.-L. Ma and B. Zhang, Phys. Lett. B700, 39 (2011), arXiv:1101.1701 [nucl-th] .
- Shou et al. (2014) Q.-Y. Shou, G.-L. Ma, and Y.-G. Ma, Phys. Rev. C90, 047901 (2014), arXiv:1405.2668 [nucl-th] .
- Khachatryan et al. (2017) V. Khachatryan et al. (CMS), Phys. Rev. Lett. 118, 122301 (2017), arXiv:1610.00263 [nucl-ex] .
- Alver et al. (2007) B. Alver et al. (PHOBOS), Phys. Rev. Lett. 98, 242302 (2007), arXiv:nucl-ex/0610037 [nucl-ex] .
- Belmont and Nagle (2017) R. Belmont and J. L. Nagle, Phys. Rev. C96, 024901 (2017), arXiv:1610.07964 [nucl-th] .
- Tu (2017) Z. Tu (CMS), Proceedings, 26th International Conference on Ultra-relativistic Nucleus-Nucleus Collisions (Quark Matter 2017), Chicago, Illinois, USA, February 5-11, 2017, Nucl. Phys. A967, 744 (2017).
- Zhao (2018b) J. Zhao (STAR), Proceedings, 47th International Symposium on Multiparticle Dynamics (ISMD2017), Tlaxcala, Tlaxcala, Mexico, September 11-15, 2017, EPJ Web Conf. 172, 01005 (2018b), arXiv:1712.00394 [hep-ex] .
- Zhao (2018c) J. Zhao (STAR), in Talk, 21st International Conference on Particles and Nuclei (PANIC 17), Beijing, China, September 1-5, 2017 (2018) arXiv:1802.03283 [nucl-ex] .
- Adamczyk et al. (2014b) L. Adamczyk et al. (STAR), Phys. Rev. C89, 044908 (2014b), arXiv:1303.0901 [nucl-ex] .
- Wen et al. (2018) F. Wen, J. Bryon, L. Wen, and G. Wang, Chin. Phys. C42, 014001 (2018), arXiv:1608.03205 [nucl-th] .
- Schukraft et al. (2013) J. Schukraft, A. Timmins, and S. A. Voloshin, Phys. Lett. B719, 394 (2013), arXiv:1208.4563 [nucl-ex] .
- Acharya et al. (2018) S. Acharya et al. (ALICE), Phys. Lett. B777, 151 (2018), arXiv:1709.04723 [nucl-ex] .
- Sirunyan et al. (2018) A. M. Sirunyan et al. (CMS), Phys. Rev. C97, 044912 (2018), arXiv:1708.01602 [nucl-ex] .
- Xu et al. (2017a) H.-j. Xu, J. Zhao, X. Wang, H. Li, Z.-W. Lin, C. Shen, and F. Wang, (2017a), arXiv:1710.07265 [nucl-th] .
- Xu et al. (2017b) H.-J. Xu, X. Wang, H. Li, J. Zhao, Z.-W. Lin, C. Shen, and F. Wang, (2017b), arXiv:1710.03086 [nucl-th] .
- Zhao (2018d) J. Zhao (STAR Collaboration), Talk, 27th International Conference on Ultrarelativistic Nucleus-Nucleus Collisions (Quark Matter 2018), Venezia, Italy, 13-19 May 2018. https:// indico.cern.ch/event/656452/contributions/2869775/, (2018d).
- Zhao et al. (2017) J. Zhao, H. Li, and F. Wang, (2017), arXiv:1705.05410 [nucl-ex] .
- Wang (2018a) F. Wang, Talk, 27th International Conference on Ultrarelativistic Nucleus-Nucleus Collisions (Quark Matter 2018), Venezia, Italy, 13-19 May 2018. https:// indico.cern.ch/event/656452/contributions/2869777/, (2018a).
- Bzdak et al. (2013) A. Bzdak, V. Koch, and J. Liao, Lect. Notes Phys. 871, 503 (2013), arXiv:1207.7327 [nucl-th] .
- Wen (2017) L. Wen (STAR), Proceedings, 26th International Conference on Ultra-relativistic Nucleus-Nucleus Collisions (Quark Matter 2017), Chicago, Illinois, USA, February 5-11, 2017, Nucl. Phys. A967, 756 (2017).
- Ajitanand et al. (2011) N. N. Ajitanand, R. A. Lacey, A. Taranenko, and J. M. Alexander, Phys. Rev. C83, 011901 (2011), arXiv:1009.5624 [nucl-ex] .
- Magdy et al. (2018) N. Magdy, S. Shi, J. Liao, N. Ajitanand, and R. A. Lacey, Phys. Rev. C97, 061901 (2018), arXiv:1710.01717 [physics.data-an] .
- Bozek (2018) P. Bozek, Phys. Rev. C97, 034907 (2018), arXiv:1711.02563 [nucl-th] .
- Feng et al. (2018) Y. Feng, J. Zhao, and F. Wang, (2018), arXiv:1803.02860 [nucl-th] .
- Voloshin (2010) S. A. Voloshin, Phys. Rev. Lett. 105, 172301 (2010), arXiv:1006.1020 [nucl-th] .
- Wang (2013) G. Wang (STAR), Proceedings, 23rd International Conference on Ultrarelativistic Nucleus-Nucleus Collisions : Quark Matter 2012 (QM 2012), Washington, DC, USA, August 13-18, 2012, Nucl. Phys. A904-905, 248c (2013), arXiv:1210.5498 [nucl-ex] .
- Tribedy (2017) P. Tribedy (STAR), Proceedings, 26th International Conference on Ultra-relativistic Nucleus-Nucleus Collisions (Quark Matter 2017), Chicago, Illinois, USA, February 5-11, 2017, Nucl. Phys. A967, 740 (2017), arXiv:1704.03845 [nucl-ex] .
- Tu (2015) B. Tu (STAR Collaboration), Poster, 25th International Conference on Ultrarelativistic Nucleus-Nucleus Collisions (Quark Matter 2015), Kobe, Japan. https:// drupal.star.bnl.gov/STAR/presentations/qm2015/biao-tu, (2015).
- Zhao (2017) J. Zhao (STAR), Proceedings, 46th International Symposium on Multiparticle Dynamics (ISMD 2016), Jeju Island, South Korea, August 29-September 2, 2016, EPJ Web Conf. 141, 01010 (2017).
- Adler et al. (2002) C. Adler et al. (STAR), Phys. Rev. C66, 034904 (2002), arXiv:nucl-ex/0206001 [nucl-ex] .
- Wang (2018b) G. Wang (STAR), Talk, 4th Workshop on Chirality, Vorticity and Magnetic Field in Heavy Ion Collisions, March 19-22, 2018, Florence, Italy. https:// agenda.infn.it/getFile.py/access?contribId=46&resId=0 &materialId=slides&confId=13907, (2018b).
- Bzdak (2012) A. Bzdak, Phys. Rev. C85, 044919 (2012), arXiv:1112.4066 [nucl-th] .
- Hori et al. (2012) Y. Hori, T. Gunji, H. Hamagaki, and S. Schlichting, (2012), arXiv:1208.0603 [nucl-th] .
- Miller et al. (2007) M. L. Miller, K. Reygers, S. J. Sanders, and P. Steinberg, Ann. Rev. Nucl. Part. Sci. 57, 205 (2007), arXiv:nucl-ex/0701025 [nucl-ex] .
- Drescher and Nara (2007) H.-J. Drescher and Y. Nara, Phys. Rev. C76, 041903 (2007), arXiv:0707.0249 [nucl-th] .
- ALbacete and Dumitru (2010) J. L. ALbacete and A. Dumitru, (2010), arXiv:1011.5161 [hep-ph] .
- Niemi et al. (2016) H. Niemi, K. J. Eskola, and R. Paatelainen, Phys. Rev. C93, 024907 (2016), arXiv:1505.02677 [hep-ph] .
- Feldman and Cousins (1998) G. J. Feldman and R. D. Cousins, Phys. Rev. D57, 3873 (1998), arXiv:physics/9711021 [physics.data-an] .
- Xu et al. (2014) H.-j. Xu, L. Pang, and Q. Wang, Phys. Rev. C89, 064902 (2014), arXiv:1404.2663 [hep-ph] .
- Zhu et al. (2017) X. Zhu, Y. Zhou, H. Xu, and H. Song, Phys. Rev. C95, 044902 (2017), arXiv:1608.05305 [nucl-th] .
- Abelev et al. (2013b) B. Abelev et al. (ALICE), Phys. Rev. Lett. 111, 232302 (2013b), arXiv:1306.4145 [nucl-ex] .
- Adamczyk et al. (2017) L. Adamczyk et al. (STAR), Phys. Rev. Lett. 118, 012301 (2017), arXiv:1608.04100 [nucl-ex] .
- Olive et al. (2014) K. A. Olive et al. (Particle Data Group), Chin. Phys. C38, 090001 (2014).
- Adams et al. (2004) J. Adams et al. (STAR), Phys. Rev. Lett. 92, 092301 (2004), arXiv:nucl-ex/0307023 [nucl-ex] .
- Shi et al. (2018) S. Shi, Y. Jiang, E. Lilleskov, and J. Liao, Annals Phys. 394, 50 (2018), arXiv:1711.02496 [nucl-th] .
- Deng et al. (2016) W.-T. Deng, X.-G. Huang, G.-L. Ma, and G. Wang, Phys. Rev. C94, 041901 (2016), arXiv:1607.04697 [nucl-th] .
- Huang et al. (2017) X.-G. Huang, W.-T. Deng, G.-L. Ma, and G. Wang, Proceedings, 26th International Conference on Ultra-relativistic Nucleus-Nucleus Collisions (Quark Matter 2017), Chicago, Illinois, USA, February 5-11, 2017, Nucl. Phys. A967, 736 (2017), arXiv:1704.04382 [nucl-th] .
- Deng and Huang (2012) W.-T. Deng and X.-G. Huang, Phys. Rev. C85, 044907 (2012), arXiv:1201.5108 [nucl-th] .
- Chabanat et al. (1998) E. Chabanat, P. Bonche, P. Haensel, J. Meyer, and R. Schaeffer, Nucl. Phys. A635, 231 (1998), [Erratum: Nucl. Phys.A643,441(1998)].
- Wang et al. (2016) X. B. Wang, J. L. Friar, and A. C. Hayes, Phys. Rev. C94, 034314 (2016), arXiv:1607.02149 [nucl-th] .
- Bender et al. (2003) M. Bender, P.-H. Heenen, and P.-G. Reinhard, Rev. Mod. Phys. 75, 121 (2003).
- Ring and Schuck (1980) P. Ring and P. Schuck, The Nuclear Many-body Problem, Texts and monographs in physics (Springer, 1980).