Constraints on the emitting region of the gamma-rays observed in GW170817
Abstract
The gravitational waves from the neutron star merger event GW170817 were accompanied by an unusually weak short GRB 170817A, by an optical/IR macronova/kilonova and by a long lasting radio to X-rays counterpart. While association of short GRBs with mergers was predicted a long time ago, the luminosity of this prompt -ray emission was weaker by a few orders of magnitude than all known previous sGRBs and it was softer than typical sGRBs. This raise the question whether the -rays that we have seen were a regular sGRB viewed off-axis. We revisit this question following recent refined analyses of the -ray signal and the VLBI observations that revealed the angular structure of the relativistic outflow: observing angle of , a narrow jet with core and ergs. We show here that: (i) The region emitting the observed -rays must have been moving with a Lorentz factor ; (ii) The observed -rays were not “off-axis" emission (viewing angle ) emerging from the core of the jet, where a regular sGRB was most likely produced; (iii) The -ray emission region was either “on-axis" (at an angle ) or if it was “off-axis" then the observing angle must have been small () and the on-axis emission from this region was too faint and too hard to resemble a regular sGRB.
keywords:
—1 INTRODUCTION
One of the puzzling questions concerning the electromagnetic (EM) counterparts of the gravitational waves (GWs) from the binary neutron star merger GW170817 (Abbott et al., 2017a) is the origin of the -rays observed 1.7 s following the merger (Goldstein et al., 2017; Savchenko et al., 2017). Binary neutron star mergers were suggested already 30 years ago as the progenitors of short gamma-ray bursts (sGRBs) (Eichler et al., 1989). Many indirect evidence supporting this suggestion have been found since then (see Nakar 2007 and Berger 2014 and references therein). Therefore the first reaction to the observed -rays was that we observed a regular sGRB (Goldstein et al., 2017).
However, the -ray signal was unlike any sGRB seen before. Most significant was its luminosity. It is fainter by about three orders of magnitude than the faintest sGRB observed so far. In addition both the spectral hardness and the spectral evolution were uncommon (soft peak energy and two distinct spectral components, the second one consistent with being a blackbody). One of advocated solutions was that GW170817 produced an ultra-relativistic jet, which emitted a regular sGRB, as seen by an observer that is within the jet cone, and that we are out of the jet cone seeing the same -rays off-axis (Goldstein et al., 2017; Murguia-Berthier et al., 2017; Ioka & Nakamura, 2018). Namely, the only difference between the -rays that we observed and the emission (presumably a regular sGRB) seen by an “on-axis" observer was the different Lorentz boosts from the source to the observers.
A closer inspection of the -ray signal using compactness arguments and the late (16 and 9 days) onset of the radio and X-ray afterglows (Alexander et al., 2017; Hallinan et al., 2017; Kim et al., 2017; Mooley et al., 2018b; Resmi et al., 2018; Nynka et al., 2018; D’Avanzo et al., 2018; Alexander et al., 2018; Dobie et al., 2018; Corsi et al., 2018; Mooley et al., 2018a; Haggard et al., 2017; Margutti et al., 2017; Troja et al., 2017, 2018; Margutti et al., 2018; Ruan et al., 2018) suggested that this is not the case. Namely, even if GW170817 was associated with a regular sGRB along its rotation axis we did not see these -rays and the origin of the -rays that we observed is different (Kasliwal et al., 2017; Gottlieb et al., 2018b; Gottlieb et al., 2018a; Troja et al., 2017; Granot et al., 2017).
The main suggested explanation for the -rays we have seen was that the outflow contained a component with a lower Lorentz factor and a lower isotropic equivalent energy than that of a typical sGRB jet. This component produced the observed -rays via a different emission mechanism than the one operating in regular GRBs (Kasliwal et al., 2017; Lazzati et al., 2017a; Kathirgamaraju et al., 2018; Gottlieb et al., 2018a; Bromberg et al., 2018; Pozanenko et al., 2018). A natural origin for such an outflow is the cocoon created by the interaction of a relativistic jet with the sub-relativistic merger ejecta, and is expected to produce a relatively wide-angle ( rad) mildly relativistic component (Mészáros & Rees, 2001; Ramirez-Ruiz et al., 2002; Nakar & Piran, 2017; Lazzati et al., 2017b; Gottlieb et al., 2018b). Since a mildly relativistic cocoon can arise from either an emerging or a choked jet (Gottlieb et al., 2018a; Nakar et al., 2018), the -rays could not be used to confidently determine the fate of the jet in GW170817.
Recent VLBI images show a super-luminal motion (Mooley et al., 2018a). When combined with the radio light curve these observations suggest that GW170817 involved a narrow and energetic jet along its rotation axis. This jet has emerged from the merger’s ejecta (hereafter we denote such a jet as a “successful" jet) and most likely produced a powerful sGRB that could have been seen by observers along its narrow opening angle. These observations also enabled us to estimate the system’s geometry, our viewing angle, the parameters of the surrounding matter, and the microphysical parameters of the shocks involved. In addition, Veres et al. (2018) preformed a refined analysis of the Fermi-GBM data obtaining time-resolved spectrum for the initial luminous and hard -ray pulse.
The new results offer an opportunity to improve the constraints on the source of the -ray signal and to compare its properties and angular position with those of the jet’s core. This is the goal of this paper. Before beginning we clarify an important terminology that we use here and elsewhere. We consider an outflow moving with a Lorentz factor . Generally is a function of the angle from the axis. We define an on-axis (off-axis) emission as emission coming to the observer from an angle (), where is the angular distance between the emitting region and the observer.
Following a short summary of the observations in §2, we explore in §3 the compactness limits on the emitting region. We obtain a lower limit on the Lorentz factor of the emitting region that we see off-axis, and an upper limit on its angle with respect to the line-of-sight as a function of the on-axis -ray isotropic equivalent luminosity. In §4, we turn to the observed radio afterglow and determine the maximal isotropic equivalent kinetic energy of the outflow at any given angle with respect to the line-of-sight, so that it will not overproduce the observed radio signal. A comparison of this upper limit with the -ray energy needed to produce the observed prompt emission as an off-axis emission outlines the allowed region for the condition within the prompt emitting region. In §5, we discuss the possibility that the emission that we have seen was observed as a regular sGRB by an on-axis observer, finding that it is highly unlikely. These findings do not mean that the event was not accompanied by a sGRB. However, we did not observe directly any emission from the region that has produced this sGRB. The prompt -rays that we observed were most likely produced by a different mechanism (see e.g. Kasliwal et al., 2017; Gottlieb et al., 2018b; Gottlieb et al., 2018a). We discuss and summarize the implications of these results in §6.
2 The Observations
The -ray detectors on Fermi and INTEGRAL were triggered after the detection of the GWs (Abbott et al., 2017b; Goldstein et al., 2017; Savchenko et al., 2017). The observed -rays showed a first smooth pulse followed by a second softer one. The spectrum of the first pulse is fitted by the Comptonized model (a power-law with exponential cutoff) with a power-law index of and a peak energy of . The latter pulse is fitted by a black body spectrum with a temperature of . Given the distance, the isotropic energy and luminosity are estimated as and , respectively.
Veres et al. (2018) carried out a time-resolved spectral analysis on the first pulse. They find that the peak energy and the luminosity during the first time step are and at a time-bin of . Both decline later. As we show below these observed values impose stronger constraints on the conditions within the emitting region than those obtained earlier based on the average flux and energy (Kasliwal et al., 2017; Granot et al., 2017; Ioka & Nakamura, 2018).
VLBI observations on 75 and 230 days revealed a rather compact nebula whose centroid moves across the plane of the sky at an apparent velocity of , measured in units of the speed of light (Mooley et al., 2018a). When combined with the rapid decay of the radio flux following the peak at d, this result is best explained by a narrow source that moves between days 75 and 230 at at an angle with respect to our line-of-sight. Detailed modeling shows an energetic ( ergs) narrow () jet at the core. The jet must be surrounded by a wider component with a lower energy, that is fully consistent with the cocoon driven by the jet. Our angle with respect to the edge of jet core is and with respect to the jet symmetry axis . Fitting the afterglow data, Mooley et al. (2018a) find that typical microphysical parameters for a jet with isotropic equivalent energy are and (assuming ). A larger jet energy requires a larger external density () and a lower magnetic field ().
3 Prompt emission constraints on the gamma-ray source
As in regular GRBs, compactness constrains the Lorentz factor of the emitting region and its viewing angle (Kasliwal et al., 2017). The optical depth in the rest frame is given by (Nakar, 2007)
| (1) |
where , , , and are the Thomson cross section, total photon number, the fraction of photons which can create pairs, and the size of the emission region, respectively. There are two limits on the minimum Lorentz factor (Lithwick & Sari, 2001). First, a photon with a typical observed energy (or the maximum observed energy) can annihilate a photon whose energy is larger than , where , , and are the Lorentz factor of the outflow, the electron mass, and the speed of light, respectively. For this photon to escape, the optical depth for pair creation should be smaller than unity (limit A). A second requirement is that the photons should not be scattered off by pairs that have been created by photons with (limit B).
For GRB 170817A, limit B imposes the more constraining condition. For the Comptonized photon spectrum of with , the fraction, , is given by111This fraction was approximated by in Kasliwal et al. (2017), which is less accurate than the approximation we use here.
| (2) | |||||
where we consider a normalized distribution so that and we approximate the incomplete gamma function, for . The photon number and the emission size are given by and , where and are the isotropic gamma-ray luminosity and the duration, which is equal to the pulse duration for GRB 170817A. Eq. (1) is rewritten as
| (3) |
Hereafter, we adopt the convention (cgs units). This equation is derived for an on-axis observer.
We consider now an observer located at (all angles are measured relative to the rotation axis of the system) and an off-axis -ray emitting region that is located at an angle such that and . We denote observables for this off-axis observer with a prime. The photon energy is given by
| (4) |
where is the outflow velocity measured in units of the speed of light.
The isotropic energy is transformed in a more complicated way depending on the viewing angle (Kasliwal et al., 2017; Granot et al., 2017; Ioka & Nakamura, 2018):
| (5) |
Cases () [()] is when the observer is near [far] the edge of the emitting region (but off-axis). Both hold until the region expands laterally . Case () is after the lateral expansion. While it is unlikely in the prompt phase it is included for completeness.
The transformation of durations is less trivial and we need to distinguish between the duration of each emission episode, , and that of the entire observed burst, . The transformation of the duration of the emission from a single episode is simply
| (6) |
In our frame we see only a single pulse. This pulse may correspond to a single emission episode, in which case an on-axis observer will also see a single pulse with . However there is another possibility. If each emission episode corresponds to a different part of the outflow (as for example in internal shocks) then the time separating two pulses is the same for on-axis and off-axis observers. Since the time between pulses remains invariant in this scenario, while the duration of each pulse is longer for an off-axis observer by a factor of , a burst seen off-axis may be much less variable than when it is seen on-axis. Thus, a single pulse seen by an off-axis observer, may be seen as many (up to ) different pulses by an on-axis observer. These different possibilities are important when we calculate the transformation of the luminosity in Eq. (3), which corresponds to the luminosity of a single pulse in the frame of an on-axis observer. In one extreme we can assume that there is only a single emission episode and then an on-axis observer sees only a single pulse with a duration that contains all the observed -ray energy. Thus, Eqs. (5) and (6) imply . The other extreme option is that there are identical emission episodes, each with a duration that is similar the separation between two pulses as seen by an on-axis observer. In this case the duration of each pulse is , but it contains only a fraction of of the total -ray energy, implying . To conclude,
| (7) |
where , depending on the (unknown) light curve shape (i.e., variability) seen by an on-axis observer.
Now we can replace the on-axis observables with the off-axis ones in Eq. (3):
| (8) | |||||
Note that here is a function of (or vice versa).
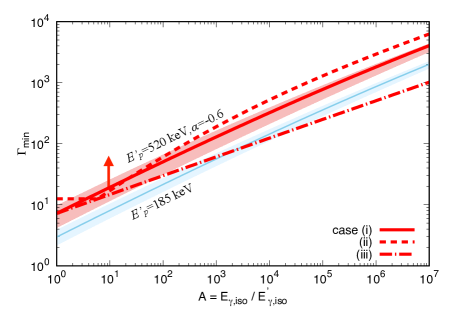
The condition yields a lower limit on the Lorentz factor, . Fig. 1 depicts for cases ()-(), where for case () we have to assume the angular position of the emitting region, . Following Mooley et al. (2018a), we set , as an approximate size of the jet core in GW170817. We take the most conservative assumption and set , which gives weaker lower limits on . We plot for the parameters given by Veres et al. (2018) at the luminosity peak, which are the most constraining (, , , and ). The effect of the uncertainty in the peak energy and luminosity is shown as a shaded region, which is calculated for case (i) using upper and lower boundaries that are given by and , respectively. For a comparison we draw a blue curve and the corresponding shaded region that show the limits for case () as derived by using the average observables (, , , and ). These values give, of course, a less stringent limit.
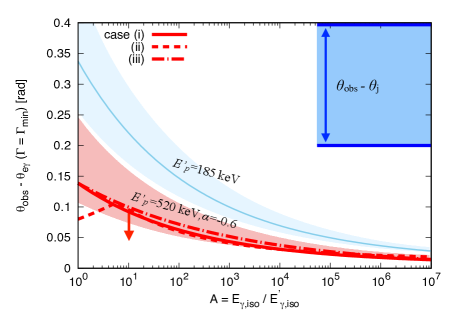
The lower limit on the Lorentz factor yields an upper limit on the angular distance between the observer and the emitting region, (see Eq. 5). Fig. 2 depicts these limits. In all cases, the angular distance is constrained by for , while Mooley et al. (2018a) find rad (similar lower limits on were obtained earlier by examination of the GW signal by Mandel 2018; Finstad et al. 2018). Case (), which requires , is inconsistent with this result, implying that if there are significant off-axis effects (i.e., ) then we must be in case (), namely the emitting region is closer to the observer than it is to the jet axis.
Fig. 2 also shows the properties of the sGRB that was presumably emitted by the core of the jet, based on the constraints set by the VLBI observations ( rad and ergs, which corresponds to ). It is clearly evident that if GW170817 produced sGRB in the direction of the jet core, the -rays that we observed are not this sGRB seen off-axis. In fact, Fig. 2 demonstrates that regardless of the value of the origin of the -rays we observed must be very far from the jet core.
Finally, (and ) corresponds to an on-axis emission (namely ). Therefore plugging into Eq. (8) provides an absolute lower limit on the Lorentz factor of the -ray emitting region. Fig. 1 shows that when considering the uncertainty in (the lower edge of the red shaded region in Fig. 1) that if the -ray emission was seen on-axis then the emitting region Lorentz factor must be .
4 Afterglow Constraints on the Kinetic energy
The observed afterglow puts upper limits on the isotropic equivalent kinetic energy carried by relativistic material at regions with different angular distances from the observer, i.e. . The contribution to the afterglow flux from a given region is brighter when its is larger. Similarly, for a given value of , the emission from a region at a smaller angular distance is brighter and it peaks earlier. Therefore, is limited by the requirement that it does not overproduce the observed afterglow flux. Since the outflow is expected to have both angular and radial structures, for every region this constraint accounts only for material with initial Lorentz factor that is large enough to contribute to the forward shock at the time of the observations. We find in §3 that the Lorentz factor of the -ray emitting region is . At the same time Mooley et al. (2018a) find that the Lorentz factor of the shock driven by the core of the jet into the circum-merger medium is at the time that it starts dominating the emission. Therefore, in the following analysis we constrain the energy carried by material with initial Lorentz factor . This limit is general and it is valid for any given region, regardless of the question whether this region is the source of the -rays or not, and therefore it is important by itself. However, when combined with the limits imposed by compactness it puts tight constraints on the properties of the -ray emitting region.
In order to derive the limit on , where222Note that here is the angle of the region that contributes to the afterglow, not to be confused with defined in §3, which is the region that produces the prompt -rays . , we estimate the maximal flux that this region generates and the time that this flux is observed, as a function of . This can be done relatively well (to within an order of magnitude) since the afterglow observations (Mooley et al., 2018a) provide estimates of the microphysical parameters and (see §2). We separate the constraints for material that is moving directly towards us, namely an on-axis material as defined based on its initial Lorentz factor, and material that is initially off-axis, namely at , where is the initial Lorentz factor of the material at . The former, on-axis limit, is a function of and it constrains only the energy carried by material faster than . The constraints on the initially off-axis material is a function of and it constrains material that moves with an initial . Note that we use the term “initially" since by the time that we see the contribution from each region its Lorentz factor decelerated to the point that and is therefore on-axis at that time (Nakar & Piran, 2018).
We consider three different possible regimes: (i) initially on-axis () (ii) initially near off-axis () and (iii) initially far off-axis (). We compare the emission from each regime to observations. At d, we use 3 GHz observations (Mooley et al., 2018b): . At d, we use X-ray (Troja et al., 2017) and 6 GHz upper limits (Hallinan et al., 2017), assuming that (as predicted by theory) the spectrum is constant during that time, . Before day 2 there are no effective constraints on the afterglow. The estimates for all cases are based on analytic formulae derived in previous studies, where the normalization is adopted from a semi-analytic code described in Soderberg et al. (2006) that takes into account the geometrical factors. Following Mooley et al. (2018a), we use the canonical microphysical parameters: , , and .
4.1 On-axis ()
We approximate the on-axis emission as a top-hat jet with an opening angle and an initial Lorentz factor . The emission from such an outflow peaks at (Sari et al., 1998):
| (9) |
and its 3GHz flux at that time is
| (10) | |||||
A comparison to the observations shows that the isotropic equivalent energy carried by material that moves at towards us is erg. This isotropic equivalent energy is about three orders of magnitude smaller than that of the jet core, but it is still more than enough to allow material that moves towards the observer to emit the observed -rays . Applying this constraint to material with lower values of , we find for example erg.
4.2 Near off-axis ()
We approximate the emission as a top-hat jet with opening angle and an initial Lorentz factor . The afterglow flux peaks at when an observer enters the beaming cone at , before seeing the entire emitting region and before it expands significantly. This case is similar to the previous one (initially on-axis), where is replaced with (and the geometrical normalization factor is smaller by almost an order of magnitude):
| (11) |
and
| (12) | |||||
These estimates imply that for rad and , the flux peaks at after about 3 days. At smaller angles ( rad) the flux peaks earlier and it is brighter, but after about 3 days it is similar to the one observed at . Since there are no observations before day 2, our limit implies that . Above we found a similar limit for material that is initially on-axis with . We therefore conclude that the afterglow observations constraint the isotropic equivalent kinetic energy carried by material with at an angle that is smaller than 0.1 rad away from the line-of-sight to be lower than about .
4.3 Far off-axis ()
Similarly to the near off-axis case we approximate the emission as a top-hat jet with an opening angle and an initial Lorentz factor . The difference is that here, by the time that the blast wave decelerates to the Lorentz factor is smaller than and we can see the entire emitting region. In addition at this point the emitting region has already expanded laterally significantly. This emission is similar to the one expected from a “classical" off axis GRB jet (Granot et al., 2002; Nakar et al., 2002):
| (13) |
and
| (14) | |||||
Note that the pre-factor here is different than the one used in Granot et al. (2002) and Nakar et al. (2002), since it is based on semi-analytic code that takes into account geometrical factors that were ignored in these papers.
5 Combined constraints on the source of GRB 170817A and comparison to sGRBs
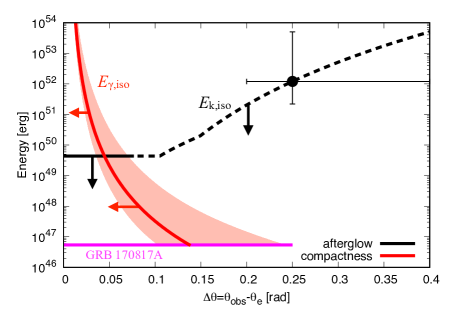
Fig. 3 combines the limits obtained in the previous two sections. The red line shows the compactness limit. The -ray emitting region of GRB 170817A must lie to the left of this line. The black line marks the upper limit on . The isotropic equivalent afterglow kinetic energy must lie below this line. First, the combined constraints333 We use the conservative assumption that , which holds unless the -ray efficiency is extreme even in GRB standards. leave a very narrow allowed region for the source of GRB 170817A. The emitting region cannot be more than away from the line-of-site and the total isotropic equivalent energy carried by the emitting material cannot exceed erg, namely with a reasonable -ray efficiency . The observed gamma-rays must have been emitted either on-axis (i.e., ), or alternatively if there is a significant off-axis suppression then it is rather limited, corresponding to only of the jet core isotropic equivalent energy. Thus, if the core of the jet produced a regular sGRB towards an observer along its beaming cone, the sGRB was brighter by several orders of magnitude than the emission from the region that produced the -rays that we observed, even if the luminosity that we saw was suppressed by off-axis effects.
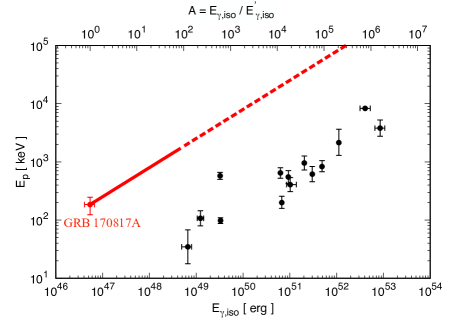
The observed -rays were fainter than the putative sGRB emitted by the jet core. Our results show that even if off-axis effects were important in shaping GRB 170817A then an on-axis observer saw a signal that is at most fainter than the sGRB produced by jet core. Therefore there is no motivation to expect that off-axis effects played a significant role. Yet, it is interesting to ask how did the on-axis emission looked like in that case. Taking the maximal value of results in erg burst, which is weaker than the faintest sGRB seen to date. The variability time scale of its pulses is ms and the average spectrum hardness is MeV. Fig. 4 shows the track that GRB 170817A can take on the plane as a result of off-axis effects. Clearly, there is no point along this track that resembles an sGRB we have seen before. Our conclusion is that the -rays that we observed were most likely emitted by a different emission mechanism than that of a regular GRB.
6 Summary and Discussion
We derived two different constrains on the processes that took place in the neutron star merger event GW170817 and its EM counterparts. First we derived a constraint on the emission region that produced the prompt -rays. We have shown that compactness implies a minimal Lorentz factor ( for “on-axis" source and larger for “off-axis" ones) of the emitting region and a maximal angular distance from us to the source. In particular, this angular separation should have been very small (; see Fig. 2) and it is much smaller than the estimated angular separation between our viewing angle and the core of the jet as found by Mooley et al. (2018a) using the afterglow observations and by Mandel (2018) and Finstad et al. (2018) using the GW signal.
A second independent constraint arises from the radio afterglow. The increase in the radio flux over the first 150 days implies energy injection into the observed region during this period. This can be a result of either a radial structure (more energetic shells move at lower velocity behind the shock front) or due to an angular structure (more energetic regions are located at a larger viewing angles and are observed only once they slow down) (Nakar & Piran, 2018). The observed superluminal motion of the centroid of the radio signal indicates that the dominant energy injection was angular. We set upper limits on the possible kinetic energy of the relativistic () matter as a function of the viewing angle.
The combination of the two constraints limits the possible conditions within the prompt -ray emitting region. The small angular distance between us and the -ray source, compared to the distance to the jet axis, suggests that the gamma-rays were emitted on-axis, and even if they were emitted off-axis then their on-axis luminosity was still very faint and very hard ( erg; MeV) a combination that is unlike other sGRB observed so far.
acknowledgments
This research is supported by the CHE-ISF I-Core center for excellence in Astrophysics. TM is supported by JSPS Overseas Challenge Program for Young Researchers and by Grant-in-Aid for JSPS Research Fellow 17J09895. TP is supported by an advanced ERC grant TReX and by the Templeton foundation.
References
- Abbott et al. (2017a) Abbott B. P., et al., 2017a, Physical Review Letters, 119, 161101
- Abbott et al. (2017b) Abbott B. P., et al., 2017b, ApJ, 848, L13
- Alexander et al. (2017) Alexander K. D., et al., 2017, ApJ, 848, L21
- Alexander et al. (2018) Alexander K. D., et al., 2018, preprint, (arXiv:1805.02870)
- Berger (2014) Berger E., 2014, ARA&A, 52, 43
- Bromberg et al. (2018) Bromberg O., Tchekhovskoy A., Gottlieb O., Nakar E., Piran T., 2018, MNRAS, 475, 2971
- Corsi et al. (2018) Corsi A., et al., 2018, preprint, (arXiv:1806.03136)
- D’Avanzo et al. (2018) D’Avanzo P., et al., 2018, preprint, (arXiv:1801.06164)
- Dobie et al. (2018) Dobie D., et al., 2018, preprint, (arXiv:1803.06853)
- Eichler et al. (1989) Eichler D., Livio M., Piran T., Schramm D. N., 1989, Nature, 340, 126
- Finstad et al. (2018) Finstad D., De S., Brown D. A., Berger E., Biwer C. M., 2018, preprint, (arXiv:1804.04179)
- Goldstein et al. (2017) Goldstein A., et al., 2017, ApJ, 848, L14
- Gottlieb et al. (2018a) Gottlieb O., Nakar E., Piran T., Hotokezaka K., 2018a, MNRAS,
- Gottlieb et al. (2018b) Gottlieb O., Nakar E., Piran T., 2018b, MNRAS, 473, 576
- Granot et al. (2002) Granot J., Panaitescu A., Kumar P., Woosley S. E., 2002, ApJ, 570, L61
- Granot et al. (2017) Granot J., Guetta D., Gill R., 2017, ApJ, 850, L24
- Haggard et al. (2017) Haggard D., Nynka M., Ruan J. J., Kalogera V., Cenko S. B., Evans P., Kennea J. A., 2017, ApJ, 848, L25
- Hallinan et al. (2017) Hallinan G., et al., 2017, Science, 358, 1579
- Ioka & Nakamura (2018) Ioka K., Nakamura T., 2018, Progress of Theoretical and Experimental Physics, 2018, 043E02
- Kasliwal et al. (2017) Kasliwal M. M., et al., 2017, Science, 358, 1559
- Kathirgamaraju et al. (2018) Kathirgamaraju A., Barniol Duran R., Giannios D., 2018, MNRAS, 473, L121
- Kim et al. (2017) Kim S., et al., 2017, ApJ, 850, L21
- Lazzati et al. (2017a) Lazzati D., Perna R., Morsony B. J., López-Cámara D., Cantiello M., Ciolfi R., giacomazzo B., Workman J. C., 2017a, preprint, (arXiv:1712.03237)
- Lazzati et al. (2017b) Lazzati D., López-Cámara D., Cantiello M., Morsony B. J., Perna R., Workman J. C., 2017b, ApJ, 848, L6
- Lithwick & Sari (2001) Lithwick Y., Sari R., 2001, ApJ, 555, 540
- Mandel (2018) Mandel I., 2018, ApJ, 853, L12
- Margutti et al. (2017) Margutti R., et al., 2017, ApJ, 848, L20
- Margutti et al. (2018) Margutti R., et al., 2018, ApJ, 856, L18
- Mészáros & Rees (2001) Mészáros P., Rees M. J., 2001, ApJ, 556, L37
- Mooley et al. (2018a) Mooley K. P., et al., 2018a, preprint, (arXiv:1806.09693)
- Mooley et al. (2018b) Mooley K. P., et al., 2018b, Nature, 554, 207
- Murguia-Berthier et al. (2017) Murguia-Berthier A., et al., 2017, ApJ, 848, L34
- Nakar (2007) Nakar E., 2007, Phys. Rep., 442, 166
- Nakar & Piran (2017) Nakar E., Piran T., 2017, ApJ, 834, 28
- Nakar & Piran (2018) Nakar E., Piran T., 2018, MNRAS, 478, 407
- Nakar et al. (2002) Nakar E., Piran T., Granot J., 2002, ApJ, 579, 699
- Nakar et al. (2018) Nakar E., Gottlieb O., Piran T., Kasliwal M. M., Hallinan G., 2018, preprint, (arXiv:1803.07595)
- Nynka et al. (2018) Nynka M., Ruan J. J., Haggard D., 2018, preprint, (arXiv:1805.04093)
- Pozanenko et al. (2018) Pozanenko A. S., et al., 2018, ApJ, 852, L30
- Ramirez-Ruiz et al. (2002) Ramirez-Ruiz E., Celotti A., Rees M. J., 2002, MNRAS, 337, 1349
- Resmi et al. (2018) Resmi L., et al., 2018, preprint, (arXiv:1803.02768)
- Ruan et al. (2018) Ruan J. J., Nynka M., Haggard D., Kalogera V., Evans P., 2018, ApJ, 853, L4
- Sari et al. (1998) Sari R., Piran T., Narayan R., 1998, ApJ, 497, L17
- Savchenko et al. (2017) Savchenko V., et al., 2017, ApJ, 848, L15
- Soderberg et al. (2006) Soderberg A. M., Nakar E., Berger E., Kulkarni S. R., 2006, ApJ, 638, 930
- Troja et al. (2017) Troja E., et al., 2017, Nature, 551, 71
- Troja et al. (2018) Troja E., et al., 2018, MNRAS,
- Veres et al. (2018) Veres P., et al., 2018, preprint, (arXiv:1802.07328)
- Wang et al. (2017) Wang H., et al., 2017, ApJ, 851, L18