Near-infrared emission lines in starburst galaxies at :
Discovery of a merger sequence of extreme obscurations
Abstract
We obtained optical/near-IR rest-frame Magellan FIRE spectra (including Pa and Pa) of 25 starburst galaxies at , with average star formation rates (SFR) above the Main Sequence (MS). We find that Paschen-to-Balmer line ratios saturate around a constant value corresponding to –3 mag, while line to IR luminosity ratios suggest a large range of more extreme obscurations and appear to be uncorrelated to the former. This behavior is not consistent with standard attenuation laws derived for local and distant galaxies, while being remarkably consistent with observations of starburst cores in which young stars and dust are homogeneously mixed. This model implies –30 mag attenuation to the center of starburst cores, with a median of mag (a factor of ). X-ray hardness ratios for 6 AGNs in our sample and column densities derived from observed dust masses and radio sizes independently confirm this level of attenuation. In these conditions observed optical/near-IR emission comes from surface regions, while inner starburst cores are invisible. We thus attribute the high [NII]/H ratios to widespread shocks from accretion, turbulence and dynamic disturbances rather than to AGNs. The large range of optical depths demonstrates that substantial diversity is present within the starburst population, possibly connected to different merger phases or progenitor properties. The majority of our targets are, in fact, morphologically classified as mergers. We argue that the extreme obscuration provides in itself smoking gun evidence of their merger origin, and a powerful tool for identifying mergers at even higher redshifts.
Subject headings:
galaxies: evolution — galaxies: starburst — galaxies: ISM — galaxies: high-redshift — infrared: galaxiesI. Introduction
Starburst galaxies (SBs) outliers from the MS (e.g., Noeske et al., 2007; Daddi et al., 2007), might be key to understand a long-standing mystery in galaxy formation and evolution: the transition from star forming galaxies to massive, passively evolving ellipticals. According to a popular scenario (e.g., Di Matteo et al., 2005; Hopkins et al., 2010), this transition is attributed to major mergers producing strong bursts of star formation in very dense cores and triggering obscured black hole accretion, which can both remove the gas and dust content in the galaxy.
Local ultra-luminous infrared galaxies (ULIRGs) are showcase examples of merger-induced starbursts, showing compact and heavily obscured cores (e.g., Soifer et al., 2000; Juneau et al., 2009), in agreement with the above scenario. Using standard attenuation recipes in ULIRGs (Cardelli et al., 1989; Calzetti et al., 2000) leads to UV, optical and near-IR based SFRs being systematically underestimated compared to the total infrared luminosities, implying optically thick conditions for these tracers (Goldader et al., 2002; García-Marín et al., 2009; Rieke et al., 2009).
The nature and evolution of SBs galaxies in the distant Universe is debated. While they might still be major merger events, there are also claims that they might be instead very gas rich galaxies (e.g., Scoville et al., 2016), possibly due to exceptionally strong gas accretion events. This is supported by ideas that at higher redshifts, with higher gas fractions, major mergers might only rarely result in strong SFR enhancements (Fensch et al., 2017). Comparisons of both dust-free and dust-affected SFRs are required to study their degree of obscuration, providing clues on the ULIRGs/distant-SB connection. Puglisi et al. (2017) showed that on average Balmer emission lines of Herschel-selected SBs are mainly coming from regions producing of the total SFR, suggesting that rest-optical lines cannot be used to infer the physical properties of the whole starburst system. These results prompted us to use Magellan FIRE to obtain spectroscopy of starbursts in the near-IR rest-frame with the aim of providing enhanced sensitivity and constraining power to study their attenuation properties (hence their nature). In this letter we present first results of this effort. We adopt Chabrier (2003) IMF, AB magnitudes and standard cosmology ( , , ).
II. Sample selection
We select starbursts galaxies for observations with Magellan FIRE in the COSMOS field, with the following criteria:
-
•
spectroscopic redshift z 111We also added four galaxies with photometric redshifts (Laigle et al., 2016) lying in the same range. (from optical surveys, Salvato et al. in preparation), placing Pa within the K band, and H above , thus observable with FIRE222Existing spectroscopic redshift were incorrect for two galaxies, new redshifts placing them outside of our selection range (Fig. fig. 1-right). We keep them in the sample as they satisfy the other selection criteria..
-
•
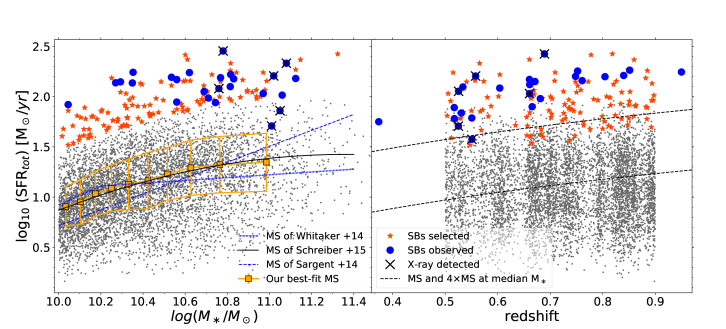
SFR SFR (Rodighiero et al., 2011)333Because of the unavoidable variations of the IR photometry among different catalog versions, while they were being built, two objects appear now slightly below this threshold (Fig. fig. 1-left).. SFRs are derived using the IR catalog from Jin et al. (2018)444Accurate SFR measurements were derived by fitting IRAC to radio cm photometry from Jin et al. (2018) with four components as follows: a Bruzual & Charlot (2003) SED for the stellar component (with age Myr, constant SFH, Z⊙, Chabrier IMF and Calzetti attenuation law), a mid-infrared AGN template from Mullaney et al. (2011) and a warm+cold dust SED from the full Draine & Li (2007) library.. As shown in Fig. fig. 1, the MS for our sample, derived through a running median over bins in M⋆, agrees with the literature (Sargent et al., 2014; Schreiber et al., 2015). Our SFRs are de-contaminated from AGN torus emission ( median contribution to LIR; see Liu et al. (2018) and Jin et al. (2018) for the procedure).
- •
III. Magellan-FIRE observations
FIRE is a single slit near-infrared spectrometer mounted at the Magellan Baade Telescope, covering the wavelength range -. We observed in the cross-dispersed echelle mode, choosing a slit width of to maximize the incoming light from our targets. This configuration provides a spectral resolution R , which helps reducing the effect of OH sky-emission. We refer to Simcoe et al. (2013) for a complete description of the instrument and its performances.
Our observations were performed in two runs during the nights of - March 2017 and - March 2018. We prioritized targets for observations based on two criteria: (1) the presence of a nearby ( from the target) bright (J - mag) star to facilitate acquisition, and (2) maximization of the ratio SFR /D(z), where DL is the luminosity distance. The latter condition select galaxies with intrinsically brightest emission lines, and tend to bias our observed sample towards the most massive objects (Fig. fig. 1). We observed targets during the first run and in the second, for a total of 25 starbursts. Integration times ranged between and minutes, longer for galaxies with lower H S/N (from real-time reductions), to improve detection of fainter lines.
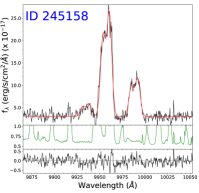
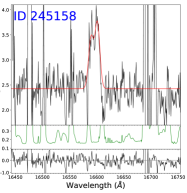
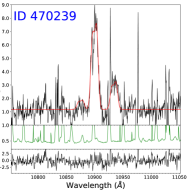
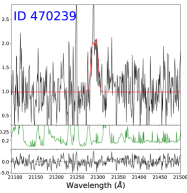
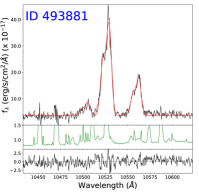
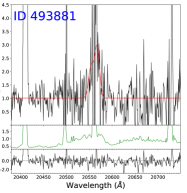
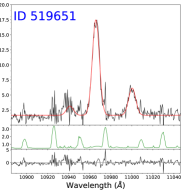
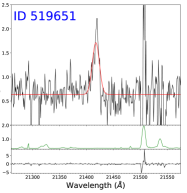
The spectra were reduced using the FIRE pipeline (Gagné et al., 2015). Full details will be given in a forthcoming paper (Calabrò et al. in prep), also presenting science results for the complete range of observed emission lines. In Fig. fig. 3, we show examples of H and Pa (or Pa) for some of the galaxies with good detection (S/N ) of both lines. Double Gaussian components were fitted to line profiles whenever single Gaussian fits could be rejected based on statistics, resulting always in good fits (). We attribute these double Gaussians to either rotation or the presence of physically separated components.
IV. Results
The wide spectral coverage of FIRE and the wealth of photometric data available for our targets makes this a unique sample to investigate attenuation through the use of different indicators as emission lines and the total infrared luminosity. In Fig. fig. 4-left555This plot is equivalent to an IRX- plot (Meurer et al., 1999). we compare the ratio of H and Pa (Paschen-Balmer decrement) to the ratio of SFRs derived from the observed Pa and bolometric IR (A )666For three galaxies in our sample where Pa falls in nearly opaque atmospheric spectral regions or out of FIRE coverage, we use Pa line to infer the attenuation, estimating Pa flux as Pa (Table 1). Indeed, both in a mixed model and foreground dust-screen geometry, the expected observed ratio Pa/Pa ranges between and , for all the attenuation values in our range., where has been derived from the observed Pa luminosity, adopting an intrinsic ratio Pa/H and a standard Kennicutt et al. (1994) calibration, valid for case B recombination and T. We show that for our starbursts, these two ratios, both independent measures of attenuation, do not generally scale as predicted by the Calzetti et al. (2000) and Cardelli et al. (1989) attenuation curves777The Cardelli relation is actually an extinction law.. The value of Pa/H rather saturates at (with a dispersion of dex), qualitatively consistent with an optically thick ’mixed model’, in which different lines probe different optical depths.
As opposed to the foreground dust-screen, a mixed model is made of a uniform extended distribution of young stars and dust inside a volume. In the one-dimensional case, a simple analytic relation can be derived between the observed and intrinsic SFR by integrating along a segment the luminosity contribution from each differential volume element, subject to the extinction of the full optical depth in front of it. This yields:
| (1) |
where L() is the luminosity of a line at a wavelength and is the total absolute attenuation at towards the center defined as A/. In the last expression, and correspond to the local extinction, for which we assumed two extreme cases of a Cardelli et al. (1989) and an SMC (Bouchet et al., 1985) law, yielding an asymptotic Pa/H ratio of and , respectively. Using equation eq. 1888Calzetti et al. (1994) derived a similar equation (n.19) for a mixing geometry, we can predict the observed fluxes at all wavelengths as a function of a single parameter, A. For small values of A this model coincides with the standard attenuation curves adopted. For large A, the local extinction inside the starburst core increases toward the center until the photons are not able to escape anymore from the galaxy, and are fully absorbed by the outer layers of dust. This leads us to depict heavily obscured starbursts as made of a central optically thick core, invisible to us, and a surrounding skin, producing the observed optical and near-IR nebular lines.
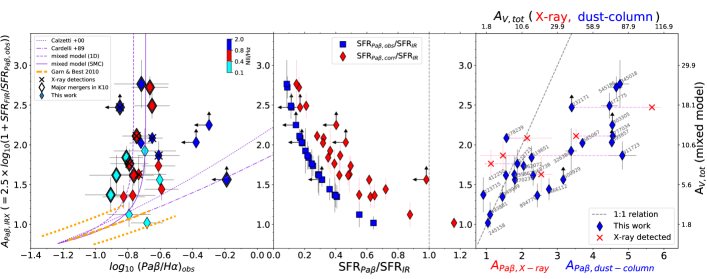
This picture naturally explains both the larger attenuation and SFR fraction that can be recovered by near-IR observations with respect to optical studies (Puglisi et al., 2017), as near-IR wavelengths allow us to penetrate deeper in the system. Because only the less attenuated light from the skin comes out, from Pa we can recover, on average, 30% of the total IR SFR (Fig. fig. 4-middle). However, inside the skin the optical depth becomes quickly large, with median A, corresponding to a suppression of of V-band light from the starburst core centers and up to extreme cases with A (1012 in linear scale). Hence, we cannot directly see the starburst cores in the optical/near-IR.
V. Discussion
Can we conclude that z SBs contain extremely obscured cores that are well described by mixed stars/dust models? It is worth considering alternative explanations. It might be possible that the UV radiation from newly born massive stars is absorbed by dust within HII regions, before reaching to ionize HI outside. While strong stellar winds push the dust away to form a screen (Calzetti et al., 2000), a substantial amount of absorbing dust may still be trapped in the ongoing SF site (Caplan & Deharveng, 1986; Bell & Kennicutt, 2001) particularly in these very dust rich galaxies. This would simulate the existence of an optically thick SB core, just reducing the fraction of photons seen by HI. This could still represent a mixed model scenario, with mixing occurring at smaller scales. Whether this is a viable option depends on geometry and is difficult to model in detail.
Alternatively, the discrepant SFRs (coming from the lines and IR bolometric luminosity) may be due to time-variation effects, as L probes longer SFR timescales than emission lines, due to the energy contribution of longer-lived B-type stars to ionizing O stars. In our case, this would require that most SBs have recently experienced a severe SFR truncation, which seems unlikely. Instantaneous and dust-free SFR tracers, like e.g., through CO[5-4] lines (Daddi et al., 2015), would shed light and help addressing definitely this possibility.
Due to the optically thick cores, the mixed model also implies that it might not be possible to detect AGNs from optical and near-IR observations, if located in the coalescing center. Interestingly, Fig. fig. 4 shows that our SB galaxies often display high N2 ([N II]/H) indexes, which might suggest highly ionizing, AGN-dominated emission. We also see a correlation, significant at % confidence level (Spearman correlation coefficient ), between N2 and A999This incidentally suggests that the four galaxies with Pa upper limits are also very highly obscured, having relatively high N2.. We argue that instead, in the majority of our targets with enhanced [N II]/H (and relatively higher obscurations), the line emission may be driven by shocks, which were already shown to contribute up to in local ULIRGs in latest merger stages (Rich et al., 2015). In case of shock contribution, the attenuations that we have inferred through APaβ,IRX would represent lower limits, but the line ratios will not be affected as Case B recombination regime still holds.
Nevertheless, it would be crucial to obtain independent estimates of actual attenuations towards the cores. One possibility is provided by AGNs. We searched for evidence of AGNs among our SBs using multiple dust-free multi-wavelength tracers in the radio and X-rays. While none of our SBs show significant radio excess, either following the criteria of Del Moro et al. (2013) and the less stringent requirements of Liu et al. (2018) (all assuming an IR-radio correlation), six galaxies (ID , , , , , and ) are detected by XMM-Newton, Chandra or NuStar (Cappelluti et al., 2009; Marchesi et al., 2016; Civano et al., 2015) with luminosities much higher than what expected from their SFRs (Ranalli et al., 2004). The same objects are also the only ones in which we detect a mid-IR dusty torus component through SED fitting (only tentative for SB ). Their X-ray hardness ratios were converted in obscuring column densities (NH) by Lanzuisi et al. (2017; see Fig.19 in La Massa et al 2016 for the method), which are NH upper limits for gas/dust obscurations to the cores (part of the obscuration would happen within the torus itself). The relation of Güver & Özel (2009) allows to convert NH into a total AV and (NH(cm−2) = AV(mag)). This returns generally very high X-ray obscurations for the AGNs (Fig. fig. 4-right), supporting the presence of high obscuration in their center, as required by the mixed model.
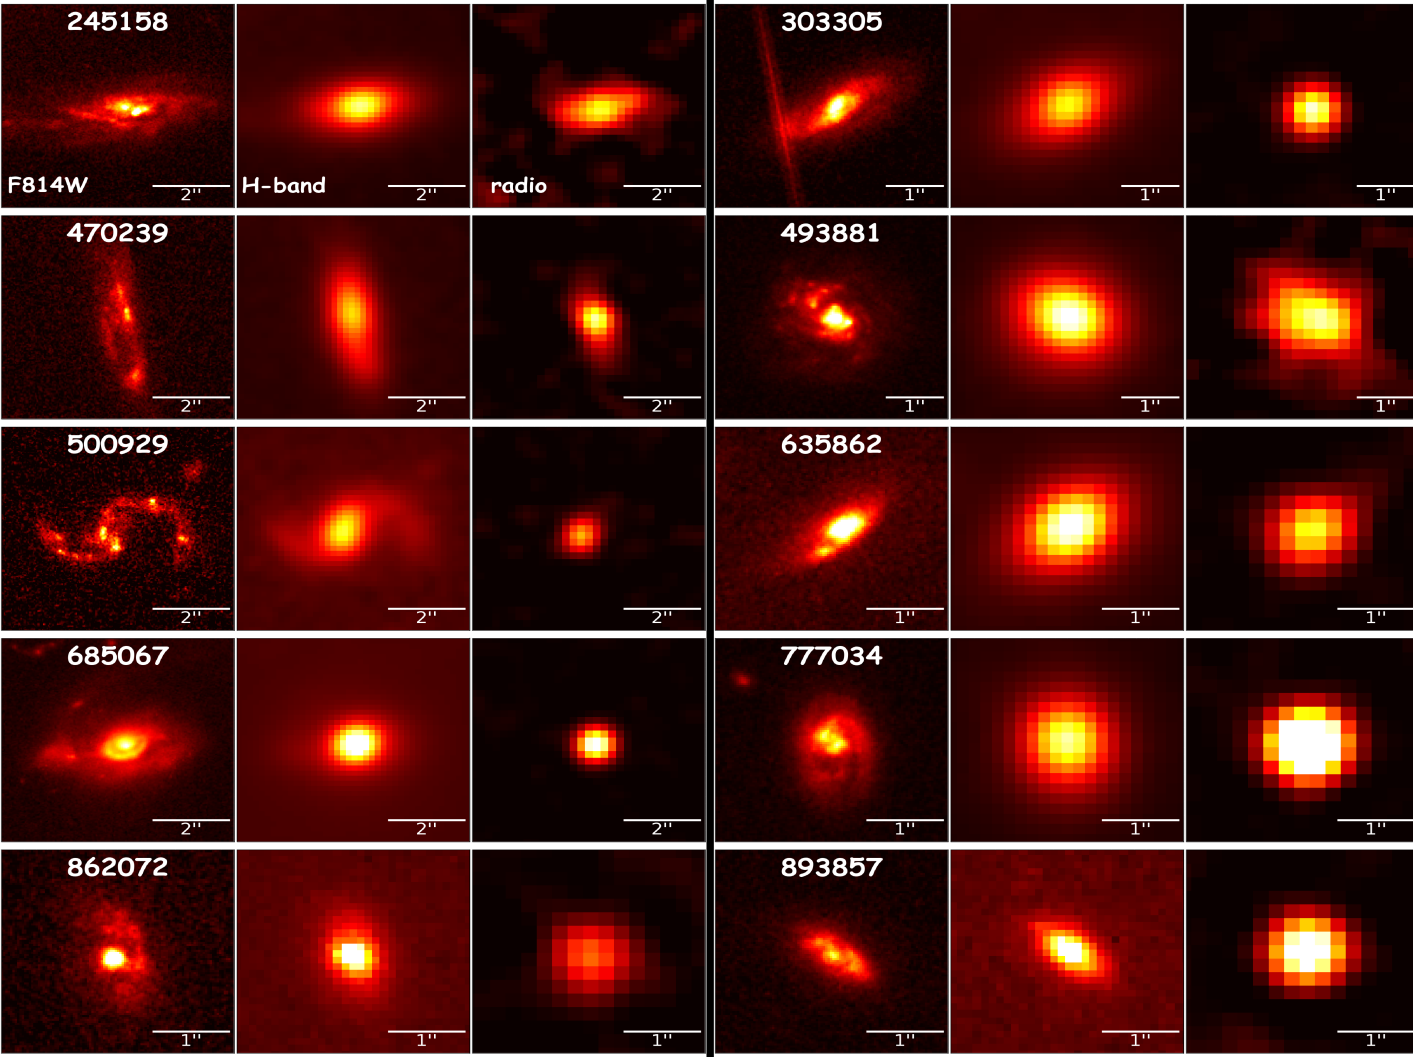
As a further check, we computed the column density of gas in the starbursts cores using the total molecular mass M, inferred as M log(SFR) (Sargent et al., 2014, , assuming conservatively the starburst case) and the radio size, measured with GALFIT by fitting a gaussian profile (convolved with the PSF) to their VLA (3 GHz) images (Fig. fig. 2). From Fig. fig. 4-right we can see that for half of our sample, at relatively low-moderate obscurations within the probed range, the attenuation inferred from this method is consistent with the mixed model. On the other hand, towards the highest obscurations, this approach suggests even larger attenuations. Some fraction of the emission line fluxes might come from foreground regions unrelated to the starbursting cores, presumably residual material from the merging galaxies. Accounting for this extra, modestly attenuated component would result in substantial increase of the A of the starburst core, providing better agreement with these column densities estimates. A proper correction for this effect would require IFU observations, that could also clarify whether our objects are similar to local ULIRGs, for which higher values of nuclear attenuations (A- mag) are reported in several studies (e.g., Scoville et al., 1998; Genzel et al., 1998). All in all, it appears that very heavily embedded cores are indeed present in these galaxies.
What is the origin of these extremely obscured cores? Unsurprisingly (Fig. 2), morphological classification was independently derived for starbursts in our sample (Kartaltepe et al., 2010, see Tab. 1), and over 83% of them were identified as mergers: as major mergers (), showing distorted or double nuclei, tidal tales, bridges or overlapping disks, and (22%) as minor mergers, characterized by at least slightly disturbed morphology (e.g., warped disks, asymmetric spiral arms, small companion at same z, etc). Visual inspection for the remaining sources suggest that merger origin is at least plausible for the vast majority of our sample. Mergers are, in fact, more commonly identified among less obscured systems (Tab. 1), which is understandable given that in the later coalescence phases any remaining merger signature becomes subtle (see, e.g., two of the three morphologically non-merger objects in our sample classified as Ellipticals/S0 by Kartaltepe et al. (2010), and the three of them have A). It is thus tempting to attribute the large range of observed properties apparently defining a sequence of obscurations as reflecting different merger phases, to varying progenitor properties (including, e.g., the gas fraction of merging galaxies and the impact geometry), or a combination of them. Nevertheless, we cannot definitely exclude with our data that the sequence may be also reflecting the amount of foreground contamination, thus unrelated to the real obscuration of the core.
Our work suggests that deeply embedded merger events still largely dominate among sample of SBs galaxies at least to , which corresponds to 6.3 Gyr lookback time, an epoch with galaxy specific SFRs larger than local on average. At even higher redshifts, it becomes much harder to identify mergers from their morphological signatures due to surface brightness dimming and widespread presence of clumpy/irregular galaxies. We argue instead that higher-z mergers might be even more efficiently identified searching for evidences of extreme levels of obscurations, given our results and also consistently with simulations (e.g. Di Matteo et al., 2005), representing a clear footprint of their origin. In fact, we are not aware of any viable alternative mechanism that could produce galaxy-wide obscurations of 10+ mag in the V-band: normal disk-like galaxies display much lower obscurations (orange lines in Fig.4-left). Near-IR rest-frame spectra of galaxies will be easily accessible soon with JWST up to z and down to much fainter levels, and will allow testing and applying this idea.
| ID | RA | DEC | z | log(M∗) | log(LIR) | H | Pa | A | N | Mtype |
|---|---|---|---|---|---|---|---|---|---|---|
| (deg) | (deg) | (M⊙) | (L⊙) | () | () | (mag) | (cm-2) | |||
| 245158 | 150.18854 | 1.65498 | 0.5172 | 10.7 | 11.89 0.07 | 249.6 30.1 | 52.0 5.6‡ | 1.9 0.1 | - | S,m |
| 493881 | 150.74967 | 2.04707 | 0.6039 | 10.8 | 12.09 0.06 | 330.9 30.2 | 53.3 11.5 | 2.7 0.2 | - | - |
| 223715 | 149.76537 | 1.61702 | 0.5174 | 10.7 | 11.78 0.03 | 204.0 20.8 | 28.5 6.6 | 3.6 0.2 | - | m,S |
| 249989 | 150.68540 | 1.66108 | 0.6656 | 10.6 | 11.90 0.08 | 127.6 15.9 | 19.0 3.3 | 4.4 0.2 | - | MIII |
| 894779 | 150.42710 | 2.65644 | 0.5506 | 10.0 | 11.79 0.03 | 129.7 19.3 | 22.0 3.8 | 4.5 0.2 | - | MIV |
| 466112 | 149.99928 | 2.00599 | 0.7607 | 10.3 | 12.16 0.04 | 81.7 6.2 | 20.9 3.5 | 5.2 0.3 | - | MIII |
| 470239 | 150.48155 | 2.01096 | 0.6609 | 10.6 | 12.12 0.17 | 92.3 9.5 | 23.0 2.2 | 6.2 0.2 | - | - |
| 500929 | 149.76844 | 2.05935 | 0.9498 | 10.8 | 12.25 0.14 | 21.9 5.3 | 14.3‡ | 6.2 | - | MIII |
| 412250 | 150.74171 | 1.91764 | 0.8397 | 10.3 | 12.21 0.04 | 118.6 10.5 | 16.0 4.7 | 6.7 0.6 | - | MIII |
| 668738 | 150.21020 | 2.31168 | 0.7481 | 10.8 | 12.20 0.04 | 81.4 7.5 | 14.1 1.4 | 6.7 0.2 | - | MIII |
| 635862 | 149.69589 | 2.26450 | 0.5508 | 11.0 | 11.58 0.10 | 59.7 8.8 | 11.0 2.7 | 6.8 0.6 | 22.54 0.14 | - |
| 862072 | 150.12329 | 2.60376 | 0.6811 | 11.1 | 11.98 0.07 | 58.3 6.0 | 14.3 1.9 | 7.8 0.4 | - | m,S |
| 222723 | 150.17321 | 1.61632 | 0.5254 | 11.0 | 12.05 0.05 | 150.7 11.1 | 24.4 4.8 | 8.1 0.5 | 21.66 | MV |
| 519651 | 150.43020 | 2.08688 | 0.6709 | 10.5 | 12.15 0.05 | 126.0 10.5 | 19.5 3.0 | 8.8 0.5 | - | MIV |
| 911723 | 149.68134 | 2.68108 | 0.6606 | 10.8 | 12.03 0.02 | 65.9 7.2 | 16.2 3.1 | 9.1 0.6 | 21.98 0.36 | E |
| 326384 | 149.51786 | 1.78357 | 0.8042 | 10.3 | 12.20 0.07 | 68.8 8.8 | 12.4 3.8 | 9.8 1.1 | - | S |
| 685067 | 149.74730 | 2.34574 | 0.3735 | 11.0 | 11.75 0.01 | 136.9 16.5 | 26.1 1.2 | 10.9 0.3 | - | - |
| 893857 | 150.15995 | 2.65434 | 0.8512 | 11.1 | 12.26 0.09 | 27.4 1.6 | 11.5‡ | 11 | - | E |
| 578239 | 150.76543 | 2.18099 | 0.5578 | 11.1 | 12.21 0.23 | 116.5 10.4 | 26.1 1.6 | 11.7 0.3 | 22.36 0.31 | - |
| 777034 | 150.15025 | 2.47517 | 0.6889 | 10.8 | 12.43 0.08 | 114.0 13.3 | 20.5 1.8 | 12.0 0.4 | 22.96 0.04 | MIV |
| 303305 | 150.48305 | 1.74796 | 0.5306 | 10.7 | 11.84 0.10 | 19.9 3.6 | 10.0‡ | 13.9 | - | - |
| 232171 | 150.06033 | 1.63269 | 0.5251 | 11.1 | 11.71 0.02 | 60.1 14.2 | 8.5 | 17.6 | 23.83 0.1 | MII |
| 472775 | 150.48148 | 2.01362 | 0.6604 | 10.8 | 12.17 0.06 | 44.3 4.1 | 9.9 1.6 | 18.0 1.3 | - | - |
| 545185 | 149.52802 | 2.12725 | 0.5337 | 10.4 | 12.10 0.06 | 49.8 4.2 | 10.9 0.9 | 22.5 1.0 | - | MIII |
| 345018 | 149.72556 | 1.81069 | 0.7521 | 10.6 | 12.25 0.06 | 37.0 3.6 | 7.1 2.1 | 23.7 3.4 | - | m,S |
-
Note. ID, RA, DEC (J2000) and M∗ are from Laigle et al. (2016). The - error on M∗ is dex. Line fluxes are measured from aperture corrected spectra. Aperture correction errors ( dex) are included in the uncertainties. The infrared luminosities (integrated between - ), are AGN-torus decontaminated. H and Pa are corrected for stellar absorption, assuming EW and Å, respectively.The morphological type (Mtype) of Kartaltepe et al. (2010): E=Elliptical/S0; S=spiral/disc; m=Minor merger; M=Major merger (I:first approach, II:first contact, III:pre-merger, IV:Merger, V:Old merger/merger remnant). The galaxies are ordered with increasing A. ‡: derived as Pa Pa
References
- Bell & Kennicutt (2001) Bell, E. F., & Kennicutt, R. C., Jr. 2001, ApJ, 548, 681
- Bouchet et al. (1985) Bouchet, P., Lequeux, J., Maurice, E., Prevot, L., & Prevot-Burnichon, M. L. 1985, A&A, 149, 330
- Bruzual & Charlot (2003) Bruzual, G., & Charlot, S. 2003, MNRAS, 344, 1000
- Calzetti et al. (2000) Calzetti, D., Armus, L., Bohlin, R. C., et al. 2000, ApJ, 533, 682
- Calzetti et al. (1994) Calzetti, D., Kinney, A. L., & Storchi-Bergmann, T. 1994, ApJ, 429, 582
- Caplan & Deharveng (1986) Caplan, J., & Deharveng, L. 1986, A&A, 155, 297
- Cappelluti et al. (2009) Cappelluti, N., Brusa, M., Hasinger, G., et al. 2009, A&A, 497, 635
- Cardelli et al. (1989) Cardelli, J. A., Clayton, G. C., & Mathis, J. S. 1989, ApJ, 345, 245
- Chabrier (2003) Chabrier, G. 2003, PASP, 115, 763
- Civano et al. (2015) Civano, F., Hickox, R. C., Puccetti, S., et al. 2015, ApJ, 808, 185
- Daddi et al. (2007) Daddi, E., Dickinson, M., Morrison, G., et al. 2007, ApJ, 670, 156
- Daddi et al. (2015) Daddi, E., Dannerbauer, H., Liu, D., et al. 2015, A&A, 577, A46
- Del Moro et al. (2013) Del Moro, A., Alexander, D. M., Mullaney, J. R., et al. 2013, A&A, 549, A59
- Di Matteo et al. (2005) Di Matteo, T., Springel, V., & Hernquist, L. 2005, Nature, 433, 604
- Draine & Li (2007) Draine, B. T., & Li, A. 2007, ApJ, 657, 810
- Fensch et al. (2017) Fensch, J., Renaud, F., Bournaud, F., et al. 2017, MNRAS, 465, 1934
- Güver & Özel (2009) Güver, T., & Özel, F. 2009, MNRAS, 400, 2050
- Gagné et al. (2015) Jonathan Gagné, Erini Lambrides, Jacqueline K. Faherty, Robert Simcoe. FireHose_v2: Firehose v Zenodo
- García-Marín et al. (2009) García-Marín, M., Colina, L., & Arribas, S. 2009, A&A, 505, 1017
- Garn & Best (2010) Garn, T., & Best, P. N. 2010, MNRAS, 409, 421
- Genzel et al. (1998) Genzel, R., Lutz, D., Sturm, E., et al. 1998, ApJ, 498, 579
- Goldader et al. (2002) Goldader, J. D., Meurer, G., Heckman, T. M., et al. 2002, ApJ, 568, 651
- Hopkins et al. (2010) Hopkins, P. F., Bundy, K., Croton, D., et al. 2010, ApJ, 715, 202
- Jin et al. (2018) Jin, S., Daddi, E., et al. 2018, submitted to ApJ
- Juneau et al. (2009) Juneau, S., Narayanan, D. T., Moustakas, J., et al. 2009, ApJ, 707, 1217
- Kartaltepe et al. (2010) Kartaltepe, J. S., Sanders, D. B., Le Floc’h, E., et al. 2010, ApJ, 721, 98
- Kennicutt et al. (1994) Kennicutt, R. C., Jr., Tamblyn, P., & Congdon, C. E. 1994, ApJ, 435, 22
- Laigle et al. (2016) Laigle, C., McCracken, H. J., Ilbert, O., et al. 2016, ApJS, 224, 24
- LaMassa et al. (2016) LaMassa, S. M., Civano, F., Brusa, M., et al. 2016, ApJ, 818, 88
- Lanzuisi et al. (2017) Lanzuisi, G., Delvecchio, I., Berta, S., et al. 2017, A&A, 602, A123
- Liu et al. (2018) Liu, D., Daddi, E., Dickinson, M., et al. 2018, ApJ, 853, 172
- Marchesi et al. (2016) Marchesi, S., Lanzuisi, G., Civano, F., et al. 2016, ApJ, 830, 100
- Markwardt (2009) Markwardt, C. B. 2009, Astronomical Data Analysis Software and Systems XVIII, 411, 251
- Meurer et al. (1999) Meurer G. R., Heckman T. M., Calzetti D., 1999, ApJ, 521, 64
- Momcheva et al. (2016) Momcheva, I. G., Brammer, G. B., van Dokkum, P. G., et al. 2016, ApJS, 225, 27
- Mullaney et al. (2011) Mullaney, J. R., Alexander, D. M., Goulding, A. D., & Hickox, R. C. 2011, MNRAS, 414, 1082
- Noeske et al. (2007) Noeske, K. G., Weiner, B. J., Faber, S. M., et al. 2007, ApJ, 660, L43
- Puglisi et al. (2017) Puglisi, A., Daddi, E., Renzini, A., et al. 2017, ApJ, 838, L18
- Ranalli et al. (2004) Ranalli, P., Comastri, A., & Setti, G. 2004, Multiwavelength AGN Surveys, 43
- Rich et al. (2015) Rich, J. A., Kewley, L. J., & Dopita, M. A. 2015, ApJS, 221, 28
- Rieke et al. (2009) Rieke, G. H., Alonso-Herrero, A., Weiner, B. J., et al. 2009, ApJ, 692, 556
- Rodighiero et al. (2011) Rodighiero, G., Daddi, E., Baronchelli, I., et al. 2011, ApJ, 739, L40
- Sargent et al. (2012) Sargent, M. T., Béthermin, M., Daddi, E., & Elbaz, D. 2012, ApJ, 747, L31
- Sargent et al. (2014) Sargent, M. T., Daddi, E., Béthermin, M., et al. 2014, ApJ, 793, 19
- Schreiber et al. (2015) Schreiber, C., Pannella, M., Elbaz, D., et al. 2015, A&A, 575, A74
- Scoville et al. (1998) Scoville, N. Z., Evans, A. S., Dinshaw, N., et al. 1998, ApJ, 492, L107
- Scoville et al. (2016) Scoville, N., Sheth, K., Aussel, H., et al. 2016, ApJ, 820, 83
- Simcoe et al. (2013) Simcoe, R. A., Burgasser, A. J., Schechter, P. L., et al. 2013, PASP, 125, 270
- Smolčić et al. (2017) Smolčić, V., Novak, M., Bondi, M., et al. 2017, A&A, 602, A1
- Soifer et al. (2000) Soifer, B. T., Neugebauer, G., Matthews, K., et al. 2000, AJ, 119, 509