Prevalence of neutral gas in centres of merging galaxies
Abstract
We present Giant Metrewave Radio Telescope and Very Large Array observations of H i 21-cm absorption in ten 0.2 galaxy mergers that host strong radio sources. Seven of these mergers show strong absorption [with (H i) cm-2, for spin temperature of 100 K and unit covering factor], leading to a total detection rate of % in low- radio-loud galaxy mergers. This is times higher than that found for intrinsic H i 21-cm absorption in low- radio sources in general. The fraction of intrinsic absorbers that are associated with mergers increases with increasing (H i) threshold, i.e. 40% and 100% of the absorbers with (H i) cm-2 and cm-2 arise from mergers, respectively. The distribution of (H i) among the mergers is significantly different from that found in isolated systems, with mergers giving rise to six times stronger absorption on average. The fraction of redshifted absorption components (with respect to the systemic velocity of the radio source obtained from optical emission lines) among mergers is found to be higher by two to three times compared to that found for non-interacting systems. Follow-up spatially-resolved multi-wavelength spectroscopy is essential to understand the exact connection between the presence of circumnuclear neutral gas and the AGN activity in these mergers.
keywords:
galaxies: interactions quasars: absorption lines.1 Introduction
According to the hierarchical model of structure formation, galaxies evolve through interactions and mergers (White & Rees, 1978; Hopkins et al., 2006). Galaxy interactions and mergers have significant effects on the star formation, morphology, kinematics and physical conditions of gas, both in the core and outskirts of galaxies (e.g. Toomre & Toomre, 1972; Barnes & Hernquist, 1996; Mihos & Hernquist, 1996; Cox et al., 2004, 2008; Soto & Martin, 2012; Moreno et al., 2015; Hani et al., 2018). Major galaxy mergers can funnel large quantities of gas to the central regions of galaxies, triggering intense bursts of star formation and fueling Active Galactic Nuclei (AGNs) (Springel et al., 2005; Hopkins et al., 2008). Feedback from the AGNs, in the form of ejection or heating of the gas, can in turn regulate or quench star formation in the galaxies. This negative AGN feedback is usually a necessary ingredient in semi-analytical and numerical simulations to reproduce the observed galaxy properties (e.g. Croton et al., 2006; Schawinski et al., 2006; Samui et al., 2007). AGN outflows or jets can also provide positive feedback by compressing gas clouds to high densities as they propagate through the interstellar medium and triggering star formation (e.g. Chambers et al., 1987; Gaibler et al., 2012; Maiolino et al., 2017). Further, AGN feedback can connect the properties of the central supermassive black hole (SMBH) to that of its host galaxy, and therefore, explain the observed correlation between the SMBH mass and galaxy mass or velocity dispersion (Ferrarese & Merritt, 2000; Gebhardt et al., 2000).
While the above studies have shown that the AGN feedback, both positive and negative, has a strong impact on the evolution of its host galaxy and the environment, what is yet to be well understood is the mechanism that triggers the AGN activity. Major mergers, secular evolution, and hot halo accretion are among the processes believed to be responsible for triggering the AGN activity (see Alexander & Hickox, 2012, and references therein). While mergers may not be the sole or dominant trigger of AGN activity, with major mergers thought to trigger only the most luminous AGNs (Treister et al., 2012), their role in this process is still important to investigate. The connection between galaxy mergers and AGN activity remains debatable, with some studies having found evidence for such a connection for both radio-loud and radio-quiet AGNs (e.g. Combes et al., 2009; Ellison et al., 2011; Ramos Almeida et al., 2012; Tadhunter et al., 2012; Villar-Martín et al., 2012; Khabiboulline et al., 2014; Satyapal et al., 2014; Weston et al., 2017), and some studies having found no such evidence at different redshifts (e.g. Schmitt, 2001; Cisternas et al., 2011; Scott & Kaviraj, 2014; Villforth et al., 2014). It has been proposed that one of the reasons for studies at shorter wavelengths (optical) not finding a connection between mergers and AGNs, contrary to studies at higher wavelengths (infrared), could be the strong dust obscuration in the central regions of some mergers (Satyapal et al., 2017; Weston et al., 2017). There is evidence that the AGN can be fueled by infall of cold gas clouds (Morganti et al., 2009; Fathi et al., 2013; Tremblay et al., 2016; Maccagni et al., 2018). Therefore, it is of great importance to study the properties of gas in the circumnuclear discs and tori in AGN hosts associated with galaxy mergers, in order to test the connection between AGN activity and galaxy mergers.
In the case of radio-loud AGNs, the circumnuclear atomic gas can be probed using H i 21-cm absorption. There have been several searches of associated H i 21-cm absorption in samples of radio-loud AGNs (e.g. van Gorkom et al., 1989; Carilli et al., 1998b; Peck et al., 2000; Morganti et al., 2001; Vermeulen et al., 2003; Gupta et al., 2006; Chandola et al., 2011; Allison et al., 2012; Chandola et al., 2013; Geréb et al., 2015; Aditya et al., 2016; Maccagni et al., 2017). Interestingly, at low redshifts, where it is possible to identify mergers by visual inspection, radio galaxies with very strong intrinsic absorption are usually observed to be undergoing major mergers. This suggests that mergers can trigger inflow of large volumes of neutral gas to the central regions of galaxies. For example, based on the high concentration of H i gas in the circumnuclear region of a radio source undergoing merger and signature of infalling cold gas found in sub-arcsecond-scale spectroscopy, Srianand et al. (2015) have conjectured that the radio source may have been triggered by the gas infall due to the ongoing merger. However, the H i 21-cm absorption from mergers are reported in the literature either as individual detections or as part of samples where good quality optical imaging and spectroscopic data are not available. Therefore, it is not possible to draw any general conclusions about the relationship between mergers and AGN activity based on these observations.
As a first step to address the above issue, we have undertaken a pilot project to search for H i 21-cm absorption in radio sources at that are associated with mergers. The broad objective is to shed light on the merger-AGN connection through neutral gas absorption. Our immediate objectives are to ascertain what fraction of merging galaxies associated with strong radio sources are detected in H i 21-cm absorption, check for the association of mergers and very strong absorption with high (H i) values of cm-2, and estimate what fraction of merging galaxies have inflowing/outflowing H i gas. Consequently, using detailed analysis of multi-wavelength observations, we propose to understand the origin of the absorbing gas detected in the circumnuclear regions of mergers, and hence investigate the AGN feeding and feedback processes ongoing in these mergers.
This paper is arranged as follows. We describe our sample, observations and data reduction in Section 2. We present the results from our search for neutral gas absorption in mergers and discuss individual systems from our sample in Section 3. We discuss the results by combining our sample with studies in the literature in Section 4. Finally, we summarize our results in Section 5. Throughout this paper, we adopt a flat -cold dark matter cosmology with = 70 km s-1 Mpc-1 and = 0.30. Note that we use ‘absorption/absorber’ to refer to H i 21-cm absorption/absorber from hereon unless otherwise mentioned.
2 Sample & Observations
2.1 Sample
We compiled the merger sample using the Sloan Digital Sky Survey (SDSS; York et al., 2000), the Faint Images of the Radio Sky at Twenty-Centimeters (FIRST; White et al., 1997), the NRAO VLA Sky Survey (NVSS; Condon et al., 1998), and the NASA/IPAC Extragalactic Database (NED). We searched for radio sources that are brighter than 50 mJy at 1.4 GHz, having most of the radio flux in compact components (to facilitate a sensitive absorption search), and that are associated with galaxy mergers. We restricted our search to galaxies with spectroscopic redshift , so that we can robustly identify galaxy mergers through visual inspection of the optical images. We selected the following types of systems as mergers (i) an individual galaxy with a very disturbed morphology and sometimes with double nuclei, which is likely to be in the final stages of merging; (ii) a close pair of interacting galaxies which are at a projected separation 10 kpc or which show signs of strong tidal disturbances. In addition, we cross-matched samples of local galaxy mergers,111as compiled in Comerford et al. (2015); Barcos-Muñoz et al. (2017); Satyapal et al. (2017); Weston et al. (2017) mainly identified from SDSS and the Wide-field Infrared Survey Explorer (WISE; Wright et al., 2010) catalogs, with radio sources from FIRST and NVSS. Our final sample consists of ten merging systems, whose details are provided in Table 1.
| Source | Coordinates | Projected | Velocity | (1.4 GHz) | Radio | Spectral | |
|---|---|---|---|---|---|---|---|
| (J2000) | separation | separation | (mJy) | morphology | index | ||
| RA Dec | (kpc) | (km s-1) | |||||
| (1) | (2) | (3) | (4) | (5) | (6) | (7) | (8) |
| J00547305 | 00:54:03.99 73:05:05.40 | 0.01570 | 5 | — | 124 | R | 0.82 |
| 00:54:04.53 73:05:19.80 | — | ||||||
| J10360221 | 10:36:31.96 02:21:45.89 | 0.04990 | 2 | 170 | 202 | C | 0.46 |
| 10:36:31.88 02:21:44.10 | 0.05049 | ||||||
| J11001002 | 11:00:17.98 10:02:56.84 | 0.03624 | 13 | 90 | 140 | C | 0.33 |
| 11:00:19.10 10:02:50.76 | 0.03594 | 31 | R | — | |||
| J11081015 | 11:08:26.51 10:15:21.70 | 0.0273 | 6 | 820 | 324 | R | 0.65 |
| 11:08:26.93 10:15:31.80 | 0.0245 | ||||||
| J12142931 | 12:14:17.80 29:31:43.42 | 0.06350 | 8 | 70 | 77 | R | — |
| 12:14:18.25 29:31:46.70 | 0.06326 | ||||||
| J13156207 | 13:15:35.10 62:07:28.43 | 0.03083 | 21 | 140 | 46 | C | 0.67 |
| 13:15:30.72 62:07:44.84 | 0.03130 | 8 | R | — | |||
| J13203408 | 13:20:35.40 34:08:21.75 | 0.02306 | — | — | 104 | R | 0.56 |
| J13561026 | 13:56:46.12 10:26:09.09 | 0.12313 | 2 | — | 60 | C | — |
| 13:56:46.12 10:26:08.00 | — | ||||||
| J13561822 | 13:56:02.89 18:22:18.29 | 0.05036 | 4 | — | 368 | C | 0.98 |
| 13:56:02.63 18:22:17.68 | — | ||||||
| J20540041 | 20:54:49.61 00:41:53.07 | 0.20276 | 11 | 350 | 377 | C | 0.15 |
| 20:54:49.64 00:41:49.85 | 0.20136 |
Notes. Column 1: name of the galaxy merger used throughout this work. Column 2: J2000 coordinates of the galaxies undergoing merger. Column 3: redshift measured using data from NED (for J00547305 and J13561822), SALT (for J10360221, J11001002, J11081015 and J20540041), and SDSS (for J12142931, J13156207, J13203408 and J13561026). Column 4: projected separation between the two galaxy nuclei in kpc, obtained from the measured angular separation. Note that separate nuclei cannot be distinguished in J13203408 based on available optical images. Column 5: line-of-sight velocity separation in km s-1 between the two galaxy nuclei, taking the radio source or stronger radio source as the reference (whenever SDSS spectra or our SALT spectra are available for both nuclei). Column 6: total flux density at 1.4 GHz in mJy of the radio source. In the case of J11001002 and J13156207, both the galaxies show radio emission. Column 7: Morphology of the radio source at arcsecond-scales ‘C’ is for compact and ‘R’ is for resolved. The radio parameters given in columns 6 and 7 are from FIRST, except in the case of J00547305 and J11081015, where they are from NVSS. Column 8: Spectral index of the radio source estimated from 1.4 GHz and 5 GHz fluxes whenever available in NED.
2.2 Radio Observations
The radio observations of nine sources were carried out using the Giant Metrewave Radio Telescope (GMRT) and that of one source (J20540041) were carried out using the Karl G. Jansky Very Large Array (VLA). The details of the observations are given in Table 2. The GMRT observations (Proposal IDs: 27_015, 29_079, 32_038, 33_027) were carried out using the L-band receivers with either the 4 MHz or 16 MHz baseband bandwidth split into 512 channels. We reobserved two sources, J00547305 and J10360221, with a larger bandwidth to confirm the broad and shallow absorption detected towards them. The spectra of these two sources presented here are from the observations obtained with a larger bandwidth.
We searched for both H i 21-cm and OH 18-cm absorption towards J20540041 using L-band receivers on the VLA (Proposal IDs: 15A-176, 17B-130). The H i observations were carried out in A-configuration and the OH observations were carried out in B-configuration. The observations used a single 8 MHz sub-band, which was split into 4096 channels for the H i data, and 512 channels for the OH data.
All of the above data were acquired in two polarization products. In each of these observations, the pointing centre was at the coordinates of the radio source, and the band was centred at the redshifted H i 21-cm (or OH 18-cm) line frequency. Standard calibrators were regularly observed during each of the observations for calibration of flux density, bandpass, and phase. The data were reduced using the National Radio Astronomy Observatory (NRAO) Astronomical Image Processing System (aips) following standard procedures, as described in Dutta et al. (2016). The absorption spectra were extracted from spectral cubes that were obtained by imaging the continuum-subtracted data using ROBUST=0 weighting. In case of the system J00547305, where H i 21-cm emission is detected, the spectral cubes were deconvolved using a mask true for pixels with absolute flux greater than three times the single channel noise.
| Source | Date | Time | Central | Spectral | Channel |
|---|---|---|---|---|---|
| Frequency | coverage | width | |||
| (h) | (MHz) | (km s-1) | (km s-1) | ||
| (1) | (2) | (3) | (4) | (5) | (6) |
| J00547305 | 17 Jan 2016 | 3.0 | 1398.5 | 900 | 2 |
| 08 May 2017 | 2.5 | 1398.5 | 3500 | 7 | |
| J10360221 | 25 Aug 2013 | 2.4 | 1352.3 | 900 | 2 |
| 31 Aug 2014 | 2.5 | 1352.3 | 3500 | 7 | |
| J11001002 | 24 Aug 2013 | 3.2 | 1371.0 | 900 | 2 |
| J11081015 | 17 Jan 2016 | 3.0 | 1382.7 | 900 | 2 |
| J12142931 | 24 Dec 2014 | 5.9 | 1335.9 | 900 | 2 |
| J13156207 | 26 Feb 2018 | 4.2 | 1378.0 | 3500 | 7 |
| J13203408 | 31 Aug 2014 | 2.6 | 1389.3 | 3500 | 7 |
| J13561026 | 27 Feb 2018 | 4.0 | 1264.7 | 4000 | 8 |
| J13561822 | 30 Dec 2017 | 2.9 | 1352.2 | 3500 | 7 |
| J20540041 | 20 Jun 2015 | 1.2 | 1182.2 | 2000 | 0.5 |
| (OH 18-cm) | 1422 Jan 2018 | 4.5 | 1385.0 | 1700 | 3 |
Notes. Column 1: galaxy merger name. Column 2: date of observation. Column 3: on-source observing time in h. Column 4: central frequency of the observing band in MHz. Column 5: spectral coverage in km s-1. Column 6: channel width in km s-1.
2.3 Optical Observations
We obtained the optical spectra of four sources in our sample (J10360221, J11001002, J11081015 and J20540041) using the Robert Stobie Spectrograph (RSS) on the Southern African Large Telescope (SALT) in long-slit mode, under the programs 2014-2-SCI-017 (PI: Dutta) and 2013-1-IUCAA-002 (PI: Srianand). The observations of J10360221, J11001002 and J11081015 were carried out with a 1.5′′ slit and the PG0900 grating (coverage 4200-7200 Å), while that of J20540041 were carried out with a 2′′ slit and the PG1300 grating (coverage 6600-8600 Å). The spectral settings were chosen to cover the expected wavelength ranges of the nebular emission lines. The spectral resolution ranges over 200300 km s-1. The seeing was between 1.4′′ to 2′′. Each source was observed in one or two slit position angles, and each observation was split into two 20 mins exposures. In the case of J20540041, observations were carried out with dithering to remove fringing effects in the red part. The data were reduced using the SALT science pipeline (Crawford et al., 2010), i.e. PYSALT222PYSALT user package is the primary reduction and analysis software tools for the SALT telescope (http://pysalt.salt.ac.za/)., and standard IRAF tasks333IRAF is distributed by the National Optical Astronomy Observatories, which are operated by the Association of Universities for Research in Astronomy, Inc., under cooperative agreement with the National Science Foundation., as described in Dutta et al. (2017a). The spectrophotometric standard stars, LTT 7379 and LTT 9239, were used for flux calibration.
3 Results
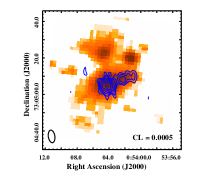
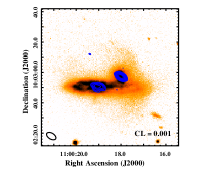
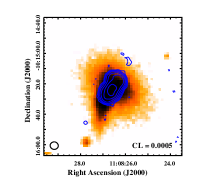
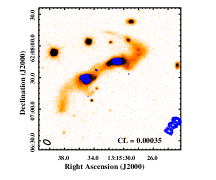
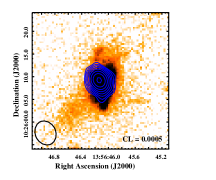
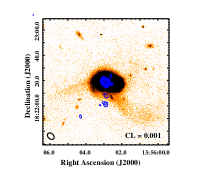
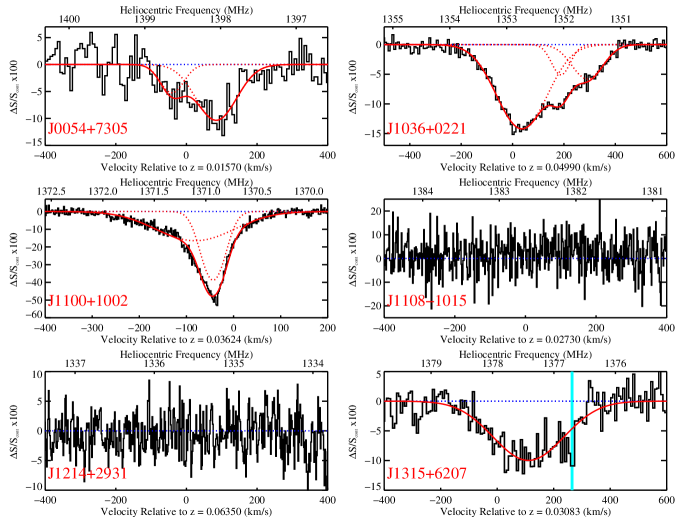
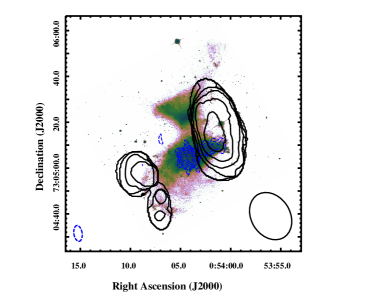
We have detected absorption towards seven out of the ten merging systems. The radio continuum maps from our observations overlaid on the optical images of the mergers are shown in Fig. 1, and the absorption spectra are shown in Fig. 2. The typical spatial resolution of the radio data is . The absorption spectra were extracted at the locations of the continuum peak flux density in all the cases. The parameters derived from the spectra are listed in Table 3. In the case of systems where there are two radio continuum peaks, we also list the parameters derived from the spectra towards the weaker peaks. The optical depth limits for the non-detections have been estimated assuming a velocity width of 100 km s-1 throughout. Further, we perform multi-component Gaussian fitting of the absorption lines. The number of components is decided by checking when the is closest to unity. The resultant fits are shown overplotted on the spectra in Fig. 2, and the parameters of the fits are given in Table 4. In principle, the full-width-at-half-maximum (FWHM) of the components can be used to place upper limit on the gas kinetic temperature, assuming that the line width is purely due to thermal motions (see section 4 of Dutta et al., 2017b). However, that is not applicable here, since the gas is likely to have complex motions due to the ongoing merger (see Section 4.3). Moreover, the radio structure at sub-arcsecond-scales can be complex and affect the line widths in some cases (see Section 4.4).


| Source | Peak Flux | Total Flux | Spectral | (H i) | ||||
|---|---|---|---|---|---|---|---|---|
| Density | Density | rms | (Ts K)() | |||||
| (mJy beam-1) | (mJy) | (mJy beam-1) | (km s-1) | ( cm-2) | (km s-1) | (km s-1) | ||
| (1) | (2) | (3) | (4) | (5) | (6) | (7) | (8) | (9) |
| J00547305 | 32 | 77 | 1.2 | 0.14 0.03 | 20 2 | 37 3 | 296 | 104 |
| 4 | 13 | 0.8 | 0.195 | 17 | 31 | — | — | |
| J10360221 | 132 | 165 | 0.9 | 0.16 0.01 | 50 1 | 92 1 | 447 | 2 |
| 14 | 21 | 0.9 | 0.065 | 4 | 6 | — | — | |
| J11001002 | 125 | 129 | 2.0 | 0.76 0.02 | 66 1 | 121 1 | 224 | 35 |
| 14 | 25 | 1.8 | 0.137 | 3 | 5 | — | — | |
| J11081015 | 23 | 220 | 1.7 | 0.072 | 3 | 6 | — | — |
| 13 | 89 | 1.7 | 0.130 | 6 | 11 | — | — | |
| J12142931 | 59 | 62 | 1.9 | 0.031 | 1 | 2 | — | — |
| 23 | 26 | 2.5 | 0.111 | 7 | 13 | — | — | |
| J13156207 | 38 | 48 | 0.8 | 0.13 0.02 | 30 1 | 55 2 | 319 | 93 |
| 7 | 10 | 0.9 | 0.133 | 9 | 17 | — | — | |
| J13203408 | 62 | 109 | 0.9 | 0.31 0.01 | 62 1 | 113 2 | 302 | 50 |
| J13561026 | 72 | 79 | 1.7 | 0.20 0.02 | 26 1 | 47 2 | 216 | 148 |
| J13561822 | 369 | 388 | 2.0 | 0.005 | 0.3 | 1 | — | — |
| J20540041 | 362 | 376 | 7.8 | 0.61 0.02 | 30 1 | 55 1 | 127 | 94 |
Notes. Column 1: galaxy merger name. Column 2: peak flux density in mJy beam-1. Results from spectra extracted towards the weaker radio continuum peak, in the case of systems with multiple peaks, are also listed. Column 3: total flux density in mJy. Column 4: spectral rms in mJy beam-1 (at the spectral resolution specified in Column 6 of Table 2). Column 5: peak optical depth in case of detections; 1 upper limit, i.e. rms, of the optical depth in case of non-detections. Column 6: integrated optical depth in case of detections; 3 upper limit on the integrated optical depth with data smoothed to 100 km s-1 in case of non-detections. Column 7: (H i) assuming spin temperature, Ts = 100 K, and covering factor, = 1, in units of cm-2 (3 upper limit in case of non-detections). Column 8: velocity width which contains 90% of the total optical depth () in km s-1 in case of detections. Column 9: velocity shift between the systemic redshift of the radio source (from optical emission lines) and the peak optical depth (), in km s-1, in case of detections (with positive sign indicating redshifted absorption and negative sign indicating blueshifted absorption).
| Source | No. | FWHM | ||
|---|---|---|---|---|
| (km s-1) | ||||
| (1) | (2) | (3) | (4) | (5) |
| J00547305 | 1 | 0.01562 0.00002 | 78 10 | 0.05 0.02 |
| 2 | 0.01599 0.00001 | 133 8 | 0.11 0.01 | |
| J10360221 | 1 | 0.05003 0.00001 | 224 9 | 0.15 0.01 |
| 2 | 0.05056 0.00003 | 84 18 | 0.05 0.04 | |
| 3 | 0.05092 0.00005 | 140 25 | 0.06 0.02 | |
| J11001002 | 1 | 0.03596 0.00001 | 189 2 | 0.18 0.01 |
| 2 | 0.03609 0.00001 | 58 1 | 0.49 0.01 | |
| J13156207 | 1 | 0.03121 0.00001 | 288 7 | 0.11 0.01 |
| J13203408 | 1 | 0.02293 0.00003 | 118 11 | 0.16 0.05 |
| 2 | 0.02331 0.00002 | 124 11 | 0.28 0.06 | |
| 3 | 0.02384 0.00005 | 115 26 | 0.04 0.02 | |
| J13561026 | 1 | 0.12365 0.00001 | 133 3 | 0.18 0.01 |
| J20540041 | 1 | 0.20286 0.00001 | 133 3 | 0.05 0.01 |
| 2 | 0.20297 0.00001 | 30 1 | 0.26 0.01 | |
| 3 | 0.20313 0.00001 | 27 1 | 0.52 0.01 |
Notes. Column 1: galaxy merger name. Column 2: identification number of absorption component. Column 3: redshift of the component. Column 4: full-width-at-half-maximum (FWHM) in km s-1 of the component. Column 5: peak optical depth () of the component.
3.1 Individual Systems
Below we describe the individual systems from our sample in brief.
3.1.1 J00547305
This system consists of the luminous infrared galaxy (LIRG; Sanders & Mirabel, 1996), MCG 1202001 (Sanders et al., 2003). Optical integral field spectroscopy of the central region of this LIRG classifies it as a Composite system (Alonso-Herrero et al., 2009). The system has been detected in H i 21-cm emission (integrated flux density = 6.6 Jy km s-1; Courtois et al., 2011), as well as neutral carbon and molecular CO emission (Israel et al., 2015). Hubble Space Telescope / Advanced Camera for Surveys (HST/ACS) imaging of this system reveals it to be a major merger, with separation between the two interacting galaxies to be 5.3 kpc (Kim et al., 2013). We detect resolved radio emission from one of the galaxies in our GMRT 1.4 GHz continuum map. We detect broad and shallow absorption towards the peak of the continuum emission. A two-component Gaussian fit to the absorption profile produces a residual spectrum nearly consistent with the rms noise, and addition of further components is not warranted by the data. The stronger component is redshifted by 84 km s-1 from the systemic redshift of the radio source, 0.01570 0.00007 (Strauss et al., 1992), while the second component is blueshifted by 40 km s-1.
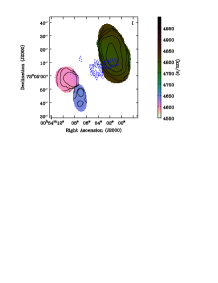
Furthermore, we detect H i 21-cm emission in our GMRT data. To map the emission, we imaged the continuum subtracted visibilities with ROBUST = 1 weighting and different uv-tapers. In Fig. 3, we show the moment-0 and moment-1 maps obtained from the spectral cube (imaged with an uv-taper of 20 kilolambda) with spatial resolution of 10.9′′ 8.5′′ (corresponding to 3.5 2.7 kpc2 at the redshift of the galaxy). These maps were created by integrating the emission using a mask true only for pixels with flux greater than three times the single channel noise (1.3 mJy beam-1). We recover 45% of the total emission that has been detected from this system by the Green Bank Telescope (Courtois et al., 2011). The total flux density does not vary significantly in spectral cubes of different spatial resolutions (). We checked for the presence of emission by extracting spectra at different locations around the radio source from the spectral cubes. As can be seen from Fig. 3, we do not detect emission near the peak of the radio continuum, where we detect the absorption. In the spectral cube from which we extract the absorption spectrum (spatial resolution of 3.5′′ 1.8′′; obtained with ROBUST = 0 weighting and no uv-taper), we get a 3 upper limit of (H i) cm-2 at the location of the peak optical depth integrated over the velocity spread of the absorption. Using this and the optical depth, we can place a limit on Ts 3600 K. Comparatively, from the spectral cube of lower spatial resolution of 10.9′′ 8.5′′, we obtain a 3 upper limit of (H i) cm-2 and Ts 380 K. From the velocity map in Fig. 3, it can be seen that the emission of the left region is redshifted with respect to that of the right. Comparing the velocity of the emission with that of the absorption, we find that the absorption occurs at intermediate velocities between the two emission peaks.
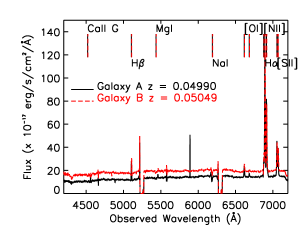
3.1.2 J10360221
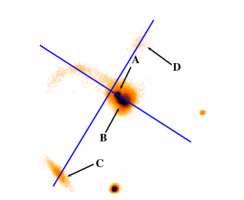
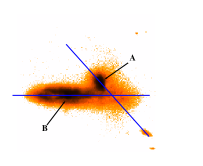
This system (VIII Zw 090) is classified as an ultraluminous infrared galaxy (ULIRG; Kilerci Eser et al., 2014) and a post-merger (Ellison et al., 2013), i.e. it consists of galaxies which are in the final stages of their interaction. H i 21-cm emission has not been detected from this system (log M(H i) M⊙; Ellison et al., 2015). This system consists of two interacting nuclei (separated by 2 kpc) and a tidal tail (see left panel of Fig. 4). One of the interacting nuclei shows radio continuum emission in our GMRT 1.4 GHz map. We have detected broad ( km s-1) absorption towards this radio source. There is another weaker (21 mJy) radio source, 18 kpc south-east of the strong one (see panel (b) of Fig. 1), towards which we do not detect absorption ((H i) cm-2, for Ts = 100 K and = 1). There is no optical counterpart of the second radio source in the SDSS images, and it is uncertain whether it is related to the present system or is a background source.
From our SALT long-slit data, we extracted spectra along the two slit position angles shown in the left panel of Fig. 4, using apertures of sizes ( kpc2). The two nuclei in this system are spatially resolved in the long-slit observations, and nebular emission lines of H , H , [N ii], [S ii] and [O i], and absorption lines of Na i, Mg i and Ca ii are detected in their spectra (see centre panel of Fig. 4). The [O iii] emission lines fall in the gap between two detectors unfortunately. We fit single component Gaussian to the emission lines to estimate the fluxes. We estimate the optical depth at the intrinsic -band, , using H and H emission line ratio and equation 3 of Argence & Lamareille (2009) and equation 3 of Wild et al. (2007).444We use an intrinsic ratio of 2.85 as expected for the case B recombination (Osterbrock & Ferland, 2006). When we use a higher ratio of 3.1 as maybe applicable for AGN (Osterbrock & Ferland, 2006), it leads to slightly lower SFRs, but the values are consistent within the uncertainties. The ranges over in the central region, and drops down to over the tidal tail. Then using the H flux corrected for dust attenuation, we estimate the star formation rate (SFR), following Kennicutt (1998). Note, however, that there is likely contribution from AGN to the emission particularly in the central regions, so the SFR values can be treated as upper limits. The SFR is higher in the central region ( M⊙ yr-1) and goes down to M⊙ yr-1 in the tail region. Additionally, using [N ii]H line ratio and the index given in Pettini & Pagel (2004), we estimate the metallicity, , which ranges over .
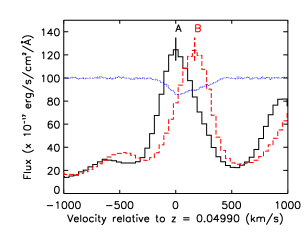
Since the [O iii] line is not covered, we cannot use the BPT diagnostic (Baldwin et al., 1981) to classify the emission line region. But the high log [N ii]H values () in the central region suggest that both the nuclei harbour AGNs (Osterbrock & Ferland, 2006). In addition, based on the nebular emission line ratios (log ([O iii]H ) 0.03, log ([N ii]H ) 0.25) from SDSS spectrum of the central region of the merger, it can be classified as a composite AGN/starburst system (following classification schemes of Baldwin et al., 1981; Kewley et al., 2001; Kauffmann et al., 2003). The emission lines originating from the nuclei (‘A’) co-spatial with the peak of the radio continuum are blueshifted from those of the other nuclei (‘B’) by km s-1. We measure the redshifts of the nuclear regions, ‘A’ and ‘B’, as 0.04990 0.00005 and 0.05049 0.00005, respectively. We estimate the SFR to be 7 2 M⊙ yr-1 and 9 3 M⊙ yr-1 in the two nuclei, ‘A’ and ‘B’, respectively. The absorption is best fitted with three Gaussian components. The strongest absorption component occurs at the systemic redshift of the nuclei ‘A’ (see right panel of Fig. 4). The other two components are redshifted by km s-1 and km s-1 with respect to the peak absorption. The component that is redshifted by km s-1 coincides in velocity with the peak optical emission from the nuclei ‘B’.
In the two-dimensional optical spectra, we noticed H emission extending beyond the stellar continuum. Such extended emission is also seen in the Galaxy Evolution Explorer (GALEX) ultraviolet (UV) images of this merger. The H filaments could be arising from shock-heated gas resulting from the ongoing merger. The [N ii]H ratio and the velocity dispersion of the emission lines can be used to separate shocked and star-forming regions (see Mortazavi & Lotz, 2018, and references therein). However, the low velocity resolution of our spectrum is not suitable for studying the kinematics of the ionized gas in detail. But the high log [N ii]H value () in the extended emission seen in the two-dimensional spectrum suggests that shocks are the likely source of ionization.
Further, from the SALT spectrum, we identify another galaxy to be at the same redshift (0.05061 0.00005) as that of the merger. This galaxy (marked ‘C’ in Fig. 4) is at a separation of ( kpc) south-east of the merger in the SDSS image, and could be interacting with the merging system. Note, however, that the galaxy seen to the north-west of the merger in the SDSS image (marked ‘D’ in Fig. 4), is actually not part of the merger, but is found to be a foreground galaxy at = 0.02189 0.00005 from the SALT spectrum.
3.1.3 J11001002
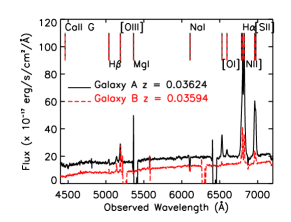
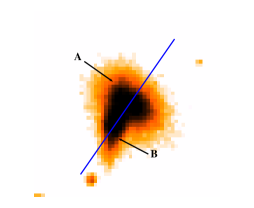
This system, UGC 06081, consists of two galaxies (nuclei separated by 11 kpc) undergoing a major merger. The main OH 18-cm absorption lines have not been detected in this system (Kazes & Dickey, 1985). However, strong intrinsic H i 21-cm absorption has been detected in this system previously by Bothun & Schommer (1983), Williams & Brown (1983) and Darling et al. (2011). Since this system has two radio sources (separation ), which were not resolved in the previous single dish spectral line observations, the source of the absorption had remained ambiguous. Using our interferometric spectral line observations, we confirm that the absorption arises towards the stronger radio source in the north-west (see panel (c) of Fig. 1). No absorption is detected towards the weaker radio source in the south-east (see Table 3). The absorption consists of two main components a strong narrow one and a broad shallow one, that is blueshifted with respect to the peak absorption. The total integrated optical depth obtained by us is consistent with that estimated by Darling et al. (2011), who had assumed that the absorption arises in the stronger north-west radio source seen in the FIRST image.
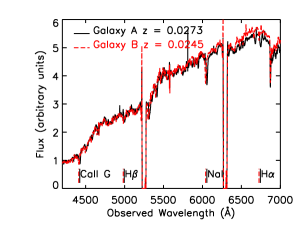
We extracted spectra from our SALT long-slit observations taken along the two slit position angles shown in the left panel of Fig. 5. We used apertures of sizes ( kpc2). We detect nebular emission lines of H , H , [N ii], [S ii], [O i] and [O iii], and absorption lines of Na i, Mg i and Ca ii from both the galaxies in our SALT long-slit spectra (see centre panel of Fig. 5). We estimate the dust optical depth () and extinction-corrected SFR as described in Section 3.1.2. The values are high in the central parts () of the two galaxies compared to the outer discs (). The SFR is similarly high in the central parts ( M⊙ yr-1) and lower in the outer parts ( M⊙ yr-1). We estimate the metallicity using the index of Pettini & Pagel (2004). The metallicity () ranges over , with the central regions tending to have lower metallicity compared to the outer regions. This is consistent with the metallicity dilution observed in the central regions of galaxy pairs due to low-metallicity gas being funneled to the centre during a merger (Kewley et al., 2006; Ellison et al., 2008; Scudder et al., 2012; Cortijo-Ferrero et al., 2017).
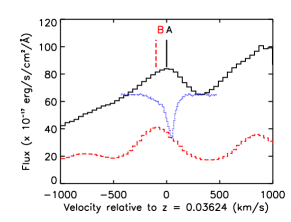
The emission lines originating from the stronger radio source (‘A’) are very broad ( km s-1), and they are redshifted by km s-1 from those originating from the weaker radio source (‘B’). We estimate the redshifts, based on the emission lines from the nuclear region, to be 0.03624 0.00008 and 0.03594 0.00005 for ‘A’ and ‘B’, respectively. The SFR in the nuclear region of ‘A’ and ‘B’ is 4.5 1.0 and 2.0 1.0 M⊙ yr-1, respectively. Though, we note again that the AGN contributes to the line emission in the central regions. Emission line ratio diagnostic (BPT diagram; Baldwin et al., 1981) indicates that the gas in the central regions of both the galaxies is likely to be ionized by an AGN (following Kewley et al., 2001; Kauffmann et al., 2003). The peak of the absorption is blueshifted by 35 km s-1 from the peak optical emission from the stronger radio source, ‘A’, whereas the broader absorption component is blueshifted by 80 km s-1 (see right panel of Fig. 5). Though, as noted above, the emission lines from this source are very broad and likely to have multiple components.
From the line ratios in the outer regions, we find that the AGN contribution to the gas ionization is likely to extend to 10 kpc from the central regions. We also detect H and [O iii] emission extending beyond the stellar continuum around the merging system in the two-dimensional spectra, which could indicate the presence of shocked gas, similar to the system J10360221. In addition, the GALEX images of this system show a hole or deficit in the UV emission from the weaker radio source, ‘B’, that is co-spatial with the peak of the radio continuum, infrared and optical emission, which could indicate the presence of a dusty AGN. The lack of absorption towards this radio source is thus interesting. Though the radio source is weak (flux 25 mJy), we can rule out strong absorption, i.e. (H i) cm-2, for Ts = 100 K and = 1.
3.1.4 J11081015
This system, also known as NGC 3537, consists of two interacting elliptical galaxies, with their nuclei at a projected separation of 6 kpc. Absorption from H , H , Ca ii and Na i are detected in our SALT long-slit spectra of both the galaxies (see Fig. 6), indicating that these galaxies are non-star-forming. We estimate the redshift of the two galaxies marked ‘A’ and ‘B’ in Fig. 6, as 0.0273 0.0003 and 0.0245 0.0003, respectively. The peak of the H absorption lines from the two galaxies are separated by 800 km s-1. We do not detect any extended emission between the two galaxies in the two-dimensional spectra. The radio emission is resolved in our GMRT 1.4 GHz continuum map, with the peak emission accounting for only 7% of the total emission. H i 21-cm emission has been detected from this system with a total flux density of 7.5 1.1 Jy km s-1 (Richter & Huchtmeier, 1987). However, we do not detect absorption towards any of the continuum components, with (H i) cm-2, for Ts = 100 K and = 1, towards the continuum peak.
3.1.5 J12142931
This system was observed as part of our ‘Miscellaneous Sample’ of quasar-galaxy-pairs (Dutta et al., 2017a). Also known as Was 49, this is an isolated, dual AGN system consisting of the disk galaxy Was 49a, with a low luminosity Seyfert 2 nucleus, and the Type 2 AGN Was 49b, corotating at a projected radial separation of 8 kpc from the nucleus of Was 49a (Moran et al., 1992). The velocities of the optical emission lines from the two nuclei differ by 70 km s-1. The extreme luminosity of Was 49b is unusual for an AGN in the smaller galaxy of a minor-merger system (Secrest et al., 2017). Was 49b is also radio-loud, and its radio emission is resolved in our GMRT 1.4 GHz continuum map. We do not detect absorption towards any of the continuum points, which leads to (H i) cm-2, for Ts = 100 K and = 1, towards the continuum peak.
3.1.6 J13156207
This is a major merger (also known as UGC 8335, Arp 238) between two galaxies at a projected separation of 21 kpc. H i 21-cm and CO emission has been detected from this LIRG (Huchtmeier & Richter, 1989; Leech et al., 2010), however no OH 18-cm absorption has been detected (Henkel et al., 1986; Staveley-Smith et al., 1987). Based on Herschel far-infrared and sub-millimetre imaging observations, the two interacting galaxies have SFRs of 8 and 55 M⊙ yr-1 and dust masses of 6 and 7 M⊙ (Cao et al., 2016). The nuclei of both the interacting galaxies show radio emission in our GMRT map. We detect broad absorption towards the stronger radio source. Single component Gaussian gives best fit to the absorption. The peak optical depth is redshifted by 90 km s-1 with respect to the systemic velocity measured from optical emission lines. The second radio source is too weak to obtain a strong constraint on the absorption ((H i) cm-2, for Ts = 100 K and = 1).
Absorption has been previously reported from this system in Maccagni et al. (2017). The total optical depth reported by them is three times less than that obtained by us, though the FWHM of the absorption is similar. Note also that the total continuum flux densities in both the data match within 10%. The beam of their observations (4512′′) using the Westerbork Synthesis Radio Telescope (WSRT) has 90 times larger area compared to that of our observations. The difference in the optical depth is not expected if the absorbing gas uniformly covers the radio source. However, in the presence of partial coverage, the optical depth measured using data obtained with WSRT tend to be lower than that measured using higher spatial resolution data obtained with GMRT. Thus, the higher optical depth we measure points towards the clumpy nature of the absorbing gas and partial coverage of the radio source.
We also detect another source in our GMRT radio continuum image at 1.5′ (or 60 kpc) south-west of J13156207 (see panel (f) of Fig. 1). There is no redshift information available for this source in the literature, so we do not know whether it is a background source or not. We do not detect absorption against this source. If the radio source happens to be a background source, we get (H i) cm-2, for Ts = 100 K and = 1, towards the strongest emission (19 mJy beam-1) of the continuum.
3.1.7 J13203408
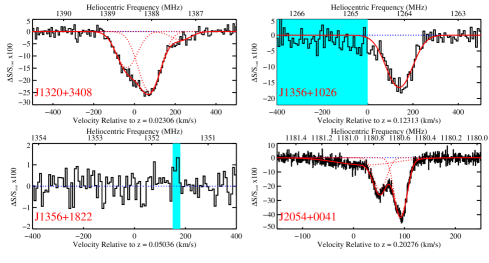
This major merger (also known as IC 883, UGC 8387, Arp 193) consists of a LIRG that is classified as a starburst-AGN composite. The radio source has a core-jet morphology at sub-parsec scales (Romero-Cañizales et al., 2017). Detection of H i 21-cm absorption towards the radio source has been reported previously (Heckman et al., 1983; Clemens & Alexander, 2004; Geréb et al., 2015). Clemens & Alexander (2004), using sub-arcsecond-scale H i absorption and CO emission data, found differences in the velocity structure of the atomic and molecular gas components in the central regions of this merger. Our GMRT absorption spectrum is consistent with the results reported in the literature. We find that the absorption profile is best fitted with three Gaussian components. The SDSS spectra of the central region of this system measures the redshift from nebular emission lines as 0.02306 0.00001. The strongest absorption is redshifted by 70 km s-1 with respect to this. Among the other two components, one is redshifted by 200 km s-1 and the other is blueshifted by 40 km s-1.
3.1.8 J13561026
This system is classified as an ULIRG and consists of two merging nuclei separated by 2.5 kpc. The northern nucleus hosts a luminous obscured Type 2 double-peaked [O iii] AGN (Greene et al., 2009; Liu et al., 2010; Fu et al., 2011). This system has not been detected in OH 18-cm (Darling & Giovanelli, 2000). CO molecular emission has been mapped from this system (Sun et al., 2014). Both molecular and ionized gas outflows have been observed emerging from the obscured quasar (Sun et al., 2014; Greene et al., 2012). Extended X-ray emission has also been observed around this quasar, that is co-spatial with the ionized gas outflow. This quasar shows compact radio emission in our GMRT 1.4 GHz map. Absorption is detected against the radio emission, and is best fit with a single Gaussian. The peak of the absorption is redshifted by 150 km s-1 from the systemic redshift of measured from SDSS spectra. We are unable to securely confirm any outflowing neutral gas components due to strong radio frequency interference (RFI) over the corresponding frequency ranges. The total optical depth obtained by us is a factor of 2.5 times higher than that obtained by Maccagni et al. (2017) using WSRT, while the velocity width is similar. The total continuum flux densities in the two data are consistent within a factor of 1.3. We note that the signal-to-noise ratio (SNR) of the WSRT absorption spectrum is low, with the peak optical depth being detected at only 2 significance (though the total optical depth is detected at 8 significance). The higher optical depth measured using GMRT data compared to that measured using WSRT data could be related to the larger beam size of the latter and partial coverage of the radio source as discussed in Section 3.1.6.
3.1.9 J13561822
This is an ULIRG (known as Mrk 463 or UGC 8850) with double nuclei (separated by 4 kpc) and tidal tails (Mazzarella et al., 1991). The eastern nucleus is classified as a Seyfert 2 galaxy and shows strong radio emission. The western nucleus is also an AGN, making this a binary AGN system (Bianchi et al., 2008). It has been detected in CO emission (Pearson et al., 2016), but not in H i 21-cm emission (Bieging & Biermann, 1983). Recently, Treister et al. (2018) have conducted a detailed study of this system using optical, infrared and sub-mm integral field unit (IFU) spectroscopy. They detect both outflowing ionized gas and inflowing molecular gas around the eastern nucleus. Interestingly, we do not detect any absorption ((H i) cm-2, for Ts = 100 K and = 1) towards the radio source, which is co-spatial with the eastern nucleus. This could be because most of the cold gas in the circumnuclear region is in the molecular form. The non-detection could also be related to the complex radio structure and small covering factor of the cold gas clumps. While the radio source is compact in our GMRT 1.4 GHz continuum map, it is resolved in the 18-cm sub-arcsecond-scale (18 pc resolution) map presented in Kukula et al. (1999). The total flux is 25% of the arcsecond-scale flux and there are multiple radio components spread over 1 kpc in this map, with the peak flux density being 38 mJy beam-1.
3.1.10 J20540041
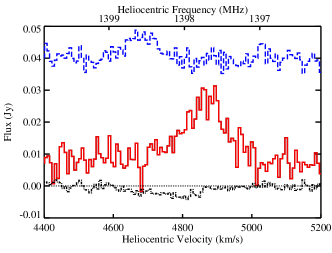
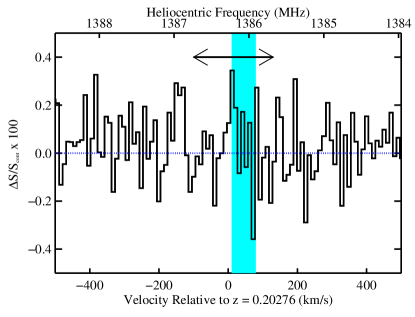
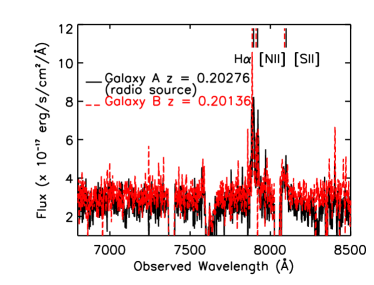
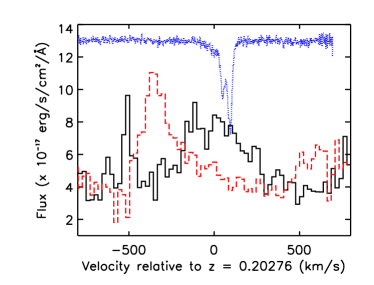
This system was initially selected as a quasar-galaxy-pair to study the cold gas around low- galaxies (‘Miscellaneous Sample’ of Dutta et al., 2017a). However, our SALT long-slit observations revealed it to be a merging system. It consists of two interacting galaxies at , at a projected separation of 11 kpc. One of them is the radio source PKS 2052005, which is classified as a flat-spectrum radio source (Healey et al., 2007). We detect strong and broad multi-component absorption towards the radio source using VLA. This is the only system in our sample whose redshifted OH 18-cm absorption lines fall in frequency ranges that are relatively unaffected by strong RFI. So we searched for OH absorption, i.e. the main 1665 and 1667 MHz lines, using VLA. We do not detect any OH absorption, though part of the frequency range, over which H i absorption has been detected, is affected by RFI (see Fig. 7). The radio source, similar as in the H i data, is compact with a peak flux density of 378 mJy beam-1. We reach a optical depth sensitivity of, 0.07 km s-1, for a velocity width of 30 km s-1 (the FWHM of the two narrow Gaussian components detected in H i absorption; see Table 4). From this we estimate (OH) cm-2, assuming an excitation temperature of 10 K (following equation 1 of Liszt & Lucas, 1996), i.e. (OH)(H i) for the individual H i absorption components. Thus, the H i absorption is most likely tracing the diffuse gas in the circumnuclear region of this merger.
H emission is detected from both the merging galaxies in our SALT long-slit spectra, separated by 350 km s-1 (see left panel of Fig. 8). [N ii] and [S ii] emission are also detected, but these wavelength ranges are affected by sky emission lines and have poor SNR. The H i 21-cm absorption consists of three components two narrow ones and a broad one. The velocity range of the absorption coincides with that of the H emission from the radio galaxy (‘A’, = 0.2028 0.0005; see right panel of Fig. 8). No absorption is detected at the velocity of the other galaxy (‘B’, = 0.2014 0.0005), whose nebular emission is blueshifted with respect to that of the radio galaxy (‘A’) by km s-1. From the H emission, we estimate the SFR (uncorrected for extinction) to be and M⊙ yr-1 for the galaxies ‘A’ and ‘B’, respectively (following Kennicutt, 1998).
4 Discussion
4.1 Detection rate of neutral gas in mergers
The detection rate of absorption in our sample of mergers is 70 26%. Absorption is not detected in three systems, J11081015, J12142931 and J13561822. The system J11081015, consisting of two red non-star-forming galaxies, is likely to be a gas-poor, dry merger. H i 21-cm emission has been detected from this system using single dish observation (Section 3.1.4), which has spatial resolution of few arcmins and does not resolve the system. Though this indicates the presence of neutral gas, the non-detection of absorption towards the central radio source suggests the lack of cold neutral gas in the central region (few kiloparsecs) of this system. J12142931 and J13561822 are double nuclei systems, where one of the nuclei shows radio emission. While J13561822 shows tidal tails, J12142931 is a minor merger without any significant morphological disturbances visible in the SDSS image. As mentioned in Section 3.1.9, J13561822 does show the presence of molecular gas around both its nuclei. Our GMRT spectra indicates that (H i) towards these radio sources (Table 3).
Next, to get a more statistically robust estimate of the detection rate of absorption in mergers, we have compiled a list of all low- () strong radio sources that are associated with galaxy mergers and have been searched for absorption in the literature (see Table 5). We visually inspected the available optical images (mostly from SDSS, in some cases from DSS) of the radio sources that have been searched for absorption in the literature555Using compilations given in Gupta et al. (2006); Chandola et al. (2011); Chandola et al. (2013); Geréb et al. (2015); Maccagni et al. (2017). Note that in these studies, the targets were selected purely based on their radio emission and are unbiased with respect to their optical morphology.. We also cross-matched samples of local galaxy mergers from the literature (see Section 2) with the above compilations of absorption searches in low- radio sources. For identification of mergers we followed the same criteria as adopted for selecting our sample (see Section 2). We find 19 merging systems associated with radio sources at , and 17 of them have been detected in absorption (see Table 5). In the case of multiple radio components in a system, we have considered the absorption detected towards the strongest radio component. Combining the above mergers with our sample gives a detection rate of % in merging systems. This is considerably higher (by times) than the typical detection rates (%) in samples of low- radio sources (see for example table 1 of Maccagni et al., 2017). Maccagni et al. (2017) also find a similar high rate (%) of incidence of absorption in a smaller sample (9) of interacting systems compared to samples of non-interacting radio galaxies. The high detection rate in merging systems indicates large covering factor of neutral gas in their circumnuclear regions.
| Name | Coordinates | (1.4 GHz) | (H i) | FWHM | Ref. | ||
|---|---|---|---|---|---|---|---|
| (J2000) | (mJy) | (Ts K)() | (km s-1) | (km s-1) | |||
| RA Dec | ( cm-2) | ||||||
| (1) | (2) | (3) | (4) | (5) | (6) | (7) | (8) |
| NGC 2623 | 08:38:24 25:45:17 | 0.0185 | 95 | 67 | 254 | 64 | 1 |
| UGC 5101 | 09:35:52 61:21:12 | 0.0394 | 147 | 54 | 536 | 78 | 2 |
| SDSS J094221.98062335.2 | 09:42:22 06:23:35 | 0.1232 | 108 | 91 | 75 | 0 | 3 |
| NGC 2992 | 09:45:42 14:19:35 | 0.0077 | 227 | 57 | 95 | 18 | 4 |
| SDSS J105327.25205835.9 | 10:53:27 20:58:36 | 0.0526 | 84 | 5 | 156 | 58 | 2 |
| NGC 3690 | 11:28:32 58:33:43 | 0.0104 | 282 | 94 | 207 | 165 | 1 |
| MRK 231 | 12:56:14 56:52:25 | 0.0422 | 243 | 29 | 179 | 0 | 5 |
| NGC 4922 | 13:01:25 29:18:50 | 0.0234 | 40 | 15 | 148 | 54 | 6 |
| NGC 5222 | 13:34:56 13:44:32 | 0.0231 | 34 | 29 | 130 | 101 | 6 |
| NGC 5256 | 13:38:17 48:16:32 | 0.0276 | 55 | 13 | 140 | 176 | 6 |
| Mrk 273 | 13:44:42 55:53:13 | 0.0373 | 132 | 86 | 570 | 85 | 2 |
| 4C12.50 | 13:47:33 12:17:24 | 0.1217 | 4860 | 3 | 135 | 45 | 7 |
| IRASF 143945332 | 14:41:04 53:20:09 | 0.1045 | 40 | 5 | — | — | 6 |
| VV 059 | 15:08:05 34:23:23 | 0.0456 | 130 | 125 | 102 | 178 | 8 |
| 3C 321 | 15:31:43 24:04:19 | 0.0961 | 81 | 92 | 33 | 235 | 9 |
| Arp 220 | 15:34:57 23:30:11 | 0.0181 | 316 | 132 | 238 | 32 | 10 |
| NGC 6040 | 16:04:26 17:44:31 | 0.0409 | 72 | 3 | — | — | 2 |
| SDSS J163804.02264329.0 | 16:38:04 26:43:29 | 0.0652 | 36 | 25 | 111 | 96 | 6 |
| NGC 6240 | 16:52:58 02:24:03 | 0.0245 | 427 | 128 | 348 | 44 | 11 |
Notes. Column 1: galaxy merger name. Column 2: J2000 coordinates of the galaxies undergoing merger. Column 3: redshift of the galaxy merger. Column 4: total flux density at 1.4 GHz in mJy of the radio source from FIRST (from NVSS in the case of NGC 2992 and NGC 6240). Column 5: (H i) assuming Ts = 100 K and = 1, in units of cm-2. Column 6: full-width-at-half-maximum (FWHM) in km s-1 of the absorption. Column 7: velocity shift () in km s-1 of the peak absorption and the galaxy systemic optical redshift. Column 8: reference for the H i 21-cm absorption data 1: Dickey (1986); 2: Geréb et al. (2015); 3: Srianand et al. (2015); 4: Gallimore et al. (1999); 5: Carilli et al. (1998a); 6: Maccagni et al. (2017); 7: Gupta et al. (2006); 8: Chandola et al. (2011); 9: Chandola et al. (2012); 10: Mundell et al. (2001); 11: Baan et al. (2007)
4.2 Association of high column density neutral gas with mergers
Srianand et al. (2015) have noted that high column density absorbing gas, i.e. (H i) cm-2, appear to be associated with galaxy mergers. We plot the fraction of merging systems among low- radio sources showing absorption as a function of different (H i) cut-offs in Fig. 9. For this we have used the literature compilations of intrinsic absorbers as mentioned in Section 4.1, and our sample of mergers and the mergers listed in Table 5. We have considered Ts = 100 K and = 1 to convert the optical depth of the absorption to (H i). It can be seen that the fraction of mergers increases as the (H i) cut-off increases. About 50% of the absorbers with (H i) cm-2 arise from radio sources that are associated with mergers, and all the five sources having (H i) cm-2 are associated with mergers. Hence, we confirm the point made by Srianand et al. (2015) that extremely strong associated absorbers have very high probability of arising from merging systems. Though we note the caveat that visual identification of mergers is subjective and in some cases we are limited by the available optical data. However, visual classification is still considered the most reliable method for identification of merging/interacting systems (e.g. Weston et al., 2017), and majority of the sources considered here have optical images and spectra available in SDSS.
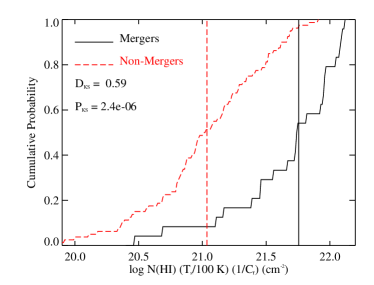
The association of high (H i) gas with mergers can be further seen from the left panel of Fig. 10, which shows the cumulative distribution of (H i) of absorption detected from radio sources associated with mergers compared to that of intrinsic absorption from non-merging radio sources. The merging systems show stronger absorption with a median (H i) = cm-2, which is six times higher compared to the median (H i) in the non-merging sources. A two-sided Kolmogorov-Smirnov (KS) test between the two (H i) distributions indicates that the maximum deviation between the two cumulative distribution functions is = 0.59, with a probability of = (where is the probability of finding this value or lower by chance). Therefore, the (H i) distribution in samples of radio-loud AGNs can be used to statistically identify merger populations at high- and in future/ongoing blind H i 21-cm absorption surveys with the Square Kilometre Array pathfinders/precursors (Morganti et al., 2015; Gupta et al., 2016).


4.3 Kinematics of neutral gas in mergers
The absorption lines detected in our sample are broad ( km s-1), and we typically resolve two to three components in each absorption, with the FWHM of individual components ranging over km s-1. The absorption profiles of the mergers compiled from the literature are also broad ( km s-1), although the individual components may not be distinguished in some cases due to low spectral resolution data. We compare the widths of the absorption lines detected from mergers and non-mergers in the right panel of Fig. 10. For the sources from the samples of Geréb et al. (2015) and Maccagni et al. (2017), we use the Busy function FWHM provided by them. For the other sources from the literature, we measure the FWHM of the absorption profile as the full width at half the peak optical depth, using the Gaussian parameters provided. While the velocity widths of absorption lines arising from mergers tend to be slightly larger on average, the difference between the two cumulative distribution functions is not very significant (with = 0.24 and = 0.20). The slightly larger widths of the absorption lines in merging sources can be attributed to complex gas flow processes due to the ongoing merger.
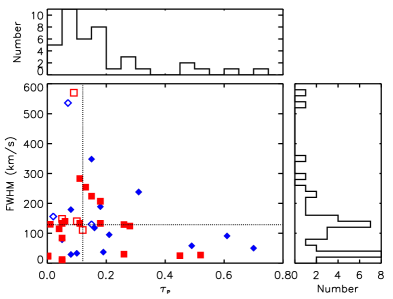
The left panel of Fig. 11 shows the distribution of FWHM and peak optical depth () of the individual absorption components detected from mergers. Since individual component parameters are not provided for the absorbers listed in Geréb et al. (2015) and Maccagni et al. (2017), we plot these measurements as open symbols. It can be seen that there exist absorption components that are either narrow and strong, or broad and shallow. In addition to the velocity widths, the velocity shift between the absorption lines and the emission lines can be used to infer about the kinematics and origin of the absorbing gas. The right panel of Fig. 11 shows the distribution of this velocity shift () for the different absorption components as a function of their total optical depth (). We have considered the systemic velocity of the stronger radio source as reference in case of mergers consisting of multiple sources. The stronger radio source is the one showing absorption and is associated with the AGN activity. Hence, the choice of the stronger radio source as the velocity reference is motivated by our main interest of checking for connection of the absorbing gas with the AGN activity. The typical uncertainty in the measurements is 20-30 km s-1. The median is 54 km s-1, with 60% of the components being redshifted ( km s-1). For comparison, the median among low- non-mergers in the sample of Maccagni et al. (2017) is 20 km s-1, with 40% of the absorption being redshifted. Further, if we consider blueshifted and redshifted absorption components to have 100 km s-1 and km s-1, respectively, then 10% of the absorption components in mergers are blueshifted and 30% of them are redshifted. Compared to this, 28% and 9% of the absorption are blueshifted and redshifted, respectively, among the non-mergers (in the sample presented in Maccagni et al., 2017). The fraction of redshifted absorption among merging sources hence appears to be higher by about three times than what is typically found in low- radio sources. Note that in general, studies of intrinsic absorption in radio sources observe excess of blueshifted absorption (e.g. Vermeulen et al., 2003; Gupta et al., 2006).
Further from Fig. 11 (right panel), we see that the absorption components with smaller (15 km s-1, corresponding to (H i) cm-2, for Ts = 100 K and = 1) show a range in (300 to 300 km s-1), while those with larger are usually within 200 km s-1 of the systemic velocity. Similarly, we find that the narrower (FWHM 100 km s-1) absorption components span the whole range of , while the broader ones are centred within 100 km s-1. This implies that the stronger and broader absorption components are likely to be tracing gas rotating in the circumnuclear discs, while the weaker components could be tracing both co-rotating and inflowing/outflowing gas.
Note that the kinematics of the absorbers from Geréb et al. (2015) and Maccagni et al. (2017) are measured by fitting the Busy function, while those of ours and the other absorbers from the literature are measured by fitting Gaussian functions. We have checked that excluding the former measurements does not affect the statistical results regarding the kinematics of the absorbers in mergers as obtained above.

4.4 Radio morphology of the mergers
Among our sample, six of the radio sources are compact in the 1.4 GHz arcsecond-scale continuum maps, while four show resolved emission (see Fig. 1). Out of the 19 mergers in the literature sample, four sources show resolved continuum emission at arcsecond-scales, and the rest are compact (i.e., deconvolved sizes in FIRST images). The merger, NGC 3690/IC 694, consists of three main radio components in the arcsecond-scale 1.4 GHz image, and absorption has been detected towards all of them (Baan & Haschick, 1990). Similarly, absorption has been detected across the complex radio structure extending over 8 kpc in the merger NGC 6240 (Baan et al., 2007). Note that two out of three non-detections in our sample are towards radio sources that have resolved emission at arcsecond-scales, and the radio emission is resolved at sub-arcsecond-scales for the third non-detection (see Section 3.1.9). In case of the two non-detections from the literature, the radio sources are compact at arcsecond-scales, and one of them is also compact in the available 5 GHz sub-arcsecond-scale image (Helmboldt et al., 2007). The non-detections in these two cases do not seem to be directly related to the radio morphology. Note that the radio power at 1.4 GHz of the sources with non-detections (log W Hz-1) is not different compared to that of the sources with detections (log W Hz-1).
Sub-arcsecond-scale spectroscopy is not available for the sources in our sample, except for J13203408 (see Section 3.1.7). The radio continuum emission at 1.4 GHz in this case has an elongated structure over 1 kpc, and absorption is detected against this entire region (Clemens & Alexander, 2004). Sub-arcsecond-scale absorption spectroscopy have been carried out in the case of few mergers from the literature as well. Srianand et al. (2015) have resolved the radio source SDSS J094221.98062335.2 into a compact symmetric object of extent 89 pc and detected absorption towards both the lobes, with the absorption being consistent with arising from a circumnuclear disk. Carilli & Taylor (2000) have studied the 1.4 GHz radio continuum and absorption in Mrk 273 at parsec-scales, and found evidence for a rotating gas disk of diameter 350 pc. Morganti et al. (2004) have found that the radio source in 4C12.50 has a structure extending over 325 pc and the absorption is offset from the nucleus or core by 50 pc, which could be tracing the interstellar medium around the radio source. Mundell et al. (2001) have detected spatially resolved absorption against the extended radio continuum emission in the central 900 pc of Arp 220, and found the extended absorption to be consistent with two counter-rotating disks of neutral hydrogen connected by a bridge. The above studies highlight the importance of sub-arcsecond-scale follow-up spectroscopy of the absorption detected in mergers, and the need to increase such observations, in order to understand the true origin of the absorbing gas in these complex systems.
4.5 Optical properties and AGN activity of the mergers
By definition of our sample (Section 2.1), the galaxies typically show disturbed morphologies and tidal features in the available optical images. In the cases of J11001015, J12142931 and J20540041, no tidal features are visible in the optical images (Fig. 1), but they consist of two very nearby (10 kpc) galaxies/nuclei. Similarly, all the galaxies in the literature sample except three exhibit clear tidal features or disturbed morphology. The remaining three consist of close pairs of galaxies. The galaxies both in our sample and in the literature appear to be star-forming based on the available optical spectra, except for J11081015 which does not show any nebular emission (see Section 3.1.4). Based on SDSS magnitude-dependent colour cut (as defined in Blanton & Berlind, 2007; Weinmann et al., 2006), about 60% of the galaxies undergoing merger are blue and rest are red. Thirteen of the mergers consist of two interacting galaxies that have SDSS photometry available. If we define wet, dry and mixed mergers to comprise of blue-blue, red-red and blue-red galaxies, respectively, then three, four and six among these thirteen would be wet, dry and mixed mergers, respectively. Further, we can define mergers, where individual galaxies cannot be distinguished, as wet or dry based on their colours blue or red, respectively. Then overall, 50%, 27% and 23% of the mergers would be wet, dry and mixed, respectively. We do not find any difference in the optical colours and morphology of the galaxies which host the strong radio sources and those that do not. The presence and strength of the absorption, moreover, does not seem to be related to the optical properties like morphology and colour, and the projected separation between the galaxies.
All the mergers in our sample (except for J11081015; see above) can be classified as AGNs or AGN-starburst composites based on optical nebular emission line ratio diagnostics. The AGN nature is further indicated by the presence of compact strong radio emission in these systems. Similarly, the mergers from the literature are classified optically as AGNs/Composites as well. In most of the cases, the presence of AGNs in the mergers is further confirmed with multi-wavelength (radio, infrared, and X-ray) data. Further, most of the mergers are also classified as LIRGs or ULIRGs (infrared luminosity L⊙ for LIRGs; L⊙ for ULIRGs). This is expected since the strong infrared emission of LIRGs and ULIRGs usually appears to be instigated by interactions (Sanders & Mirabel, 1996). The mergers are dust-rich, with 91% of the mergers which show absorption having WISE colour, , consistent with the results of Chandola & Saikia (2017). Although, the presence of large amount of dust in the central regions of the mergers can obscure the central powering mechanism, i.e the contribution of AGN and starburst is difficult to determine based on optical data. For example, the relative contribution of AGN and starburst to the extreme infrared luminosity of Arp 220 is still a matter of debate (e.g. Martín et al., 2016). However, it is found that the AGN activity in mergers can start before the final coalescence and be present along with the star formation (Ellison et al., 2011). Müller-Sánchez et al. (2018), for example, have observed both AGN-driven and starburst-driven outflows in the dual black hole merger, NGC 6240.
The large amount of neutral gas detected in majority of the mergers (Sections 4.1 and 4.2), and the excess of redshifted absorption, indicated by the velocity shift of the absorbing gas with respect to the emission lines of the radio sources (Section 4.3), could maybe point towards a connection between the neutral gas near the centre of the mergers and the AGN activity of the radio sources. For instance, in the mergers J10360221 and J11001002, the strongest absorption component occurs close to the systemic velocity of the radio source, implying that the absorbing gas could be arising from the circumnuclear disc or torus associated with the AGN. Additionally, we find redshifted (e.g. J10360221) and blueshifted (e.g. J11001002) absorption components among the mergers, which could represent infalling and outflowing gas clumps, respectively. We plan to conduct more in-depth studies of these systems in the future, in order to connect the absorbing gas with the AGN activity of the mergers.
5 Summary
We have presented in this work a search for neutral gas towards radio sources at that are associated with galaxy mergers, in an attempt to understand the connection between the presence of neutral gas in their circumnuclear regions and the radio activity. Using GMRT and VLA observations, we have detected H i 21-cm absorption in seven out of ten merging systems. The absorption are broad ( km s-1) and strong [(H i) cm-2 for Ts = 100 K and = 1]. We have detected and studied the H i 21-cm emission from one of the systems. We have also searched for OH 18-cm absorption towards one of these systems and reported its non-detection. In addition, we have presented SALT long-slit optical spectra of four systems in our sample. In two of these systems, where we were able to carry out spatially resolved optical spectroscopy, we have studied the nebular emission line properties over kpc across the systems. The strongest absorption component in these systems coincides with the peak of the emission from the radio sources.
We have compiled a sample of low- () mergers with radio sources that have been searched for absorption in the literature. Combining this with our sample we obtain the following results:
-
•
The detection rate of absorption in low- radio sources that are part of merging systems is %. This is times higher than the detection rates of intrinsic absorption in samples of low- radio galaxies.
-
•
Mergers account for most of the strong absorption detected in low- radio sources, and the fraction of mergers increases with increasing (H i) cut-off. Approximately 40% of the absorbers with (H i) cm-2 arise from mergers, and 100% of the absorbers with (H i) cm-2 arise from mergers. The distribution of (H i) of the absorption arising from mergers is significantly different from that of non-mergers, with mergers giving rise to six times stronger absorption on average.
-
•
The absorption from mergers tend to be broad and multi-component. The line widths could be affected by the complex gas kinematics in the mergers as well as the complex radio continuum morphology. However, we do not find any significant difference in the FWHM distribution of the absorbers between mergers and non-mergers.
-
•
About 60% and 30% of the absorption components have velocity shift from the systemic velocity of 0 km s-1 and 100 km s-1, respectively. This is 1.5 and 3 times higher, respectively, than what is found for intrinsic absorption in non-interacting low- radio sources. The stronger and broader absorption components among mergers are usually within 100 km s-1 of the systemic velocities.
We have found statistical evidence for the presence of large amount of neutral gas in the central regions of merging galaxies showing
strong radio emission. While the neutral gas could be fueling the AGN activity of these mergers, direct connection of the absorbing gas
with the triggering of the AGN is more challenging to establish. For example, it is not straightforward to interpret the kinematics of
the absorbing gas. The systemic velocities used in the literature and in our sample are estimated using optical nuclear spectra (fibre-spectra
or long-slit spectra) obtained with different spatial resolutions and different wavelength coverage. The absorption data are also not of
uniform spectral resolution, coverage and sensitivity. So all of the available spectra may not be sensitive to detect narrow weak infalling
absorption as seen in the case of SDSS J094221.98062335.2 (Srianand et al., 2015), or shallow highly blueshifted absorption as seen in the
case of Mrk 231 (Morganti et al., 2016). Furthermore, the current absorption spectra provide information about the neutral gas present in the
merging systems along our line of sight to the radio continuum emission. Information about the gas geometry and kinematics from high spatial
resolution ionized and molecular emission line mapping is required to associate the different absorbing components with the emitting regions.
For example, multi-wavelength IFU observations of the merger Mrk 463 presented in Treister
et al. (2018) suggests that while there exists
significant reservoir of molecular gas around the double nuclei, only a small fraction of it is feeding the SMBH. More such studies are
required to understand the relationship between neutral gas in mergers and AGN activity. The systems presented here are ideal for follow-up
observations to investigate in more detail such a connection.
ACKNOWLEDGEMENTS
We thank the anonymous reviewer for useful comments that helped improve the paper.
RD acknowledges support from the Alexander von Humboldt Foundation.
We thank the staff at GMRT, VLA, and SALT for their help during the observations.
GMRT is run by the National Centre for Radio Astrophysics of the Tata Institute of Fundamental Research.
The VLA is run by the National Radio Astronomy Observatory (NRAO).
The NRAO is a facility of the National Science Foundation operated under cooperative agreement by Associated Universities, Inc.
Some of the observations reported in this paper were obtained with the Southern African Large Telescope (SALT).
This research has made use of the NASA/IPAC Extragalactic Database (NED) which is operated by the Jet Propulsion Laboratory, California Institute of Technology, under contract with the National Aeronautics and Space Administration. Based on photographic data obtained using The UK Schmidt Telescope. The UK Schmidt Telescope was operated by the Royal Observatory Edinburgh, with funding from the UK Science and Engineering Research Council, until 1988 June, and thereafter by the Anglo-Australian Observatory. Original plate material is copyright (c) the Royal Observatory Edinburgh and the Anglo-Australian Observatory. The plates were processed into the present compressed digital form with their permission. The Digitized Sky Survey was produced at the Space Telescope Science Institute under US Government grant NAG W-2166. Based on observations made with the NASA/ESA Hubble Space Telescope, obtained from the data archive at the Space Telescope Science Institute. STScI is operated by the Association of Universities for Research in Astronomy, Inc. under NASA contract NAS 5-26555.
Funding for SDSS-III has been provided by the Alfred P. Sloan Foundation, the Participating Institutions, the National Science Foundation, and the U.S. Department of Energy Office of Science. The SDSS-III web site is http://www.sdss3.org/. SDSS-III is managed by the Astrophysical Research Consortium for the Participating Institutions of the SDSS-III Collaboration including the University of Arizona, the Brazilian Participation Group, Brookhaven National Laboratory, Carnegie Mellon University, University of Florida, the French Participation Group, the German Participation Group, Harvard University, the Instituto de Astrofisica de Canarias, the Michigan State/Notre Dame/JINA Participation Group, Johns Hopkins University, Lawrence Berkeley National Laboratory, Max Planck Institute for Astrophysics, Max Planck Institute for Extraterrestrial Physics, New Mexico State University, New York University, Ohio State University, Pennsylvania State University, University of Portsmouth, Princeton University, the Spanish Participation Group, University of Tokyo, University of Utah, Vanderbilt University, University of Virginia, University of Washington, and Yale University.
References
- Aditya et al. (2016) Aditya J. N. H. S., Kanekar N., Kurapati S., 2016, MNRAS, 455, 4000
- Alexander & Hickox (2012) Alexander D. M., Hickox R. C., 2012, New A Rev., 56, 93
- Allison et al. (2012) Allison J. R., et al., 2012, MNRAS, 423, 2601
- Alonso-Herrero et al. (2009) Alonso-Herrero A., García-Marín M., Monreal-Ibero A., Colina L., Arribas S., Alfonso-Garzón J., Labiano A., 2009, A&A, 506, 1541
- Argence & Lamareille (2009) Argence B., Lamareille F., 2009, A&A, 495, 759
- Baan & Haschick (1990) Baan W. A., Haschick A., 1990, ApJ, 364, 65
- Baan et al. (2007) Baan W. A., Hagiwara Y., Hofner P., 2007, ApJ, 661, 173
- Baldwin et al. (1981) Baldwin J. A., Phillips M. M., Terlevich R., 1981, PASP, 93, 5
- Barcos-Muñoz et al. (2017) Barcos-Muñoz L., et al., 2017, ApJ, 843, 117
- Barnes & Hernquist (1996) Barnes J. E., Hernquist L., 1996, ApJ, 471, 115
- Bianchi et al. (2008) Bianchi S., Chiaberge M., Piconcelli E., Guainazzi M., Matt G., 2008, MNRAS, 386, 105
- Bieging & Biermann (1983) Bieging J. H., Biermann P., 1983, AJ, 88, 161
- Blanton & Berlind (2007) Blanton M. R., Berlind A. A., 2007, ApJ, 664, 791
- Bothun & Schommer (1983) Bothun G. D., Schommer R. A., 1983, ApJ, 267, L15
- Cao et al. (2016) Cao C., et al., 2016, ApJS, 222, 16
- Carilli & Taylor (2000) Carilli C. L., Taylor G. B., 2000, ApJ, 532, L95
- Carilli et al. (1998a) Carilli C. L., Wrobel J. M., Ulvestad J. S., 1998a, AJ, 115, 928
- Carilli et al. (1998b) Carilli C. L., Menten K. M., Reid M. J., Rupen M. P., Yun M. S., 1998b, ApJ, 494, 175
- Chambers et al. (1987) Chambers K. C., Miley G. K., van Breugel W., 1987, Nature, 329, 604
- Chandola & Saikia (2017) Chandola Y., Saikia D. J., 2017, MNRAS, 465, 997
- Chandola et al. (2011) Chandola Y., Sirothia S. K., Saikia D. J., 2011, MNRAS, 418, 1787
- Chandola et al. (2012) Chandola Y., Sirothia S. K., Saikia D. J., Gupta N., 2012, Bulletin of the Astronomical Society of India, 40, 139
- Chandola et al. (2013) Chandola Y., Gupta N., Saikia D. J., 2013, MNRAS, 429, 2380
- Cisternas et al. (2011) Cisternas M., et al., 2011, ApJ, 726, 57
- Clemens & Alexander (2004) Clemens M. S., Alexander P., 2004, MNRAS, 350, 66
- Combes et al. (2009) Combes F., et al., 2009, A&A, 503, 73
- Comerford et al. (2015) Comerford J. M., Pooley D., Barrows R. S., Greene J. E., Zakamska N. L., Madejski G. M., Cooper M. C., 2015, ApJ, 806, 219
- Condon et al. (1998) Condon J. J., Cotton W. D., Greisen E. W., Yin Q. F., Perley R. A., Taylor G. B., Broderick J. J., 1998, AJ, 115, 1693
- Cortijo-Ferrero et al. (2017) Cortijo-Ferrero C., et al., 2017, MNRAS, 467, 3898
- Courtois et al. (2011) Courtois H. M., Tully R. B., Makarov D. I., Mitronova S., Koribalski B., Karachentsev I. D., Fisher J. R., 2011, MNRAS, 414, 2005
- Cox et al. (2004) Cox T. J., Primack J., Jonsson P., Somerville R. S., 2004, ApJ, 607, L87
- Cox et al. (2008) Cox T. J., Jonsson P., Somerville R. S., Primack J. R., Dekel A., 2008, MNRAS, 384, 386
- Crawford et al. (2010) Crawford S. M., et al., 2010, in Observatory Operations: Strategies, Processes, and Systems III. p. 773725, doi:10.1117/12.857000
- Croton et al. (2006) Croton D. J., et al., 2006, MNRAS, 365, 11
- Darling & Giovanelli (2000) Darling J., Giovanelli R., 2000, AJ, 119, 3003
- Darling et al. (2011) Darling J., Macdonald E. P., Haynes M. P., Giovanelli R., 2011, ApJ, 742, 60
- Dickey (1986) Dickey J. M., 1986, ApJ, 300, 190
- Dutta et al. (2016) Dutta R., Gupta N., Srianand R., O’Meara J. M., 2016, MNRAS, 456, 4209
- Dutta et al. (2017a) Dutta R., Srianand R., Gupta N., Momjian E., Noterdaeme P., Petitjean P., Rahmani H., 2017a, MNRAS, 465, 588
- Dutta et al. (2017b) Dutta R., Srianand R., Gupta N., Joshi R., Petitjean P., Noterdaeme P., Ge J., Krogager J.-K., 2017b, MNRAS, 465, 4249
- Ellison et al. (2008) Ellison S. L., Patton D. R., Simard L., McConnachie A. W., 2008, AJ, 135, 1877
- Ellison et al. (2011) Ellison S. L., Patton D. R., Mendel J. T., Scudder J. M., 2011, MNRAS, 418, 2043
- Ellison et al. (2013) Ellison S. L., Mendel J. T., Patton D. R., Scudder J. M., 2013, MNRAS, 435, 3627
- Ellison et al. (2015) Ellison S. L., Fertig D., Rosenberg J. L., Nair P., Simard L., Torrey P., Patton D. R., 2015, MNRAS, 448, 221
- Fathi et al. (2013) Fathi K., et al., 2013, ApJ, 770, L27
- Ferrarese & Merritt (2000) Ferrarese L., Merritt D., 2000, ApJ, 539, L9
- Fu et al. (2011) Fu H., Myers A. D., Djorgovski S. G., Yan L., 2011, ApJ, 733, 103
- Gaibler et al. (2012) Gaibler V., Khochfar S., Krause M., Silk J., 2012, MNRAS, 425, 438
- Gallimore et al. (1999) Gallimore J. F., Baum S. A., O’Dea C. P., Pedlar A., Brinks E., 1999, ApJ, 524, 684
- Gebhardt et al. (2000) Gebhardt K., et al., 2000, ApJ, 539, L13
- Geréb et al. (2015) Geréb K., Maccagni F. M., Morganti R., Oosterloo T. A., 2015, A&A, 575, A44
- Greene et al. (2009) Greene J. E., Zakamska N. L., Liu X., Barth A. J., Ho L. C., 2009, ApJ, 702, 441
- Greene et al. (2012) Greene J. E., Zakamska N. L., Smith P. S., 2012, ApJ, 746, 86
- Gupta et al. (2006) Gupta N., Salter C. J., Saikia D. J., Ghosh T., Jeyakumar S., 2006, MNRAS, 373, 972
- Gupta et al. (2016) Gupta N., et al., 2016, in Proceedings of MeerKAT Science: On the Pathway to the SKA. 25-27 May, 2016 Stellenbosch, South Africa (MeerKAT2016). p. 14 (arXiv:1708.07371)
- Hani et al. (2018) Hani M. H., Sparre M., Ellison S. L., Torrey P., Vogelsberger M., 2018, MNRAS, 475, 1160
- Healey et al. (2007) Healey S. E., Romani R. W., Taylor G. B., Sadler E. M., Ricci R., Murphy T., Ulvestad J. S., Winn J. N., 2007, ApJS, 171, 61
- Heckman et al. (1983) Heckman T. M., Balick B., van Breugel W. J. W., Miley G. K., 1983, AJ, 88, 583
- Helmboldt et al. (2007) Helmboldt J. F., et al., 2007, ApJ, 658, 203
- Henkel et al. (1986) Henkel C., Gusten R., Baan W. A., 1986, in Bulletin of the American Astronomical Society. p. 689
- Hopkins et al. (2006) Hopkins P. F., Hernquist L., Cox T. J., Di Matteo T., Robertson B., Springel V., 2006, ApJS, 163, 1
- Hopkins et al. (2008) Hopkins P. F., Hernquist L., Cox T. J., Kereš D., 2008, ApJS, 175, 356
- Huchtmeier & Richter (1989) Huchtmeier W. K., Richter O.-G., 1989, A General Catalog of HI Observations of Galaxies. The Reference Catalog.
- Israel et al. (2015) Israel F. P., Rosenberg M. J. F., van der Werf P., 2015, A&A, 578, A95
- Kauffmann et al. (2003) Kauffmann G., et al., 2003, MNRAS, 346, 1055
- Kazes & Dickey (1985) Kazes I., Dickey J. M., 1985, A&A, 152, L9
- Kennicutt (1998) Kennicutt Jr. R. C., 1998, ApJ, 498, 541
- Kewley et al. (2001) Kewley L. J., Dopita M. A., Sutherland R. S., Heisler C. A., Trevena J., 2001, ApJ, 556, 121
- Kewley et al. (2006) Kewley L. J., Geller M. J., Barton E. J., 2006, AJ, 131, 2004
- Khabiboulline et al. (2014) Khabiboulline E. T., Steinhardt C. L., Silverman J. D., Ellison S. L., Mendel J. T., Patton D. R., 2014, ApJ, 795, 62
- Kilerci Eser et al. (2014) Kilerci Eser E., Goto T., Doi Y., 2014, ApJ, 797, 54
- Kim et al. (2013) Kim D.-C., et al., 2013, ApJ, 768, 102
- Kukula et al. (1999) Kukula M. J., Ghosh T., Pedlar A., Schilizzi R. T., 1999, ApJ, 518, 117
- Leech et al. (2010) Leech J., Isaak K. G., Papadopoulos P. P., Gao Y., Davis G. R., 2010, MNRAS, 406, 1364
- Liszt & Lucas (1996) Liszt H., Lucas R., 1996, A&A, 314, 917
- Liu et al. (2010) Liu X., Shen Y., Strauss M. A., Greene J. E., 2010, ApJ, 708, 427
- Maccagni et al. (2017) Maccagni F. M., Morganti R., Oosterloo T. A., Geréb K., Maddox N., 2017, A&A, 604, A43
- Maccagni et al. (2018) Maccagni F. M., Morganti R., Oosterloo T. A., Oonk J. B. R., Emonts B. H. C., 2018, A&A, 614, A42
- Maiolino et al. (2017) Maiolino R., et al., 2017, Nature, 544, 202
- Martín et al. (2016) Martín S., et al., 2016, A&A, 590, A25
- Mazzarella et al. (1991) Mazzarella J. M., Soifer B. T., Graham J. R., Neugebauer G., Matthews K., Gaume R. A., 1991, AJ, 102, 1241
- Mihos & Hernquist (1996) Mihos J. C., Hernquist L., 1996, ApJ, 464, 641
- Moran et al. (1992) Moran E. C., Halpern J. P., Bothun G. D., Becker R. H., 1992, AJ, 104, 990
- Moreno et al. (2015) Moreno J., Torrey P., Ellison S. L., Patton D. R., Bluck A. F. L., Bansal G., Hernquist L., 2015, MNRAS, 448, 1107
- Morganti et al. (2001) Morganti R., Oosterloo T. A., Tadhunter C. N., van Moorsel G., Killeen N., Wills K. A., 2001, MNRAS, 323, 331
- Morganti et al. (2004) Morganti R., Oosterloo T. A., Tadhunter C. N., Vermeulen R., Pihlström Y. M., van Moorsel G., Wills K. A., 2004, A&A, 424, 119
- Morganti et al. (2009) Morganti R., Peck A. B., Oosterloo T. A., van Moorsel G., Capetti A., Fanti R., Parma P., de Ruiter H. R., 2009, A&A, 505, 559
- Morganti et al. (2015) Morganti R., Sadler E. M., Curran S., 2015, Advancing Astrophysics with the Square Kilometre Array (AASKA14), p. 134
- Morganti et al. (2016) Morganti R., Veilleux S., Oosterloo T., Teng S. H., Rupke D., 2016, A&A, 593, A30
- Mortazavi & Lotz (2018) Mortazavi S. A., Lotz J. M., 2018, preprint, (arXiv:1801.03981)
- Müller-Sánchez et al. (2018) Müller-Sánchez F., Nevin R., Comerford J. M., Davies R. I., Privon G. C., Treister E., 2018, Nature, 556, 345
- Mundell et al. (2001) Mundell C. G., Ferruit P., Pedlar A., 2001, ApJ, 560, 168
- Osterbrock & Ferland (2006) Osterbrock D. E., Ferland G. J., 2006, Astrophysics of gaseous nebulae and active galactic nuclei
- Pearson et al. (2016) Pearson C., et al., 2016, ApJS, 227, 9
- Peck et al. (2000) Peck A. B., Taylor G. B., Fassnacht C. D., Readhead A. C. S., Vermeulen R. C., 2000, ApJ, 534, 104
- Pettini & Pagel (2004) Pettini M., Pagel B. E. J., 2004, MNRAS, 348, L59
- Ramos Almeida et al. (2012) Ramos Almeida C., et al., 2012, MNRAS, 419, 687
- Richter & Huchtmeier (1987) Richter O.-G., Huchtmeier W. K., 1987, A&AS, 68, 427
- Romero-Cañizales et al. (2017) Romero-Cañizales C., et al., 2017, MNRAS, 467, 2504
- Samui et al. (2007) Samui S., Srianand R., Subramanian K., 2007, MNRAS, 377, 285
- Sanders & Mirabel (1996) Sanders D. B., Mirabel I. F., 1996, ARA&A, 34, 749
- Sanders et al. (2003) Sanders D. B., Mazzarella J. M., Kim D.-C., Surace J. A., Soifer B. T., 2003, AJ, 126, 1607
- Satyapal et al. (2014) Satyapal S., Ellison S. L., McAlpine W., Hickox R. C., Patton D. R., Mendel J. T., 2014, MNRAS, 441, 1297
- Satyapal et al. (2017) Satyapal S., et al., 2017, ApJ, 848, 126
- Schawinski et al. (2006) Schawinski K., et al., 2006, Nature, 442, 888
- Schmitt (2001) Schmitt H. R., 2001, AJ, 122, 2243
- Scott & Kaviraj (2014) Scott C., Kaviraj S., 2014, MNRAS, 437, 2137
- Scudder et al. (2012) Scudder J. M., Ellison S. L., Torrey P., Patton D. R., Mendel J. T., 2012, MNRAS, 426, 549
- Secrest et al. (2017) Secrest N. J., Schmitt H. R., Blecha L., Rothberg B., Fischer J., 2017, ApJ, 836, 183
- Soto & Martin (2012) Soto K. T., Martin C. L., 2012, ApJS, 203, 3
- Springel et al. (2005) Springel V., Di Matteo T., Hernquist L., 2005, MNRAS, 361, 776
- Srianand et al. (2015) Srianand R., Gupta N., Momjian E., Vivek M., 2015, MNRAS, 451, 917
- Staveley-Smith et al. (1987) Staveley-Smith L., Cohen R. J., Chapman J. M., Pointon L., Unger S. W., 1987, MNRAS, 226, 689
- Strauss et al. (1992) Strauss M. A., Huchra J. P., Davis M., Yahil A., Fisher K. B., Tonry J., 1992, ApJS, 83, 29
- Sun et al. (2014) Sun A.-L., Greene J. E., Zakamska N. L., Nesvadba N. P. H., 2014, ApJ, 790, 160
- Tadhunter et al. (2012) Tadhunter C. N., Ramos Almeida C., Morganti R., Holt J., Rose M., Dicken D., Inskip K., 2012, MNRAS, 427, 1603
- Toomre & Toomre (1972) Toomre A., Toomre J., 1972, ApJ, 178, 623
- Treister et al. (2012) Treister E., Schawinski K., Urry C. M., Simmons B. D., 2012, ApJ, 758, L39
- Treister et al. (2018) Treister E., et al., 2018, ApJ, 854, 83
- Tremblay et al. (2016) Tremblay G. R., et al., 2016, Nature, 534, 218
- Vermeulen et al. (2003) Vermeulen R. C., et al., 2003, A&A, 404, 861
- Villar-Martín et al. (2012) Villar-Martín M., Cabrera Lavers A., Bessiere P., Tadhunter C., Rose M., de Breuck C., 2012, MNRAS, 423, 80
- Villforth et al. (2014) Villforth C., et al., 2014, MNRAS, 439, 3342
- Weinmann et al. (2006) Weinmann S. M., van den Bosch F. C., Yang X., Mo H. J., 2006, MNRAS, 366, 2
- Weston et al. (2017) Weston M. E., McIntosh D. H., Brodwin M., Mann J., Cooper A., McConnell A., Nielsen J. L., 2017, MNRAS, 464, 3882
- White & Rees (1978) White S. D. M., Rees M. J., 1978, MNRAS, 183, 341
- White et al. (1997) White R. L., Becker R. H., Helfand D. J., Gregg M. D., 1997, ApJ, 475, 479
- Wild et al. (2007) Wild V., Kauffmann G., Heckman T., Charlot S., Lemson G., Brinchmann J., Reichard T., Pasquali A., 2007, MNRAS, 381, 543
- Williams & Brown (1983) Williams B. A., Brown R. L., 1983, AJ, 88, 1749
- Wright et al. (2010) Wright E. L., et al., 2010, AJ, 140, 1868
- York et al. (2000) York D. G., et al., 2000, AJ, 120, 1579
- van Gorkom et al. (1989) van Gorkom J. H., Knapp G. R., Ekers R. D., Ekers D. D., Laing R. A., Polk K. S., 1989, AJ, 97, 708