Cosmological simulations of dwarfs: the need for ISM physics beyond SN feedback alone
Abstract
The dominant feedback mechanism in low mass haloes is usually assumed to take the form of massive stars exploding as supernovae (SNe). We perform very high resolution cosmological zoom-in simulations of five dwarf galaxies to with our mechanical SN feedback model. This delivers the correct amount of momentum corresponding to the stage of the SN remnant evolution resolved, and has been shown to lead to realistic dwarf properties in isolated simulations. We find that in 4 out of our 5 simulated cosmological dwarfs, SN feedback has insufficient impact resulting in excessive stellar masses, extremely compact sizes and central super-solar stellar metallicities. The failure of the SN feedback in our dwarfs is physical in nature within our model and is the result of the build up of very dense gas in the early universe due to mergers and cosmic inflows prior to the first SN occurring. We demonstrate that our results are insensitive to resolution (provided that it is high enough), details of the (spatially uniform) UV background and reasonable alterations within our star formation prescription. We therefore conclude that the ability of SNe to regulate dwarf galaxy properties is dependent on other physical processes, such as turbulent pressure support, clustering and runaway of SN progenitors and other sources of stellar feedback.
keywords:
galaxies: formation, galaxies: evolution, galaxies: dwarf, methods: numerical1 Introduction
While they may be the least massive and luminous systems in our universe, understanding the origin of dwarf galaxy properties represents a key step in developing and testing theories of galaxy formation and cosmology. From the perspective of cosmology, abundances and structural properties of low mass haloes present an important observational test of the CDM model, but the effects of baryonic physics (to which dwarfs are highly susceptible because of their small potential wells) can make it difficult to make robust predictions. Meanwhile, from the point of view of galaxy formation, these ‘messy’ baryonic processes are interesting in their own right, as well as providing insight into the reionization history of the universe and the enrichment of the intergalactic medium (IGM) with metals.
Examining the issue of dwarf abundances, there is a substantial offset between the predicted dark matter halo abundance from numerical simulations and the observed galaxy stellar mass function (for recent work see e.g. Behroozi et al. 2013; Moster et al. 2018), indicating that dwarfs must be more than an order of magnitude less efficient at forming stars than Milky Way-sized haloes. This is also posited as a solution to the so called ‘missing satellites problem’, where the observed number of Local Group satellites is at odds with the substantially larger number of dark matter haloes predicted by cosmological N-body simulations (see e.g. Moore et al. 1999; Klypin et al. 1999; Diemand et al. 2008; Springel et al. 2008; Koposov et al. 2009; Rashkov et al. 2012; Sawala et al. 2016).
It has been suggested for some time that low mass haloes should have their star formation efficiency suppressed by two primary processes: SN feedback (e.g. Larson 1974; Dekel & Silk 1986; Mori et al. 2002; Governato et al. 2007) and cosmic reionization (e.g. Efstathiou 1992; Bullock et al. 2000; Dijkstra et al. 2004; Kravtsov et al. 2004; Madau et al. 2008). Evidence that these structures do in fact exist but are relatively dark has been bolstered recently by detections of local ultra-faint dwarfs (e.g. Koposov et al. 2015; Laevens et al. 2015; Martin et al. 2015; Kim et al. 2015).
As well as influencing abundances of low mass haloes, baryonic physics has also been invoked to solve structural discrepancies between dark matter simulations and observations. One such discrepancy is often termed the ‘cusp-core controversy’. Within the CDM paradigm, dark matter-only simulations systematically predict steep inner density profiles for these low mass haloes, but some observations suggest that they may instead contain low density cores (see e.g. Moore 1994; Flores & Primack 1994; de Blok & Bosma 2002; Walker & Peñarrubia 2011). While SN feedback has been widely invoked in hydrodynamical simulations in an attempt to generate cored density profiles, there is still no consensus in the literature as some groups find only cuspy profiles (e.g. Vogelsberger et al. 2014; Sawala et al. 2016), while others find various levels of cored profiles with different trends as a function of halo mass or redshift (e.g. Navarro et al. 1996; Gnedin & Zhao 2002; Read & Gilmore 2005; Mashchenko et al. 2008; Governato et al. 2010; Pontzen & Governato 2012; Di Cintio et al. 2014; Oñorbe et al. 2015; Fitts et al. 2017). The level of success in transforming dark matter cusps into cores seems closely related to the degree of burstiness of SN feedback, which could also affect the mass-loading of galactic outflows and the early enrichment of the IGM.
It is perhaps at some level unsurprising that the properties of simulated dwarfs predicted by different groups are at variance as very different sub-grid models for star formation, SN feedback and wind launching are adopted, in addition to results often being rather sensitive to the numerical resolution of the simulations. This is however clearly unsatisfactory if we are to understand at a more fundamental level how SN feedback operates in dwarf galaxies, and even more so if we are to derive robust constraints on the nature of dark matter, using observed dwarfs as near-field cosmology probes.
Recently, based on analytical calculations or small scale simulations of individual SN explosions, there have been several theoretical works (e.g. Hopkins et al. 2014; Kimm & Cen 2014; Iffrig & Hennebelle 2015; Martizzi et al. 2015; Kim & Ostriker 2015; Walch & Naab 2015, but see also earlier work by Cioffi et al. 1988; Thornton et al. 1998) aiming at quantifying the correct momentum injection at a given SN remnant stage, as a function of local ISM properties, such as the gas density, metallicity and porosity. These studies are particularly useful as they in principle allow the imparting of the appropriate momentum into the ISM, even when the Sedov-Taylor phase of the SN remnant evolution is not properly resolved (often the case in galaxy formation simulations), without the use of tunable parameters (although they usually make certain assumptions such as a uniform ambient medium). We have trialled this type of SN injection, often dubbed ‘mechanical feedback’, in an extensive series of simulations of isolated dwarf galaxies (Smith et al. 2018), finding that it results in realistic and well converged star formation rates and morphologies over two orders of magnitude in mass resolution. However, to naturally produce mass-loaded, multi-phase outflows gas mass resolution needed to be of order of few tens of at least.
Thankfully, even though these resolution requirements are quite daunting, they are achievable in full cosmological simulations provided that one dwarf is simulated at a time with a zoom-in technique. Hence, the aim of this work is to examine the mechanical SN feedback scheme in fully self-consistently formed dwarfs without tuning any parameters to understand if it leads to realistic dwarf properties once the cosmological gas inflows and mergers are taken into account. We explore this by randomly selecting five dwarfs with virial masses between at which reside in different environments and have different assembly histories.
2 Methodology
Our numerical scheme is essentially the same as that described in Smith et al. (2018), but we summarise the salient details here. We carry out our simulations with the moving-mesh code Arepo (Springel 2010) which solves hydrodynamics on an unstructured Voronoi mesh. Gravity is included using a hybrid TreePM scheme.
In this work, we include radiative cooling as in Vogelsberger et al. (2013). Primordial heating and cooling rates are calculated using cooling, recombination and collisional rates provided by Cen (1992) and Katz et al. (1996). Metal-line cooling to 10 K is obtained from lookup tables containing rates precalculated from the photoionization code Cloudy. We include a redshift dependent, but spatially homogeneous UV background from Faucher-Giguère et al. (2009), although it is only turned on from to approximate the latest Planck measurement of optical depth to reionization (Planck Collaboration et al. 2016)111However, we have performed extra simulations where the UV background follows Faucher-Giguère et al. (2009) exactly (switching on at ) and find that it does not change our results in any appreciable way.. We adopt the density based self-shielding prescription of Rahmati et al. (2013) to attenuate the UV background in dense gas.
We include a non-thermal pressure floor to prevent artificial fragmentation in the event of under-resolving the Jeans length (see e.g. Truelove et al. 1997). To ensure that the Jeans length is resolved by cells, this takes the form
| (1) |
where is the cell diameter, is the gas density and is the adiabatic index. We adopt in this work. A detailed discussion of the effects of adopting a pressure floor can be found in Smith et al. (2018) (see also Section 4.2).
Gas above a density threshold of is assigned a star formation rate density according to a simple Schmidt law,
| (2) |
where is the gas density, is some efficiency and is the free-fall time. We use a fiducial value of and (chosen to match observed efficiencies in dense gas, see e.g. Krumholz & Tan 2007, and references therein). We also examine the effect of varying these parameters in Section 4.2. Using these rates, gas cells are then stochastically converted into star particles (collisionless particles representing single stellar populations). Star particles inherit the metallicity of the gas from which they were formed.
For each star particle, we obtain a SN rate, , as a function of age and metallicity precalculated using Starburst99 (Leitherer et al. 1999) assuming a Kroupa (2002) IMF. The number of SNe that occur in a timestep is then drawn from a Poisson distribution with a mean of , where is the timestep. In order to individually time resolve SNe, we impose a timestep limiter for star particles to ensure that .
When a SN occurs, mass, metals, energy and momentum are coupled to the gas cell containing the star particle (the host cell) and its neighbours (all those that share a face with the host cell). Feedback quantities are distributed to the gas cells using an explicitly isotropic weighting scheme in the rest frame of the star particle (details in Smith et al. 2018, see also Hopkins et al. 2018b) in order to avoid spurious numerical effects that can arise when using a simple kernel (mass) weighted approach to nearest neighbours due to the increased relative number of resolution elements present in dense gas. The ejecta mass, , deposited per SN is , of which is in metals, with an energy of . In simulations designated ‘no feedback’, mass and metals are returned, but no feedback energy/momentum is deposited. In runs with full SN feedback, we adopt the mechanical feedback scheme described in Smith et al. (2018) (see also Hopkins et al. 2014, 2018a, 2018b; Kimm & Cen 2014; Kimm et al. 2015; Martizzi et al. 2015). This aims to deposit the correct amount of momentum corresponding to the stage of the SN remnant evolution resolved (dependent on the local gas density and metallicity).
When analysing simulations, we use the halo finder Subfind (Springel et al. 2001; Dolag et al. 2009) to calculate halo properties. We adopt the convention of considering friends-of-friends (FOF) groups as the primary dark matter halo and subhaloes as galaxies within the halo (unless otherwise stated, we only consider centrals). For halo virial masses, we use the definition of Bryan & Norman (1998) and for galaxy stellar masses we use the mass contained within twice the radius that contains half the total subhalo stellar mass associated with the group. We use the code Sublink (Rodriguez-Gomez et al. 2015) to construct merger trees and track haloes/subhaloes throughout the simulations. We follow the branch of the merger tree with the most mass behind it for our analysis except where otherwise mentioned. We adopt a Planck Collaboration et al. (2016) cosmology throughout this work. Unless otherwise stated, all units are in proper coordinates.

3 Simulations
3.1 Initial conditions and simulation details
The process for creating cosmological ‘zoom-in’ initial conditions is as follows. First, a coarse resolution dark matter only simulation of a large, periodic cosmological volume is run to a target redshift, . Dark matter haloes of interest are identified in the output of this simulation and are resimulated at a higher resolution with a ‘zoom-in’ technique. Gas is then added to the initial conditions by splitting the particles into dark matter and gas mesh generating points according to the cosmic baryon fraction (although we also carry out dark matter only zoom-in simulations).
We use the code MUSIC (Hahn & Abel 2011) to generate the initial conditions (at ) for both the coarse and zoom-in simulations. Dwarfs 1 and 2 are selected at from coarse boxes with a resolution of particles (giving a particle mass of ). In the coarse simulation, their virial masses at are and with virial radii of 62.0 kpc and 64.5 kpc, respectively. The selection regions at are a sphere of radius 736 kpc for dwarf 1 and a sphere of radius 295 kpc for dwarf 2. However, for the purposes of this work, we carry out our analysis up until , at which point their masses are and , and they have virial radii of 9.20 kpc and 9.47 kpc (note that in the zoom-in simulations, the final mass and radius varies due to the effects of baryonic physics and the higher resolution).
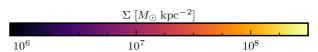
Dwarfs 3, 4 and 5 are selected at from a box with a resolution of particles (i.e. the same mass resolution as the boxes used for dwarfs 1 and 2). The masses of dwarfs 3 and 4 at are and with virial radii of 8.86 kpc and 8.78 kpc. The selection regions at are spheres of radius 44.1 kpc. In the coarse simulation, we identify a fifth halo with a virial mass of and a virial radius of 13.96 kpc, which we resimulate with a zoom-in region of 88.3 kpc. In the subsequent zoom-in simulation, this region actually contains two separate haloes of , sufficiently separated as to be considered independent. We take the larger of these two haloes to be the focus of our analysis, referring to it as dwarf 5. Fig. 1 shows dark matter density projections of the large scale region around the target haloes in the coarse simulations at . Dwarfs 1, 2 and 3 are in relatively low density environments, 4 is in a more crowded filament region, while 5 is a larger system in a very crowded filament.
Our fiducial simulations increase the number of resolution elements in the zoom-in region by a factor of giving dark matter particle and target gas cell masses of and , respectively. We also run simulations of dwarf 1 with a higher resolutions of and gas cell mass for the purposes of testing convergence. The refinement/derefinement scheme in Arepo keeps gas cell masses within a factor of 2 of the target mass. Because star particles are formed by converting gas cells, this also corresponds to the initial star particle mass (prior to mass loss from feedback). We use comoving gravitational softenings of 0.129 ckpc for the high resolution dark matter particles, gas cells222For gas cells, the softening is calculated as the maximum of either this fixed softening value or 2.5 times the cell radius. and star particles. For dwarfs 3, 4 and 5 the softening is held at its proper length of 18.4 pc from that redshift onwards, although this makes very little practical difference. Because our simulations do not include the necessary physics (such as molecular cooling) to resolve Population III stars and the first enrichment of the ISM, we impose a metallicity floor of 333Our choice is motivated by the critical metallicity for fragmentation such that a Population II cluster can be formed (see e.g. Schneider et al. 2012). This choice is somewhat arbitrary, but we find that increasing the floor value by an order of magnitude has negligible impact on our results. In practice, our haloes are rapidly enriched above the floor value.. For each dwarf, we carry out a simulation to with no feedback and with SNe (due to computational expense, we run the no feedback dwarf 5 simulation to ). Section 4 contains details of additional simulations of dwarf 1 carried out with various modifications to our fiducial parameters to test convergence.
3.2 Results
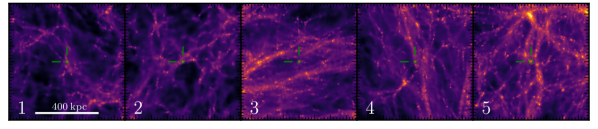
Fig. 2 shows density projections of the dark matter, gas and stars for our simulated dwarfs at (dwarf 5 is shown at to allow comparison between the runs with and without feedback). A variety of morphologies are present. Runs without feedback tend to produce highly compact gas and stellar discs. Recent mergers can give rise to warped structures, for example in dwarfs 1 and 4. With feedback, dwarfs 1, 2 and 5 also feature compact stellar discs similar to the no feedback simulations, although their orientation has changed. The gas morphology is more obviously changed, with more irregular and diffuse structure. In dwarfs 3 and 4, feedback has made a significant impact on the stellar structure, with significantly lower surface densities and the absence of a well defined disc. In dwarf 3, most of the gas been cleared away, leaving a small dense core, while the feedback has almost completely evacuated the gas from dwarf 4.
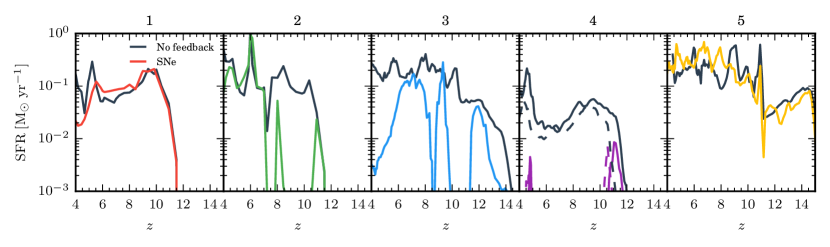
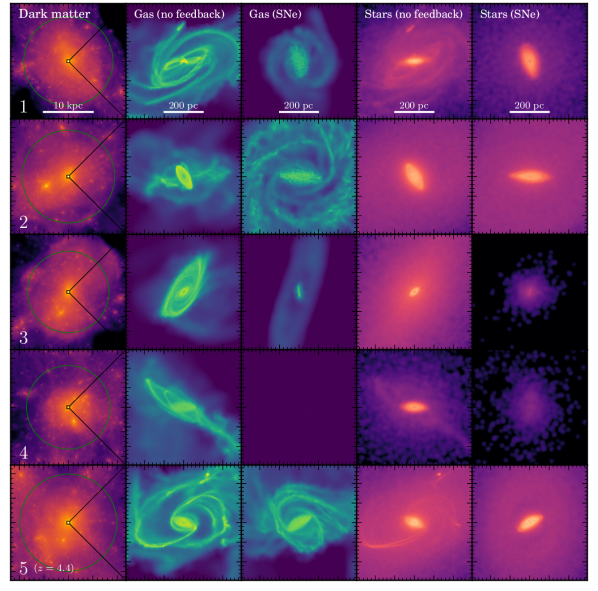
Fig. 3 shows the stellar mass to halo mass ratio of the central galaxies formed in the simulations, normalised by the cosmic baryon fraction, as a function of halo mass, for 4 redshifts (, 8, 6, 4). We also plot empirically derived abundance matching results from Behroozi et al. (2013) and Moster et al. (2018) for comparison, although we have heavily extrapolated the results to reach this mass range so they should be treated with caution. However, even with this caveat in mind, it can be seen that the majority of our simulated galaxies massively overproduce stars, lying several orders of magnitude above the abundance matching relations at all four redshifts. This is true for all simulations without SNe, where typically of the available baryons (taking that to be ) have been converted into stars, with variation of only a factor of a few between . With feedback, there are mixed results. Dwarf 1 produces almost identical stellar to halo mass ratios with and without feedback at all redshifts, with only marginal suppression of star formation by . Similarly, in dwarf 5 feedback has little impact on the evolution of stellar mass. For dwarf 2, at , the ratio is about an order of magnitude lower in the run with feedback than without (although still somewhat high). However, the ratio increases with decreasing redshift and by the difference is slight. Dwarf 3 has a similar behaviour to dwarf 2, except its ratio drops relative to the no feedback simulation, eventually lying a factor of a few lower.
Dwarf 4 is the only case where there is a dramatic suppression of star formation by feedback. This object has a major merger (with a ratio ) around , so we treat the two progenitor haloes separately prior to their merger. Without feedback, both progenitor haloes have similar stellar to halo mass ratios to the other dwarfs, although they are individually of lower mass. With the inclusion of SN feedback, the ratio is dropped by approximately an order of magnitude at and this offset increases with time. By , the progenitor haloes have merged according to the halo finder, although the central galaxies of the progenitors have not yet merged. For consistency, we now calculate the stellar to halo mass ratio for the final halo by considering the stellar mass of both of these galaxies. The ratio is now a factor of lower than the simulation without feedback and is close to the abundance matching relations (bearing in mind their uncertainties at this mass). The reason for the increased effectiveness of the feedback in this case would appear to be that this object has evolved for most of its history as two independent systems that are less massive at a given redshift than the other simulated dwarfs, the shallower potential well increasing the relative efficiency of the SNe to clear gas. This suggests that haloes in this mass range are very sensitive to the manner of their assembly.
Having discussed the integrated efficiency of star formation, we now consider the star formation histories of our dwarfs shown in Fig. 4. For dwarf 4, we plot results for both central galaxies as in Fig. 3. For dwarf 1, the SFRs are essentially the same in the runs with and without SNe. Star formation starts at around and rapidly climbs to by . This rapid rise in star formation coincides with a merger at . The SFRs remain around this level until in the no feedback run, apart from a merger-driven increase at . The results of this merger are apparent in the highly disrupted gas and disc structure visible in Fig. 2. With SNe, the brief increase in SFR is arrested by the feedback and dropped well below the no feedback rates. This burst of feedback is responsible for the more diffuse gas apparent in Fig. 2. The ability of the feedback to be effective during the later merger but not during the first merger is due to the amount of gas available. The subhalo gas fraction (relative to the total mass) at is approximately a quarter of that at .
In contrast to dwarf 1, SNe are able to suppress the SFR significantly in dwarf 2 above . Without feedback, the SFR rises in a similar manner to dwarf 1, although not as rapidly. However, SNe are able to restrict star formation to a brief burst at around and another at . It would appear that the calmer environment (i.e. no major merger), relative to dwarf 1, at the onset of star formation allows the SNe to be effective. Dwarf 2 experiences a gas rich merger around that leads to a large spike in SFR in both no feedback and feedback runs and the rapid build up of gas overwhelming the feedback. Following this event, the SFR remains high in both runs, leading to the similar (high) stellar mass to halo mass ratio at . A burst of efficient feedback around leads to a slight drop in SFR relative to the no feedback simulations, the results of which can be seen in the gas morphology in Fig. 2.
In dwarf 3, without feedback, the SFR rises slowly from , before becoming reasonably steady at a few from onwards. This dwarf experiences no mergers of consequence, growing more slowly than dwarfs 1 and 2, probably as a result of being in a less dense environment. Once SNe are included, SNe are able to suppress star formation, but only following extended bursts of high SFRs. The feedback episodes are able to remove gas from the centre of the halo (giving rise to the morphology seen in Fig. 2) and the lower final stellar mass. However, a sufficiently large mass of stars is formed in the bursts such that the galaxy still lies several orders of magnitude above the (extrapolated) abundance matching relations.
As mentioned previously, despite ending up with a halo mass similar to the other dwarfs simulated, dwarf 4 spends most of its history as two lower mass systems prior to a late major merger. Correspondingly, in the runs without feedback, the progenitors have lower SFRs than the other dwarfs, although this results in similar stellar to halo mass ratios (see Fig. 3). Peaking at by , the SFR of both galaxies evolves in a similar fashion. There is a slight drop in SFR after . The two haloes merge around leading to a rapid increase in star formation. Like dwarfs 2 and 3, with the addition of feedback, the initial onset of star formation is limited to a short burst. However, the system is even more efficiently cleared of gas, resulting in a complete lack of star formation until the merger occurs. Unlike the no feedback case, this merger is relatively dry so the merger-triggered star formation burst is severely curtailed.
Dwarf 5 starts forming stars at , rising to high SFR after . A large amount of variability can be seen, mainly corresponding to mergers. Feedback has very little impact on the SFR in an averaged sense, although it impacts the gas near the very centre of the halo enough to cause variations relative to the no feedback simulation.
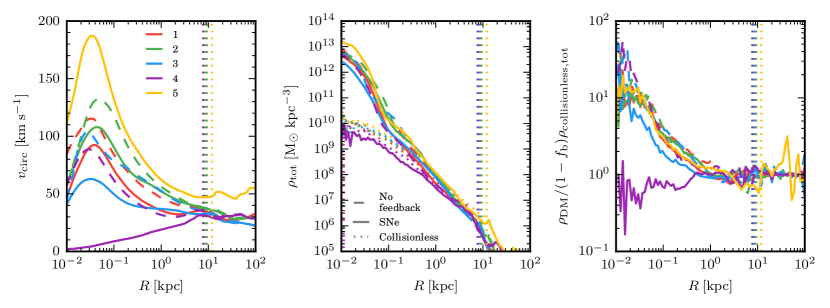
Fig. 5 shows circular velocity profiles, total density profiles and the ratio of dark matter density in simulations with baryonic physics compared to collisionless (i.e. dark matter only) simulations at . It can be seen that on the whole, the simulations give rise to extremely concentrated mass distributions. The circular velocity profiles are strongly peaked at very small radii (10s of parsecs), in some cases . The inclusion of SNe reduces the magnitudes of the peaks by a factor of a few. Dwarf 4, which has managed to significantly suppress star formation (as seen in Figs. 3 and 4), is unique in preventing a peaked circular velocity profile. Instead, a gently rising profile reaches its peak value near the virial radius where it converges with the no feedback profile.
The centrally concentrated mass distribution that gives rise to these strongly peaked circular velocity profiles can be seen in the central panel of Fig. 5 in the form of radial profiles of total density (i.e. dark matter, gas and stars). Also plotted are profiles from collisionless simulations (dotted lines). These latter profiles are well fit by NFW profiles (Navarro et al. 1997). The introduction of baryons leads to a strong peak of gas and stars with , overdense relative to the collisionless simulations by a factor of 100 in the centre. While the baryonic mass is dominant in this region, it can be seen in the rightmost panel of Fig. 5 that dark matter density has also been enhanced by a factor of . Here, we plot the ratio of the dark matter density to the density from the collisionless simulations (renormalised by the cosmic dark matter fraction). The central concentration of baryons has lead to contraction of the dark matter. Only in dwarf 4 has the feedback managed to expel sufficient baryons to prevent this central overdensity, its total and dark matter density profiles lying marginally under the collisionless case.
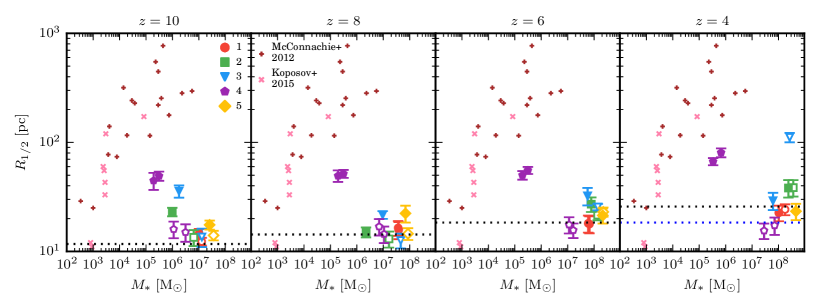
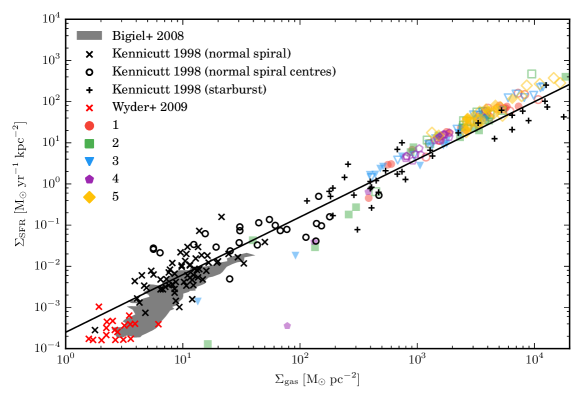
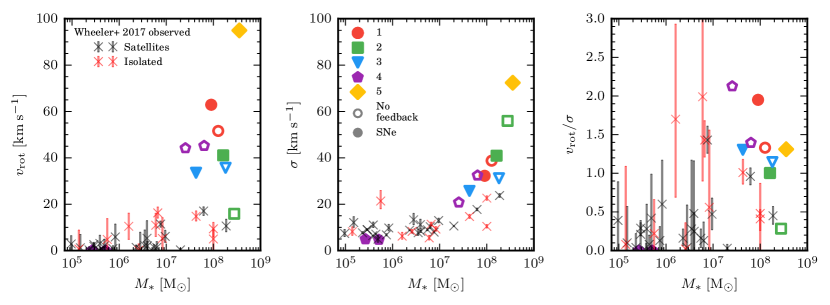
Fig. 6 shows the 2D projected stellar half-mass radius, , as a function of stellar mass for the various galaxies at , 8, 6 and 4. We make this measurement from 500 randomly distributed viewing angles444The results are well converged with number of samples above 500.. The mean of the sample is plotted, error bars indicating the 1 limit of the distribution. We mark with horizontal dotted lines the gravitational softening lengths. For reference, we also plot observations of local dwarfs (McConnachie 2012; Koposov et al. 2015), although the comparison of these objects with our dwarfs should be taken with some caution. The majority of our galaxies have extremely compact stellar distributions. While the projections in Fig. 2 show extended discs on the scale of hundreds of parsecs, most of the stellar mass is contained within a few tens of parsecs. In fact, the stellar half-mass radius is very close to the gravitational softening length, indicating that that the objects have undergone catastrophic collapse halted only by our limited resolution555Dwarf 3 without feedback at is somewhat of an outlier. The lack of any disruption from mergers has allowed a more extended stellar distribution. As the majority of these stars are formed between , this leads to a sudden increase in by . The simulation with SNe has a significantly smaller , but this is mainly because it has a proportionally lower mass of stars.. The two component subhaloes of dwarf 4 remain less concentrated with the inclusion of SNe, lying at within a factor of a few of the observations at (dwarfs 2 and 3 also have larger at before the failure of the SNe at later times).
Fig. 7 shows the location of our objects on a Kennicutt-Schmidt plot (SFR surface density as a function of gas surface density) between . We make these global measurements by taking the face-on ‘disc’ projection defined by the total angular momentum vector of the gas within twice the 3D stellar half-mass radius (although it should be noted that not all of our galaxies produce discs). For a given projection of the galaxy, we find the 2D radius containing 90% of the total SFR666The measurements are relatively insensitive to the exact fraction adopted, the points being shifted up and down the Kennicutt-Schmidt relation slightly.. We then compute SFR surface density and mass surface density from the gas within this radius. Fig. 7 also shows global (Kennicutt 1998; Wyder et al. 2009) and spatially resolved (Bigiel et al. 2008) observations. Due to the extremely compact nature of most of our galaxies, the majority of our simulations appear in the same region of the Kennicutt-Schmidt plot as starburst galaxies. There is a trend for our simulations with feedback to produce galaxies with slightly lower SFR and mass surface densities than simulations without feedback. When galaxies experience an efficient burst of feedback (dwarfs 2, 3 and 4; see Fig. 4) they move towards the lower end of the relation. However, because these bursts are very strong and tend to completely disrupt the star forming gas, we do not see a steady state at low surface densities, but the measurements in this quenched phase lie well beyond the boundaries of the plot. For example, dwarf 4 with feedback only appears on the plot at , 11 and 4.5 because it effectively has no star formation at other times (we do not plot the secondary subhalo of dwarf 4).
Fig. 8 shows kinematic information of our simulated galaxies as a function of stellar mass at as compared to measurements of local dwarfs from Wheeler et al. (2017). The left panel shows the rotational velocity. We take here the peak value of the stellar rotation curve, having first transformed into the ‘disc’ plane of the galaxy by aligning with the total angular momentum vector of the stars. It should be noted that the kinematics from the simulations should be treated with caution given that the size of the systems approaches the gravitational softening length in those cases in which catastrophic collapse has occurred. The rotational velocities are well in excess of the observations, but not unexpected given the highly peaked circular velocity profiles (see Fig. 5). It should, however, again be noted that we are comparing high redshift kinematics with low redshift data; we would expect the circular velocity to scale as (e.g. Bullock et al. 2001) which might reduce the tension. There is a trend for the simulations with SN feedback to produce higher rotational velocity systems (except for dwarf 4). With SNe, however, the two subhaloes of dwarf 4 show no evidence of rotation and are therefore consistent with the observations at that mass which demonstrate little or no rotation.
The central panel of Fig. 8 shows the 1D velocity dispersion, , for our systems. We measure the 3D velocity dispersion within a sphere whose radius corresponds to the peak rotational velocity777Taking other reasonable radii, such as one or two times the stellar half-mass radius yields the same results within ; these radii are all comparable., then obtain the 1D value by dividing by . In the case of dwarf 4 with SNe (which shows no rotation) we use the stellar half-mass radii. Again, most simulations lie significantly above the local observations, a consequence of the highly compact systems (Fig. 6 demonstrates how much more extended observed galaxies in this mass range are). There is a steep relation of increasing with increasing stellar mass. The two subhaloes of dwarf 4 with SNe lie close to the observations, with velocity dispersions of .
Examining the ratio of the rotational velocity to the velocity dispersion provides a measure of the rotational support of the system. This is shown in the right panel of Fig. 8. Most of our systems are rotationally supported, in contrast with the observations which prefer rotation to be subdominant (although there are a few outliers and the uncertainties are large in some observations), with the caveat that we are comparing our objects with local observations. Only dwarf 4 with SNe is consistent with observations producing a dispersion dominated system. We note that our dwarfs end up as either over-massive discs when feedback is inefficient or a dim spheroidal when feedback is efficient in dwarf 4 (a similar pattern is found for Milky Way mass haloes by Roškar et al. 2014), but given that we only have one of the latter types of objects we cannot make any claim to bimodality.
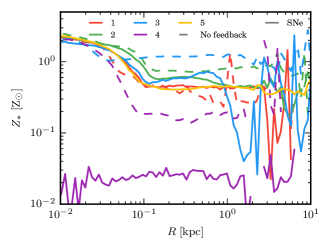
Because dwarfs 1, 2, 3 and 5 produce such large masses of stars in a confined region, the resulting metal enrichment of the surrounding region is necessarily extremely high. Fig. 9 shows radial stellar metallicity profiles at . Without SNe, the central tens of parsecs (which contain most of the stellar mass) are dominated by a stellar population of . The metallicity drops rapidly through the disc region (on the order of pc, see also Fig. 2) to reach a metallicity ranging between (dwarf 4) and (dwarf 2) in the stellar ‘halo’. The metallicity gradient is then flat until the edge of the stellar distribution, after which the profiles are noisy due to the low stellar density and the presence of other subhaloes. With the exception of dwarf 4, the addition of SNe makes very little difference to the stellar metallicities, which is to be expected given the inefficiency of feedback in these systems (although, in dwarf 3, the stellar halo is curtailed at a smaller radius). For dwarf 4, SNe reduce the central metallicities by 2 orders of magnitude to . The resulting metallicity gradient is flat through the entire stellar distribution, out to (the second subhalo appears in this radial profile at larger radii, as can also be seen in the no feedback profile). While the lower stellar metallicities are partially due to the lower overall stellar mass formed relative to the no feedback simulation, the ability of the SNe to expel metals from the centre of the halo is also key.
Fig. 10 shows mass-weighted gas metallicity projections of dwarf 4, without and with the inclusion of feedback. In the absence of feedback, metals remain where they have been deposited by the star particles, leading to high concentrations around the subhaloes. This can be seen in the projection, where the majority of gas (both inside and outside of the virial radius) remains at the metallicity floor of the initial conditions, . Very small patches of super-solar metallicity gas can be seen around the subhaloes, while some metal enriched gas has been stripped during the merger, leaving trails. With the inclusion of feedback, gas of a few is widely distributed inside and outside of the virial radius. In the other dwarfs, the inclusion of feedback also allows metals to leave the halo ( at the virial radius), but approximately 3 orders of magnitude more stellar mass has been created to achieve this i.e. the SNe are times less efficient at ejecting metals. We reported a similar phenomenon in isolated simulations in Smith et al. (2018), where inefficient SNe lead to slow moving, highly metal enriched outflows simply due to the number of SNe occurring. Nonetheless, dwarf 4 demonstrates that it is possible for dwarfs to efficiently enrich the CGM.
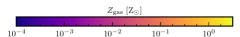
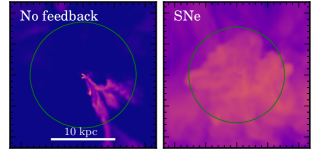
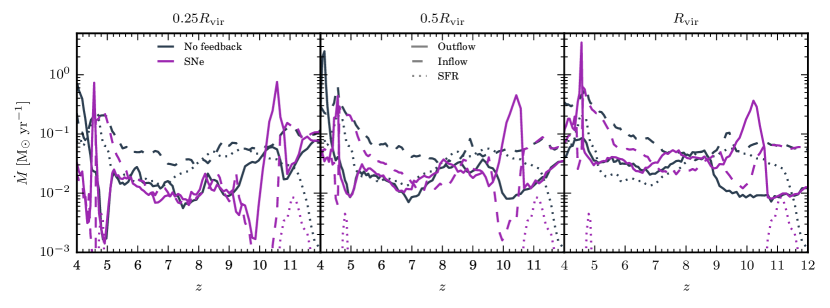
Fig. 11 shows gas mass outflow and inflow rates across , and as a function of redshift for dwarf 4 with and without SN feedback. SFRs are also plotted for comparison. The outflow rates are calculated as:
| (3) |
where the sum is over all gas cells within a shell of thickness centred on the target radius that have a positive radial outflow velocity, . The inflow rates are calculated in the same manner, but for all cells that have a negative radial velocity. In the absence of SN feedback, outflow rates mostly remain well below inflow rates, with outflows only arising from the motion of substructures and mergers. For example, the dramatic increase in outflow rates just before is due to the motion of the merging subhalo within the primary halo. With SN feedback, after the bursts of star formation, outflow rates increase dramatically while inflow is suppressed.
Outflows are often characterised in terms of mass loading factor, i.e. the ratio of outflow rate to SFR. The outflows across the three radii are offset from the peak of the SFR due to the time difference between star formation and SNe exploding as well as the travel time of the outflow, so an instantaneous mass loading factor is not a useful quantity. However, comparing the peak SFRs and outflow rates yields a mass loading factor of approximately 90, 60 and 30 across , and , respectively. Following the burst of star formation at , inflow across is essentially halted until after . The inflow rates remain a factor of below the corresponding no feedback simulation rates until the merger begins at . At this point, it appears that the UV background is hindering the ability of gas to condense into the centre of the halo. The second burst of star formation after also produces a brief outflow, preventing further star formation. None of the other dwarfs simulated are able to produce strong outflows. Dwarfs 2 and 3 have very brief outflows after bursts of star formation and subsequent efficient feedback, but they have mass loading factors and barely suppress inflow rates except in the very centre of the halo.
4 Discussion
4.1 Why is SN feedback inefficient?
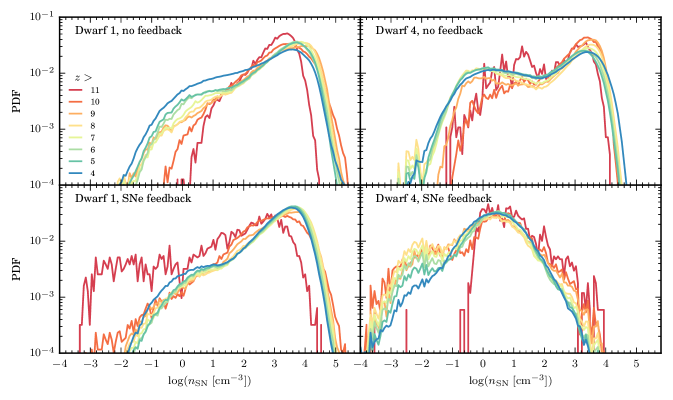
In all of our simulated galaxies except for dwarf 4, SN feedback is unable to prevent the catastrophic collapse of gas and resulting runaway star formation. The reason for this inefficiency appears to be that most SNe occur in very dense gas. This can be seen in Fig. 12 which shows the distribution of gas density in which SN explode for all SNe above a given redshift for dwarfs 1 and 4, with and without feedback. Comparing the PDFs for dwarf 1 at for the no feedback and feedback simulations, both peak at a high density of . With feedback, there is a slight tail to low density, indicating that the feedback has been able to clear some gas. A short time later at , the peak of the distribution is at . By contrast, while without feedback dwarf 4 has a similar PDF to dwarf 1, once SNe are included the peak of the distribution is at for all redshifts. With SNe as the sole form of feedback, the decisive criterion determining the success and failure of the feedback is whether it is able to clear the dense gas immediately. If at any point it cannot, then subsequent SNe will become increasingly inefficient, eventually resulting in the inability of the feedback to have sufficient impact on galaxy properties.
Dwarf 1 fails the criterion immediately, as does dwarf 5. Dwarf 2 succeeds twice but is overwhelmed by a sudden increase of gas during a wet merger at . Dwarf 3 is partially successful, but the bursts reach too high a SFR before the system is quenched, so the net reduction in stellar mass is too low. Dwarf 4 is unique amongst our simulations in being completely successful, mainly due to its merger history. As described in the previous section, while the final halo is comparable in mass to dwarf 1, it is formed from a major merger (with a mass ratio ) late in its history (). This means that it spends most of its evolution as two smaller haloes. Having a lower halo mass makes it easier to clear gas for two reasons. Firstly, there is a shallower potential well to fight against. Secondly, the inflow of gas onto the haloes is reduced relative to dwarf 1 (even without feedback, the SFRs for the two progenitor haloes are lower than for dwarf 1; see Fig. 4). This means that while at dwarf 1 and dwarf 4 have the same virial mass to within 0.05 dex, they have evolved as if they were very different mass systems due to the manner of their assembly.
It may appear at first glance that the inefficiency of SNe in dense gas is a result of shortcomings in our method of feedback injection i.e. numerical overcooling. However, our mechanical scheme is designed to help mitigate the effects of under-resolved SN remnants by injecting the correct momentum relative to the stage of their evolution that can be resolved. Full details can be found in Smith et al. (2018) where we also demonstrate using isolated simulations that this scheme is numerically robust (see also the following section where we discuss convergence with resolution). For extremely dense gas, at most tractable resolutions, the SN remnant will remain entirely unresolved so our scheme will inject the final momentum achieved during the Sedov-Taylor phase. We make use of a fitting function to high resolution simulations of individual SNe (see Blondin et al. 1998; Thornton et al. 1998; Geen et al. 2015; Kim & Ostriker 2015; Martizzi et al. 2015; Kimm et al. 2015),
| (4) |
where is the energy of the SN (for our individually time-resolved SNe, ), while and are the hydrogen number density and metallicity of the ambient gas, respectively.
It can therefore be seen by comparing the peaks of the density PDF for SN sites that in dwarf 1 the momentum budget per SN is reduced to of that in dwarf 4. Additionally, if metals are not cleared efficiently this will also impact the available momentum. Given that the typical gas metallicity in the centre of dwarf 1 is approximately a factor of 100 higher than in dwarf 4, this reduces the momentum budget again by half, meaning that in total only 20% of the momentum budget per SN is available relative to dwarf 4. In addition to impacting the small scale evolution of the SN remnant, the build up of a central concentration of dense gas will make it more difficult for the momentum injection from SNe to clear material from the galaxy because the mass of material that must be swept up in order for an outflow to escape becomes proportionally higher. These two factors lead to a state of runaway star formation if at any point the feedback is unable to prevent the build up of dense gas, particularly if inflow rates increase suddenly (e.g. due to mergers, be they major or minor).
4.2 The impact of the choice of parameters on our results
Having discussed the reasons why SN feedback is inefficient in our fiducial simulations, we now explore the degree to which our results are generally applicable as opposed to being dependent on our choice of parameters. Fig. 13 shows the SFR as a function of redshift and the stellar mass to halo mass ratio as a function of halo mass (at , 8, 6 and 4) for our fiducial simulations of dwarf 1 as well as 9 resimulations in which we vary various parameters of our models. Again, we plot the (heavily extrapolated) abundance matching relations from Behroozi et al. (2013) and Moster et al. (2018). We also indicate the integrated star formation efficiency equivalent to the stellar mass equalling the (still extrapolated) Moster et al. (2018) prediction888We take the halo mass at for dwarf 1 from a dark matter only simulation. Using the abundance matching relation from Moster et al. (2018) we obtain a predicted stellar mass, . Even at this redshift, we must still extrapolate down in halo mass by 0.5 dex. We can then determine the equivalent integrated star formation efficiency for a given halo mass (i.e. at a higher redshift) if the galaxy had the predicted stellar mass. This is the dashed line in Fig. 13.. If the galaxy exceeds this value, this means that it has already formed more than the stellar mass prediction (although this should be taken as a rough guide because of the effects of extrapolation and intrinsic scatter). It can be seen that this is the case for the majority of our simulations, often by .
We can see that our choice to delay turning on the Faucher-Giguère et al. (2009) UV background until is similar to switching it from , apart from a slight reduction in SFRs between . This shows that the assumed UV background is unable to prevent the catastrophic build up of gas at . We note, however, that this conclusion rests on the approximation of a homogeneous UV background as opposed to local varying radiation fields. Dwarfs that are in crowded regions or are satellites of larger galaxies may be bathed in ionizing radiation from nearby external sources, assuming that those galaxies are able to clear/ionize sufficient local gas to achieve a high enough escape fraction for UV photons. The failure of the UV background to quench our dwarfs is not inconsistent with other works that indicate the existence of a threshold mass of a few below which UV background is effective (see e.g. Okamoto et al. 2008; Shen et al. 2014; Sawala et al. 2014; Wheeler et al. 2015; Fitts et al. 2017) as our dwarfs will have virial masses in excess of . Perhaps more importantly, we have neglected photoionization from the stars formed in the galaxies themselves. This may be able to prevent the build up of dense gas in star forming regions (see e.g. Vázquez-Semadeni et al. 2010; Walch et al. 2012; Dale et al. 2014; Sales et al. 2014; Rosdahl et al. 2015). The formation of H ii regions can result in SNe occurring in lower density regions, enhancing their efficiency (see e.g. Geen et al. 2015). However, resolving H ii regions in these circumstances is challenging (the radius of a Strömgren sphere around a typical O star embedded in gas is sub-parsec). While it is possible to try and compensate for the effect of unresolved H ii regions on SN remnant evolution in a subgrid manner (e.g. Kimm et al. 2017), this is beyond the scope of this work. However, we note that pre-SN stellar feedback is one example of additional physics that can enhance the ability of SNe to regulate galaxy properties, as we discuss below.
The use of pressure floors to prevent artificial fragmentation is a subject of some debate in the literature. We discussed the impact of adopting such a technique in some detail in Smith et al. (2018), so we refrain from an in-depth discussion here. Nonetheless, we tested the impact on our zoom-in simulations by resimulating dwarf 1 without a pressure floor. As can be seen from Fig. 13, this has a negligible impact on our results. The lack of a floor seems to produce slightly more clustered SNe, leading to a reduction in SFR by a factor a few from . However, in general the SFR is similar to the fiducial simulation and the stellar mass is the same within 4%.
Increasing the star formation threshold by an order of magnitude to also produces more clustered SNe at early times, allowing the feedback to quench star formation at . This leads to a reduction in stellar mass relative to the fiducial case by a factor of a few at . However, this is still not enough to prevent the build up of dense gas at later times. From onwards, the SFR is similar to the fiducial case, leading to a reduction of the stellar mass by only 1.3.
We further carry out a simulation in which we modify the equation used to calculate the final momentum of a SN remnant after the Sedov-Taylor phase (eq. 4) such that the dependence on ambient gas density is capped at . This is a crude approximation to the idea that local stellar feedback may have prevented surrounding gas reaching high density prior to the first SN occurring. Imposing this density cap increases the momentum budget per SN by a factor of 1.7 relative to SN occurring in gas with (as in Fig. 12). Of course, the gas itself is still at high density, so continues to present an obstacle to efficient clearing of material from a hydrodynamical standpoint. Nonetheless, with this caveat in mind and very moderate increase in the momentum budget, this simulation results in a factor of 3 lower stellar mass at . This hints that the need to regulate local gas density is important, but also demonstrates that such a simple modification to the subgrid scheme is not sufficient to obtain realistic galaxy properties.
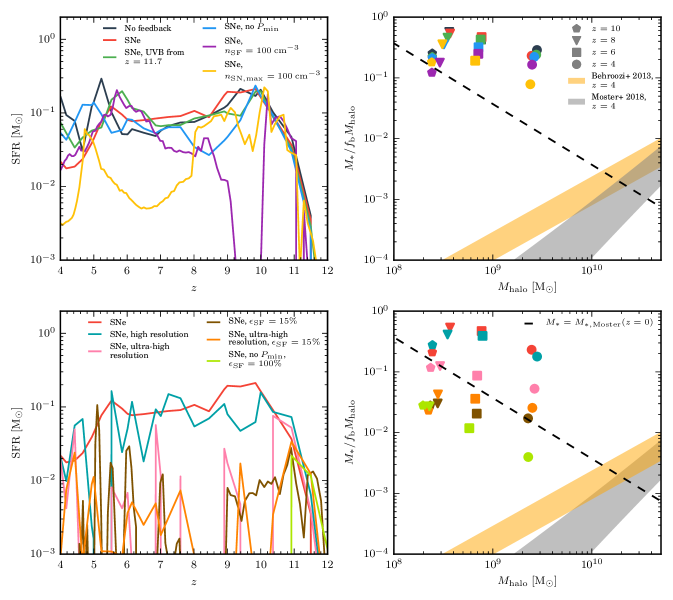
Increasing the number of resolution elements in the zoom-in region by a factor of (which we label as ‘high resolution’), giving a mass resolution of and for dark matter particles and gas cells, respectively, has very little impact on the results. While the SFR shows slightly more variation than the fiducial resolution simulation and there is a suppression of star formation briefly between , even with the increased resolution the feedback is unable to prevent runaway star formation beginning at early times. This leads to a stellar mass that only differs from the fiducial simulation by a factor of . We also further increase the gas cell mass resolution to (labelled ‘ultra-high resolution’)999Our refinement/derefinement strategy keeps the cells within a factor of 2 of the target mass. At this means that a substantial number of star particles are formed with an initial mass lower than our fiducial SN ejecta mass of . Therefore, for this simulation we drop the ejecta mass to . We have carried out additional tests (not shown) to confirm that this has a negligible impact on our results.. This results in a far more bursty SFR as outflows are stronger. This is consistent with our previous tests in isolated setups that demonstrate that strong outflow generation is difficult to achieve with a mass resolution coarser than (Smith et al. 2018, see also discussions in Kimm et al. 2015, Hu et al. 2016 and Hu 2019). While this means that the results do not converge well with resolution, the galaxy still exceeds the predicted stellar mass as early as .
At the fiducial resolution, increasing the star formation efficiency, by a factor of 10 to 15% leads to significantly different behaviour. The SFR rises faster and strong clustering of SNe leads to efficient launching of outflows and the suppression of star formation. Star formation proceeds in short bursts for the entire duration of the simulation. Despite this, the stellar mass is only reduced by slightly over an order of magnitude, leaving it over 2 orders of magnitude above the (extrapolated) abundance matching relations and an order of magnitude larger than dwarf 4 with the fiducial star formation parameters. Failing to match the abundance matching relations at this redshift is not necessarily a failure in and of itself because of the uncertainties involved at this mass range. However, at , the galaxy has just reached the predicted stellar mass. Given that there are no indications that it has been conclusively quenched at , this suggests that the galaxy may well end up with an unphysically large stellar mass at . Repeating this experiment with the ultra-high resolution (decreasing cell mass by a factor of 19) reveals similar results, actually resulting in a slightly higher final stellar mass.
Finally, we try an extreme choice of parameters in an attempt to reduce the stellar mass further. We turn off the pressure floor and use . This leads to extremely rapid star formation and a concentrated burst of SN feedback that is able to completely quench the galaxy, expelling most of the gas. Star formation does not resume by . The result is a reduction in stellar mass by almost 2 orders of magnitude. While this is still too high relative to the extrapolated abundance matching relations, it is possible that this galaxy would move onto the relation at lower redshift. While this may be seen as a successful solution, a more cautious interpretation would indicate that, given that we need to push our star formation model to its extremes in order to be successful, we are likely neglecting some other important physical processes that would alleviate the need for very high values of in the first place.
Selecting the appropriate value of to use in galaxy simulations is non-trivial, particularly in the case where star forming regions may be partially resolved. It is important to establish over what time and length scales the efficiency is averaged and the degree to which these scales are relevant to the scales and physics resolvable in the simulation. We have adopted a fiducial value of , which represents an average over a GMC and over a cloud-scale free-fall time (see e.g. Krumholz & Tan 2007). The value itself can be considered representative for a ‘typical’ Milky Way (MW) star forming region, although observations reveal a large observed scatter of up to 0.8 dex (see e.g. Murray 2011; Lee et al. 2016). One way of explaining this scatter is to invoke a (magneto)-turbulent model of GMC star formation to modulate the efficiency per free-fall time (e.g. Krumholz & McKee 2005; Padoan & Nordlund 2011; Hennebelle & Chabrier 2011; Federrath & Klessen 2012). In more extreme environments, the deviation from the standard SF relations can be even more severe. Some high-redshift disc and starburst galaxies have been reported to have larger by a factor of at least 10 (see e.g. Daddi et al. 2010; Genzel et al. 2010) while in the MW’s Central Molecular Zone (CMZ), a possible analog for high redshift star formation environments, the efficiency appears to be a factor of 10-100 lower (see e.g. Longmore et al. 2013; however, see e.g. Sharda et al. 2018 and Federrath et al. 2016 for applications of (magneto)-turbulent SF models to high redshift and MW CMZ environments, respectively). Additionally, in certain circumstances it is possible that while an average over long timescales yields some value of the efficiency, it may in fact vary episodically on smaller scales, either due to regulation by turbulent pressure (see e.g. Kruijssen et al. 2014) or by feedback regulation (see e.g. Grudić et al. 2018). The upshot of both of these scenarios is that using a large spatial scale and ‘long’ timescale averaged value of may artificially smooth out star formation and, crucially for this work, SN rates.
The reason for the increase in SN feedback efficiency as a result of increasing is twofold. Firstly, it leads to more clustered SNe that are able to work together to drive outflows. Secondly, it avoids the issue of building up high density gas by efficiently converting gas into stars before the problem arises. Care, however, must be taken when using such high values of the efficiency that this does not represent an unphysical removal of gas. As the gas consumption time is then effectively the free-fall time, above this becomes comparable to the time before the first SNe explode, meaning that most, if not all, of the local gas will have been converted into stars, significantly dropping local density for subsequent SN events. If the internal structure of star-forming regions is well resolved this may not particularly problematic because the hydrodynamics should correctly follow the fragmentation of the region without recourse to ‘fudge factors’. However, if the region is unresolved, using an efficiency of will quickly convert the entire mass of the region into stars, which is likely unphysical. In other words, if we are confident that we fully resolve all the relevant small scale processes and timescales (for example, that our hydrodynamics will correctly capture effects such as turbulent support, or that our subgrid feedback prescriptions are fully physical), then we can use a high star formation efficiency coupled with some smaller scale restrictions for which gas can form stars (e.g. virial parameter, Jeans unstable gas etc.) and rely on these processes to correctly regulate the resulting SFRs. If not, then the results are likely to be erroneous. For example, in a scenario such as that described by Kruijssen et al. (2014), if we fail to resolve the turbulent pressure (and other relevant small scale details) that leads to episodic star formation, then we will entirely miss the low efficiency section of the cycle. In our case, it is likely that we sit somewhere in between these two cases. Our fiducial choice of a fixed is possibly too conservative. On the other hand, it is not clear that we capture the small scale structure and turbulence of the ISM sufficiently to justify 100%, probably leading to the unphysically rapid consumption of star forming regions by gas ‘deletion’ and subsequently overpowered SN feedback. It should be noted that roughly this magnitude of will be required to regulate SF, as using 10 times our fiducial value also failed to regulate star formation.
Furthermore, we have experimented with the adoption of a SF prescription that uses a variable efficiency based on local turbulent gas properties (with a prescription similar to Kimm et al. 2017). This scheme attempts to infer the likely (unresolved) turbulent Mach number, , and virial parameter, , based on the resolved local velocity gradients. These are then used as inputs into the analytic star formation law of Padoan & Nordlund (2011) (see also this formalism explored in Federrath & Klessen 2012). This derives a star formation efficiency per freefall time by calculating the fraction of gas above some critical density, determined by considering the particular log-normal density distribution of gas expected for the given values of and . We leave a detailed discussion to a future work (Smith et al. 2019 in prep.), but find it worthwhile to report the tentative result that in this specific case there is little impact on the evolution of Dwarf 1. This is largely because we find in our simulations these models typically give , which we have already demonstrated is not high enough to sufficiently enhance the strength of SN feedback such that it makes a difference to the evolution of our dwarfs. Nonetheless, it is clear that the efficiency of SN feedback is strongly dependent on their spatial and temporal clustering. Since this is explicitly tied to the manner in which star formation proceeds on local scales, it is important to model this in a physical a manner as possible.
Another phenomenon which impacts SN clustering properties is the fraction of walkaway/runaway SN progenitors. Dynamical interactions during the formation of a star cluster may eject progenitors (see e.g. Poveda et al. 1967; Fujii & Portegies Zwart 2011; Oh et al. 2015) or alternatively runaways may be caused by the occurrence of a SNe in an OB binary system (see e.g. Blaauw 1961; Portegies Zwart 2000; Eldridge et al. 2011, see also Kim & Ostriker 2017 for a subgrid implementation of this mechanism). If a progenitor is able to travel away from its birth site the subsequent SN is more likely to occur in a low density medium which maximises its efficiency. Conversely, a high fraction of runaways will tend to smooth out the spatial clustering of the ensemble of SNe, potentially reducing the ability of remnants to overlap and form superbubbles. Finally, if SNe occur outside of the dense star forming clouds they may not be able to efficiently disperse star forming gas. Speculating on the dominant impact of runaway SN progenitors is beyond the scope of this present work (given that it is likely to be sensitive to the exact parameters adopted such as runaway fraction, velocity distribution etc.), but we note that they may play an important role in determining overall SN feedback efficiency.
It is worth reemphasizing that regardless of the star formation criteria, there is a large body of theoretical and observational work indicating that other sources of stellar feedback must be operating prior to the first SN, such as stellar winds, photoelectric heating and photoionization from young stars. These processes may have a significant impact on local gas, not only affecting its density and temperature structure, but also the level of turbulent support. Given that we have demonstrated a tendency for dense gas to build up and overwhelm SN feedback in our dwarfs (and that this effect is physically realistic, rather than just being a symptom of numerical overcooling), it may be the case that non-SN stellar feedback plays a more important role in the evolution of low mass haloes than is commonly assumed. This conclusion is consistent with the results found by the FIRE-1 project (Hopkins et al. 2014) in which the removal of other sources of stellar feedback in dwarfs led to SN feedback having almost no impact on stellar mass (though the effect appears to be less severe in FIRE-2 (Hopkins et al. 2018a)). Finally, we note that the efficiency of first (and subsequent) SN events may depend on the fraction of runaway SN and on alternative heating processes such as those provided by relativistically accelerated particles in the wake of SN explosions.
5 Conclusion
We have carried out very high resolution cosmological zoom-in simulations of five dwarf galaxies up to with virial masses between . Our simulations adopt the mechanical SN feedback scheme introduced in Smith et al. (2018) and a spatially constant, but time evolving UV background (Faucher-Giguère et al. 2009). The SN feedback is constructed to deliver the correct momentum to the surrounding ISM corresponding to the stage of the SN remnant evolution. We found that this model leads to self-regulated star formation rates, realistic galaxy kinematics and gas content thanks to the occurrence of multiphase, mass-loaded outflows in isolated dwarf simulations (Smith et al. 2018). The aim of the present work is to determine whether the same model of SN feedback results in the realistic dwarfs properties once the full cosmological formation is incorporated self-consistently. We find that:
-
•
Without the inclusion of SN feedback, we produce dwarfs that have over 3 orders of magnitude too much stellar mass relative to (extrapolated) abundance matching predictions. Their stellar and gas metallicities are in excess of solar abundances. The dwarfs undergo a catastrophic collapse to the resolution limit, resulting in extremely dense systems with strongly peaked circular velocity curves. Dark matter density in the centre of the halo is enhanced relative to a collisionless simulation by approximately an order of magnitude.
-
•
In general, while the inclusion of SN feedback induces more bursty SFR rates and affects dwarf morphologies, it has insufficient impact on the total stellar mass formed. In the majority of our systems, the build up of dense gas (often following a wet merger) renders the SNe too inefficient to expel gas from the galaxy and suppress star formation. We emphasise because our scheme injects the correct amount of momentum per SN, this effect is not an example of classical numerical overcooling but rather a physical suppression of SN efficiency. Most SNe explode in gas of density which limits the feedback momentum budget available. This suggests that some other mechanism(s) must be invoked (e.g. other sources of stellar feedback) that can prevent gas from collapsing to such high densities and/or clear it prior to SNe occurring. Inclusion of runaway SN may help alleviate this issue as well.
-
•
We however find one exception to this scenario where we are able to produce a realistic dwarf relative to the extrapolations of abundance matching and various metrics of local analogs. Our dwarf 4 forms by a major merger relatively late in its history at . It therefore spends most of its evolution as two lower mass systems in which the SNe are able to expel gas and halt star formation before catastrophic collapse sets in. Their late major merger is therefore mostly dry and does not trigger more than a brief burst of star formation which is quickly suppressed by feedback. We note that while SNe feedback is clearly efficient here, enriching the CGM to a few with mass-loaded winds, no prominent dark matter core forms.
-
•
We have carried out a variety of other simulations to test the applicability of our conclusions. We find that our results are not significantly impacted by increasing resolution, changing details of the (spatially uniform) UV background or removing the pressure floor. Our results are also relatively insensitive to increasing the star formation density threshold by an order of magnitude. Arbitrarily increasing the star formation efficiency parameter by an order of magnitude to 15% leads to more bursty behaviour and reduced star formation, but still overshoots abundance matching relations by 2 orders of magnitude. Only by taking an extreme choice of parameters, using a star formation efficiency of , are we able to get close to the relation.
We have demonstrated that realistically modelled SN feedback is easily overwhelmed early on in the cosmological assembly of dwarfs by the build up of gas, despite the relatively shallow potential well. While this can potentially be dealt with by adopting a star formation prescription that leads to extremely concentrated SN feedback, it seems that some combination of other sources of stellar feedback and/or currently unresolved turbulent support may be required to modulate ISM densities prior to the first SNe exploding in order to preserve their efficiency.
Acknowledgements
We are grateful to Cathie Clarke, Adrianne Slyz, Christoph Federrath and the anonymous referee for helpful comments. MCS and DS acknowledge support by the Science and Technology Facilities Council (STFC) and the ERC Starting Grant 638707 “Black holes and their host galaxies: co-evolution across cosmic time”. This work was performed on the following: the DiRAC Data Analytic system at the University of Cambridge, operated by the University of Cambridge High Performance Computing Service on behalf of the STFC DiRAC HPC Facility (www.dirac.ac.uk). This equipment was funded by BIS National E-infrastructure capital grant (ST/K001590/1), STFC capital grants ST/H008861/1 and ST/H00887X/1, and STFC DiRAC Operations grant ST/K00333X/1; the Cambridge Service for Data Driven Discovery (CSD3), part of which is operated by the University of Cambridge Research Computing on behalf of the STFC DiRAC HPC Facility. The DiRAC component of CSD3 was funded by BEIS capital funding via STFC capital grants ST/P002307/1 and ST/R002452/1 and STFC operations grant ST/R00689X/1; the DiRAC@Durham facility managed by the Institute for Computational Cosmology on behalf of the STFC DiRAC HPC Facility. The equipment was funded by BEIS capital funding via STFC capital grants ST/P002293/1 and ST/R002371/1, Durham University and STFC operations grant ST/R000832/1. DiRAC is part of the National e-Infrastructure.
References
- Behroozi et al. (2013) Behroozi P. S., Wechsler R. H., Conroy C., 2013, ApJ, 770, 57
- Bigiel et al. (2008) Bigiel F., Leroy A., Walter F., Brinks E., de Blok W. J. G., Madore B., Thornley M. D., 2008, AJ, 136, 2846
- Blaauw (1961) Blaauw A., 1961, Bull. Astron. Inst. Netherlands, 15, 265
- Blondin et al. (1998) Blondin J. M., Wright E. B., Borkowski K. J., Reynolds S. P., 1998, AJ, 500, 342
- Bryan & Norman (1998) Bryan G. L., Norman M. L., 1998, ApJ, 495, 80
- Bullock et al. (2001) Bullock J. S., Kolatt T. S., Sigad Y., Somerville R. S., Kravtsov A. V., Klypin A. A., Primack J. R., Dekel A., 2001, MNRAS, 321, 559
- Bullock et al. (2000) Bullock J. S., Kravtsov A. V., Weinberg D. H., 2000, ApJ, 539, 517
- Cen (1992) Cen R., 1992, ApJS, 78, 341
- Cioffi et al. (1988) Cioffi D. F., McKee C. F., Bertschinger E., 1988, ApJ, 334, 252
- Daddi et al. (2010) Daddi E. et al., 2010, ApJ, 714, L118
- Dale et al. (2014) Dale J. E., Ngoumou J., Ercolano B., Bonnell I. A., 2014, MNRAS, 442, 694
- de Blok & Bosma (2002) de Blok W. J. G., Bosma A., 2002, A&A, 385, 816
- Dekel & Silk (1986) Dekel A., Silk J., 1986, ApJ, 303, 39
- Di Cintio et al. (2014) Di Cintio A., Brook C. B., Macciò A. V., Stinson G. S., Knebe A., Dutton A. A., Wadsley J., 2014, MNRAS, 437, 415
- Diemand et al. (2008) Diemand J., Kuhlen M., Madau P., Zemp M., Moore B., Potter D., Stadel J., 2008, Nature, 454, 735
- Dijkstra et al. (2004) Dijkstra M., Haiman Z., Rees M. J., Weinberg D. H., 2004, ApJ, 601, 666
- Dolag et al. (2009) Dolag K., Borgani S., Murante G., Springel V., 2009, MNRAS, 399, 497
- Efstathiou (1992) Efstathiou G., 1992, MNRAS, 256, 43P
- Eldridge et al. (2011) Eldridge J. J., Langer N., Tout C. A., 2011, MNRAS, 414, 3501
- Faucher-Giguère et al. (2009) Faucher-Giguère C.-A., Lidz A., Zaldarriaga M., Hernquist L., 2009, ApJ, 703, 1416
- Federrath & Klessen (2012) Federrath C., Klessen R. S., 2012, ApJ, 761, 156
- Federrath et al. (2016) Federrath C. et al., 2016, ApJ, 832, 143
- Fitts et al. (2017) Fitts A. et al., 2017, MNRAS, 471, 3547
- Flores & Primack (1994) Flores R. A., Primack J. R., 1994, ApJ, 427, L1
- Fujii & Portegies Zwart (2011) Fujii M. S., Portegies Zwart S., 2011, Science, 334, 1380
- Geen et al. (2015) Geen S., Hennebelle P., Tremblin P., Rosdahl J., 2015, MNRAS, 454, 4484
- Genzel et al. (2010) Genzel R. et al., 2010, MNRAS, 407, 2091
- Gnedin & Zhao (2002) Gnedin O. Y., Zhao H., 2002, MNRAS, 333, 299
- Governato et al. (2010) Governato F. et al., 2010, Nature, 463, 203
- Governato et al. (2007) Governato F., Willman B., Mayer L., Brooks A., Stinson G., Valenzuela O., Wadsley J., Quinn T., 2007, MNRAS, 374, 1479
- Grudić et al. (2018) Grudić M. Y., Hopkins P. F., Faucher-Giguère C.-A., Quataert E., Murray N., Kereš D., 2018, MNRAS, 475, 3511
- Hahn & Abel (2011) Hahn O., Abel T., 2011, MNRAS, 415, 2101
- Hennebelle & Chabrier (2011) Hennebelle P., Chabrier G., 2011, ApJ, 743, L29
- Hopkins et al. (2014) Hopkins P. F., Kereš D., Oñorbe J., Faucher-Giguère C.-A., Quataert E., Murray N., Bullock J. S., 2014, MNRAS, 445, 581
- Hopkins et al. (2018a) Hopkins P. F. et al., 2018a, MNRAS, 480, 800
- Hopkins et al. (2018b) Hopkins P. F. et al., 2018b, MNRAS, 477, 1578
- Hu (2019) Hu C.-Y., 2019, MNRAS, 483, 3363
- Hu et al. (2016) Hu C.-Y., Naab T., Walch S., Glover S. C. O., Clark P. C., 2016, MNRAS, 458, 3528
- Iffrig & Hennebelle (2015) Iffrig O., Hennebelle P., 2015, A&A, 576, A95
- Katz et al. (1996) Katz N., Weinberg D. H., Hernquist L., 1996, ApJS, 105, q9
- Kennicutt (1998) Kennicutt R. C., 1998, ApJ, 498, 541
- Kim & Ostriker (2015) Kim C.-G., Ostriker E. C., 2015, ApJ, 802, 99
- Kim & Ostriker (2017) Kim C.-G., Ostriker E. C., 2017, ApJ, 846, 133
- Kim et al. (2015) Kim D., Jerjen H., Mackey D., Da Costa G. S., Milone A. P., 2015, ApJ, 804, L44
- Kimm & Cen (2014) Kimm T., Cen R., 2014, ApJ, 788, 121
- Kimm et al. (2015) Kimm T., Cen R., Devriendt J., Dubois Y., Slyz A., 2015, MNRAS, 451, 2900
- Kimm et al. (2017) Kimm T., Katz H., Haehnelt M., Rosdahl J., Devriendt J., Slyz A., 2017, MNRAS, 466, 4826
- Klypin et al. (1999) Klypin A., Kravtsov A. V., Valenzuela O., Prada F., 1999, ApJ, 522, 82
- Koposov et al. (2015) Koposov S. E., Belokurov V., Torrealba G., Evans N. W., 2015, ApJ, 805, 130
- Koposov et al. (2009) Koposov S. E., Yoo J., Rix H.-W., Weinberg D. H., Macciò A. V., Escudé J. M., 2009, ApJ, 696, 2179
- Kravtsov et al. (2004) Kravtsov A. V., Gnedin O. Y., Klypin A. A., 2004, ApJ, 609, 482
- Kroupa (2002) Kroupa P., 2002, Science, 295, 82
- Kruijssen et al. (2014) Kruijssen J. M. D., Longmore S. N., Elmegreen B. G., Murray N., Bally J., Testi L., Kennicutt R. C., 2014, MNRAS, 440, 3370
- Krumholz & McKee (2005) Krumholz M. R., McKee C. F., 2005, ApJ, 630, 250
- Krumholz & Tan (2007) Krumholz M. R., Tan J. C., 2007, ApJ, 654, 304
- Laevens et al. (2015) Laevens B. P. M. et al., 2015, ApJ, 802, L18
- Larson (1974) Larson R. B., 1974, MNRAS, 169, 229
- Lee et al. (2016) Lee E. J., Miville-Deschênes M.-A., Murray N. W., 2016, ApJ, 833, 229
- Leitherer et al. (1999) Leitherer C. et al., 1999, ApJS, 123, 3
- Longmore et al. (2013) Longmore S. N. et al., 2013, MNRAS, 429, 987
- Madau et al. (2008) Madau P., Kuhlen M., Diemand J., Moore B., Zemp M., Potter D., Stadel J., 2008, ApJ, 689, L41
- Martin et al. (2015) Martin N. F. et al., 2015, ApJ, 804, L5
- Martizzi et al. (2015) Martizzi D., Faucher-Giguere C.-A., Quataert E., 2015, MNRAS, 450, 504
- Mashchenko et al. (2008) Mashchenko S., Wadsley J., Couchman H. M. P., 2008, Science, 319, 174
- McConnachie (2012) McConnachie A. W., 2012, AJ, 144, 4
- Moore (1994) Moore B., 1994, Nature, 370, 629
- Moore et al. (1999) Moore B., Ghigna S., Governato F., Lake G., Quinn T., Stadel J., Tozzi P., 1999, ApJ, 524, L19
- Mori et al. (2002) Mori M., Ferrara A., Madau P., 2002, ApJ, 571, 40
- Moster et al. (2018) Moster B. P., Naab T., White S. D. M., 2018, MNRAS
- Murray (2011) Murray N., 2011, ApJ, 729, 133
- Navarro et al. (1997) Navarro J., Frenk C. S., White S. D. M., 1997, ApJ, 490, 493
- Navarro et al. (1996) Navarro J. F., Eke V. R., Frenk C. S., 1996, MNRAS, 283, L72
- Oñorbe et al. (2015) Oñorbe J., Boylan-Kolchin M., Bullock J. S., Hopkins P. F., Kereš D., Faucher-Giguère C.-A., Quataert E., Murray N., 2015, MNRAS, 454, 2092
- Oh et al. (2015) Oh S., Kroupa P., Pflamm-Altenburg J., 2015, ApJ, 805, 92
- Okamoto et al. (2008) Okamoto T., Gao L., Theuns T., 2008, MNRAS, 390, 920
- Padoan & Nordlund (2011) Padoan P., Nordlund A. k., 2011, ApJ, 730, 40
- Planck Collaboration et al. (2016) Planck Collaboration et al., 2016, A&A, 594, A13
- Pontzen & Governato (2012) Pontzen A., Governato F., 2012, MNRAS, 421, 3464
- Portegies Zwart (2000) Portegies Zwart S. F., 2000, ApJ, 544, 437
- Poveda et al. (1967) Poveda A., Ruiz J., Allen C., 1967, BOTT, 4, 86
- Rahmati et al. (2013) Rahmati A., Pawlik A. H., Raičević M., Schaye J., 2013, MNRAS, 430, 2427
- Rashkov et al. (2012) Rashkov V., Madau P., Kuhlen M., Diemand J., 2012, ApJ, 745, 142
- Read & Gilmore (2005) Read J. I., Gilmore G., 2005, MNRAS, 356, 107
- Rodriguez-Gomez et al. (2015) Rodriguez-Gomez V. et al., 2015, MNRAS, 449, 49
- Rosdahl et al. (2015) Rosdahl J., Schaye J., Teyssier R., Agertz O., 2015, MNRAS, 451, 34
- Roškar et al. (2014) Roškar R., Teyssier R., Agertz O., Wetzstein M., Moore B., 2014, MNRAS, 444, 2837
- Sales et al. (2014) Sales L. V., Marinacci F., Springel V., Petkova M., 2014, MNRAS, 439, 2990
- Sawala et al. (2016) Sawala T. et al., 2016, MNRAS, 457, 1931
- Sawala et al. (2014) Sawala T. et al., 2014, MNRAS, 448, 2941
- Schneider et al. (2012) Schneider R., Omukai K., Bianchi S., Valiante R., 2012, MNRAS, 419, 1566
- Sharda et al. (2018) Sharda P., Federrath C., da Cunha E., Swinbank A. M., Dye S., 2018, MNRAS, 477, 4380
- Shen et al. (2014) Shen S., Madau P., Conroy C., Governato F., Mayer L., 2014, ApJ, 792, 99
- Smith et al. (2018) Smith M. C., Sijacki D., Shen S., 2018, MNRAS, 478, 302
- Springel (2010) Springel V., 2010, MNRAS, 401, 791
- Springel et al. (2008) Springel V. et al., 2008, MNRAS, 391, 1685
- Springel et al. (2001) Springel V., White S. D. M., Tormen G., Kauffmann G., 2001, MNRAS, 328, 726
- Thornton et al. (1998) Thornton K., Gaudlitz M., Janka H., Steinmetz M., 1998, ApJ, 500, 95
- Truelove et al. (1997) Truelove J. K., Klein R. I., Mckee C. F., Holliman Ii J. H., Howell L. H., Greenough J. A., 1997, ApJ, 489, 179
- Vázquez-Semadeni et al. (2010) Vázquez-Semadeni E., Colín P., Gómez G. C., Ballesteros-Paredes J., Watson A. W., 2010, ApJ, 715, 1302
- Vogelsberger et al. (2013) Vogelsberger M., Genel S., Sijacki D., Torrey P., Springel V., Hernquist L., 2013, MNRAS, 436, 3031
- Vogelsberger et al. (2014) Vogelsberger M. et al., 2014, MNRAS, 444, 1518
- Walch & Naab (2015) Walch S., Naab T., 2015, MNRAS, 451, 2757
- Walch et al. (2012) Walch S. K., Whitworth A. P., Bisbas T., Wünsch R., Hubber D., 2012, MNRAS, 427, 625
- Walker & Peñarrubia (2011) Walker M. G., Peñarrubia J., 2011, ApJ, 742, 20
- Wheeler et al. (2015) Wheeler C., Oñorbe J., Bullock J. S., Boylan-Kolchin M., Elbert O. D., Garrison-Kimmel S., Hopkins P. F., Kereš D., 2015, MNRAS, 453, 1305
- Wheeler et al. (2017) Wheeler C. et al., 2017, MNRAS, 465, 2420
- Wyder et al. (2009) Wyder T. K. et al., 2009, ApJ, 696, 1834