SU Lyn: diagnosing the boundary layer with UV and hard X-ray data
Abstract
Symbiotic stars in which the symbiotic phenomenon is powered solely by accretion, often at an average rate that is higher than in cataclysmic variable stars, provide an important opportunity to diagnose boundary layers around disk-accreting white dwarfs. Here we investigate SU Lyncis, a recently discovered example of a purely accretion-powered symbiotic star, using the first reliable X-ray spectroscopy, obtained with NuSTAR, and UV photometry obtained with Swift. SU Lyn has hard, thermal, X-ray emission that is strongly affected by a variable local absorber – that has little impact on the UV emission. Its X-ray spectrum is described well using a plasma cooling from T 21 keV, with a 3 to 30 keV luminosity of approximately 4.91032 ergs s-1. The spectrum is also consistent with the presence of reflection with an amplitude of 1.0, although in that case, the best-fit plasma temperature is 20-25% lower. The UV to X-ray luminosity ratio of SU Lyn changed significantly between 2015 and 2016. We interpret this as a consequence of a drop by almost 90% in the accretion rate. Whereas the UV luminosity of the disk responded linearly, the luminosity of the optically thin (hard X-ray) emission from the boundary layer remained roughly constant because the boundary layer changed from partially optically thick to almost completely optically thin. Under this interpretation, we place a lower limit on the white dwarf mass of 0.7 M⊙ (0.8 M⊙ if we neglect reflection).
1 Introduction
Phenomenologically, symbiotic stellar binaries were initially defined by the presence of strong high-excitation emission lines in the optical on top of a red giant continuum (Kenyon, 1986). They are associated with binary systems involving a red giant star and an accretor that might be a white dwarf or a neutron star (see Mukai, 2017, for a review). Most members of the class have been discovered in the optical using the strong high-excitation lines as the defining characteristic.
What may be just the tip of an iceberg came from the discovery by Mukai et al. (2016) that the red giant SU Lyncis (SU Lyn) is the optical counterpart of a hard, thermal X-ray source. Its properties, including excess in UV when compared to non-interacting red giants and variability in optical lines of Hydrogen Balmer series, [NeIII], and Ca II, are consistent with accretion onto a white dwarf without shell burning. The hard X-ray nature of the system was firstly identified by the authors from the Swift/BAT hard X-ray all-sky survey, then followed by a coordinated follow up in X-rays and UV conducted with the Swift satelite (XRT and UVOT cameras) and in the optical through medium and high-resolution spectroscopy from two telescopes at Asiago. Altogether, the observations supported that the X-ray emission is dominated by an optically thin plasma that can be as hot as 2108 K (T of about 17 keV; from the apec model) – or peaking at 3108 K when assuming a cooling flow model (mkcflow). These properties are reminiscent of the -type symbiotic stars, which is currently composed of about a dozen members and as defined by Luna et al. (2013): “highly absorbed, hard X-ray sources […]. The likely origin is the boundary layer between an accretion disk and the white dwarf”. SU Lyn is a long-term variable X-ray emitter in both soft and hard X-rays, strongly affected by local absorbers that change with time. Besides revealing the presence of weak high-ionization lines, the optical observations led Mukai et al. (2016) to conclude that SU Lyn is an M5.8III cool giant star located at = 640100 pc, and finally pointing out that it is a member of a symbiotic system.
The potential significance of this discovery lies in the fact that there may be a large population of symbiotic stars with weak emission lines. Because of this, this population has remained hidden, only to be revealed by their high energy emission. The number of symbiotic stars in the Galaxy and their contribution to the integrated X-ray emission have likely been underestimated. Moreover, this new subclass of symbiotic stars opens up a new avenue to investigate accretion in, and evolution of, symbiotic stars. The prototype, SU Lyn, is likely to be among the brightest member of the subclass and therefore deserves further attention. In this paper, we present a more in depth investigation of SU Lyn in the X-ray and UV domains using coordinated NuSTAR and Swift observations.
2 Observations
While Mukai et al. (2016) investigated the hard X-ray properties of SU Lyn using Swift BAT data, the sensitivity of this instrument is such that it takes months of integration to securely detect this source (Mukai et al. used 120 d bins in their Figure 1, showing the BAT light curve). The best S/N, integrated over the high state in the 15-35 keV range, is 16.3. Since we must divide these data into multiple energy bins for spectral analysis, hard X-ray spectral parameters of SU Lyn cannot be tightly constrained using Swift BAT.
We therefore observed SU Lyn with the Nuclear Spectroscopic Telescope Array (NuSTAR; Harrison et al., 2013) mission. The total exposure time of about 40.9 ks, for both Focal Plane Modules A and B (FPMA and FPMB), was spread over approximately 80 ks on 2016 August 12-13 (ObsID 30201025002; Table 1). During about 9.4 ks out of that time, we also observed it using the Neil Gehrels Swift Observatory (Gehrels et al., 2004) using both X-Ray Telescope (XRT) and UltraViolet and Optical Telescope (UVOT) instruments (ObsID 00081892001). We added to our analysis the Swift/UVOT (ObsID 00034150001, taken on 2015 November 20) and BAT data of SU Lyn investigated by Mukai et al. (2016) to perform a comparative study of the state of the source in UV and X-rays.
We used the XRT in photon counting (PC) mode because the expected X-ray flux was modest. However, the CCD detector for the XRT is also sensitive to optical and near-infrared photons, and lead to a phenomenon called optical loading 111http://www.swift.ac.uk/analysis/xrt/optical_loading.php. When numerous optical/near IR photons land on the same pixel during a single CCD exposure, the total amount of charge resulting from this can resemble that from a single, soft X-ray photon. This can result in spurious events at soft energies. Such a soft component is seen in the 2016 August XRT data on SU Lyn.
In addition, the on-board software uses the distribution of charges across neighboring pixels to distinguish between X-ray events and particle hits. True X-ray photons lead to a tightly clustered set of charges (single pixel to a 2x2 square), while particle hits tend to leave charges in multiple adjacent pixels. In the presence of optical loading, X-ray photons can be misinterpreted as having particle hit-like distribution of charges, and therefore be rejected in standard screening. During both 2015 and 2016 observations of SU Lyn, while the events in the unscreened files have a point spread function (PSF) like spatial distribution, the cleaned files have a more diffuse appearance with a central hole. We conclude that optical loading led to the loss of true X-ray event, and distortion of pulse height distribution of X-ray events that survive the screening. We therefore did not use the XRT data in this paper, and also conclude that the X-ray spectral parameters of SU Lyn derived from Swift/XRT data by Mukai et al. (2016) are unreliable, thereby making the NuSTAR data the first reliable X-ray spectra of SU Lyn.
Data reduction and analysis were carried out with heasoft version 6.22 using the specific tools for each mission and calibration files available in August 2017 and December 2017 for the NuSTAR and Swift data, respectively. For the NuSTAR data we applied the nupipeline and then the nuproducts to obtain science products, while for the Swift/UVOT data we used the tasks coordinator, uvotscreen, xselect, and uvotevtlc. The typical absolute astrometric uncertainty of the NuSTAR is 8, with a usual relative offset of 5-10″ for one NuSTAR module with respect to the other – drifting on time depending essentially on the thermal condition and therefore on the illumination of NuSTAR by the Sun (Brian Grefenstette; priv. commun.). Thus, we use different extraction regions for FPMA and FMPB based on their individual images.
The spectral analysis was conducted with the X-ray spectral fitting package xspec v12.9.1m. It was based on simultaneous fits of NuSTAR FPMA and FPMB data from the minimum detector threshold of 3 keV (Madsen et al., 2015, and references therein) to 30 keV, since background dominates at higher energies. The energy binning was set to have a minimum of 25 counts in each bin. A multiplicative constant was applied for each dataset in xspec to account for possible cross-calibration uncertainties but the difference is limited to 5%. The BAT dataset was important to characterize the photometric variability of the system. All errors and comparisons discussed in this work are at a 1 confidence level.
| NuSTAR | Swift | |
|---|---|---|
| ObsID | 30201025002 | 00081892001 |
| Start Time | 2016-08-12 20:16:08 | 2016-08-12 22:28:58 |
| Stop Time | 2016-08-13 17:36:08 | 2016-08-13 10:41:52 |
| Exposure | 40920 s | 9411 s |
3 Results
3.1 X-ray spectral energy distribution
We constructed two spectra from the whole NuSTAR observation, one from the FPMA and another from the FPMB data, then fitted simultaneously with xspec (Figure 1). Their shape and the clear presence of emission lines of the Fe K complex around 6.7 keV reinforces three characteristics previously reported by Mukai et al. (2016) that are investigated in detail in this work: hard, thermal, and locally absorbed X-ray emission.
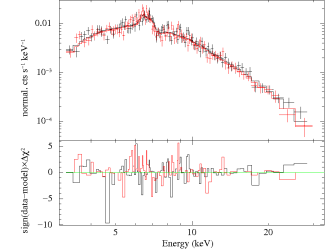
We adopt the tbabs model to account for the photoelectric absorption (Wilms et al., 2000). Two models based on thermal plasma emission were individually applied to test two different hypotheses: the emission from a single-temperature plasma component (apec) and the emission from a cooling-flow plasma (mkcflow). The abundance table applied in the models is that of Wilms et al. (2000). For comparison, we find that the use of such a table results in mutually consistent temperatures (Ts) but absorption columns (in equivalent Hydrogen column, NH) and abundances that are systematically higher by 52% and 75%, respectively, with respect to the values obtained from Solar abundance vector set to Anders & Grevesse (1989). In all cases, we added a Gaussian line (gaussian) to account for the excess due to the fluorescence Fe line at 6.4 keV. As the line parameters are not well determined during the fit, the centroid was fixed at the rest energy value and the line width () was fixed to 1 eV, while the normalization was a free parameter during the fit.
Single-temperature plasma and cooling-flow spectral models both provided acceptable fits to the NuSTAR spectra. We first attempted to fit the spectra with the simplest model, tbabs*(apec+gauss) (M1). We found that the spectrum of SU Lyn is well described by a plasma with temperature (T) of 12.0 keV and abundance () of 0.90 relative to solar values (). The photoelectric absorption is equivalent to a Hydrogen column (NH) of 19.8 1022 cm-2. The ionized lines of the Fe K complex are well described by M1. This fit results in equal to 1.09 for 182 degrees of freedom (d.o.f).
The other model, tbabs*(mkcflow+gauss) (M2), did not significantly improve the fit. M2 resulted in NH = 23.3 1022 cm-2 and = 0.75 . As the low energies are not covered by the NuSTAR spectra, we fixed the low temperature component of the mkcflow to its lower limit of T = 80.8 eV. The maximum temperature parameter of this model has TH = 21.1 keV. The obtained from M2 is 1.07 for 182 degrees of freedom. For M2 we set the switch parameter to 2, such that the mkcflow model, originally based on the mekal code, was calculated by running the apec (AtomDB) table. We adopt a redshift of 1.4910-7 for the mkcflow component of M2 and the default cosmology parameters in xspec (H0 = 70 q0 = 0, and = 0.73) – to take into account the distance of the system, which Mukai et al. (2016) estimated to be 640 pc (consistent with the Gaia DR2 parallax of mas; Gaia Collaboration et al., 2016, 2018). We tested the inclusion of a partial covering fraction absorption (pcfabs), which is sometimes present in other symbiotic systems, but the fit was not improved. Table 2 summarizes the spectral parameters from the models cited above.
| Parameter | apec | ||
|---|---|---|---|
| (1022 cm-2) | 19.8 | 18.3 | |
| (keV) | 12.0 | 9.9 | |
| () | 0.90 | 0.72 | |
| relrefl | … | 1.0 | |
| /d.o.f. | 1.09/182 | 1.08/181 | |
| F | 9.60.8 | 9.31.0 | |
| mkcflow | |||
| (1022 cm-2) | 23.3 | 22.5 | |
| (keV) | 21.1 | 16.3 | |
| (keV) | 0.0808 | 0.0808 | |
| () | 0.75 | 0.59 | |
| relrefl | … | 0.9 | |
| /d.o.f. | 1.07/182 | 1.07/181 | |
| F | 10.01.3 | 9.91.1 | |
a Fluxes are unabsorbed and in units of 10-12 erg cm-2 s-1;
The models are M1 [tbabs*(apec+gauss)]
and M2 [tbabs*(mkcflow+gauss)], in the second column, and
the same but with the thermal component convolved with a reflect component
in the third column.
3.2 Reflection and consequences for the derived plasma properties
Although the inclusion of the reflection component does not improve the goodness of the fit with respect to “pure” models, our spectral fitting indicates that this component could be present in SU Lyn. We used the reflect model in xspec in order to check for the presence of a Compton hump that could be due to “reflection” of intrinsic X-rays over the white dwarf or nearby cold material. This component was convolved by the thermal components in M1 and M2. We assumed that the abundance of the reflect component, including the iron abundance, was equal to the abundance of the corresponding thermal component and allowed them to vary while linked during the fit.
Allowing the reflection scaling factor to vary during the fitting resulted in values equal to 0.98 and 0.87 from M1 and M2, respectively. The inclination angle between the normal to the reflector and the line of sight (Magdziarz & Zdziarski, 1995) was not constrained in the fit, so we set it such that cos() = 0.45. With the inclusion of reflection, the best-fit value is lower than in the fit without reflection. Although the 1 error ranges overlap, the best-fit temperature without reflection (21.1 keV) is outside the range obtained with reflection (13.6–20.5 keV), and vice versa (16.3 keV and 19.2–23.7 keV; see Table 2). In general, when the statistical quality of the data is higher, the drop in T with the addition of a reflection component is statistically significant (as was the case with RT Cru; Luna et al., 2018). So we advise caution when the white dwarf mass is derived exclusively using fits without reflection. In this work, we present analyses with and without reflection.
The spectrum of SU Lyn is marked by a noticeable excess due to the fluorescent and ionized lines of the Fe K complex. We inferred a line intensity of (1.80.3) photons cm-2 s-1 and equivalent width (EW) of 150-380 eV for the fluorescent Fe line at 6.4 keV. The measured equivalent width does not allow us to distinguish the cases with or without reflection because its lower limit is still consistent with the contribution being only due to the local X-ray absorber (see Figure 7 of Ezuka & Ishida, 1999), while the higher end of allowed values would appear to require the contribution from both the absorber and reflection.
3.3 Photometric and spectral variability
3.3.1 X-ray photometric variability
SU Lyn is a variable X-ray/UV source and therefore caution is required when investigating properties from spectra that accumulate information acquired over long time scales – because the long-term variability is energy dependent. However, following the expectation that the plasma temperature – which strongly depends on the gravitational potential well promoted by the WD – is not variable, and that the absorption has little effect in hard X-rays, we compare the NuSTAR spectrum with the BAT averaged spectrum constructed by co-adding observations from 2004 December 8 to 2016 January 11, which is the average of “normal state” and “high state” (Mukai et al., 2016). Both can be described by the same model being the only noticeable difference associated to the flux that drops during the NuSTAR observation (Section 3.3.1). The corresponding mean flux from the averaged BAT spectrum was obtained by integrating the absorbed APEC model (M1) in a simultaneous fit of the NuSTAR and BAT spectra.
Although the average BAT spectrum still had a low signal-to-noise, this exercise showed that the NuSTAR flux at the 15-35 keV energy range in 2016 August (of about 2.510-12 erg cm-2 s-1) was about 47% of the flux derived from the BAT observations between 2004 and 2016 (of about 5.310-12 erg cm-2 s-1). Repeating the exercise with the BAT spectrum corresponding to the time interval associated to the high state of SU Lyn described by Mukai et al. (2016), we found that the 15-35 keV flux during the NuSTAR observations in 2016 August corresponds to 14% of the high state observed with Swift/BAT between 2010 October 14 and 2012 August 1 ( 1.810-11 erg cm-2 s-1). In both cases, using the “averaged” or “high state” BAT spectrum in the simultaneous fit with the NuSTAR spectra, the values obtained for the absorption column, temperature, and abundance are fully consistent with those presented in Table 2. As presented by Mukai et al. (2016), the normal state before and after the high state was about 1/2 of the “averaged” flux, hence SU Lyn in 2016 August appears to have been at a similar hard X-ray luminosity level as the normal state.
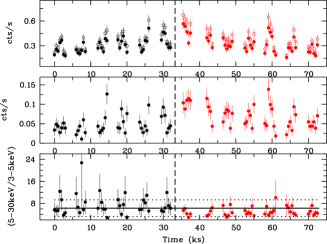
Variability on a shorter timescale ( 100 s) was accessible from the NuSTAR observation. Figure 2 presents the light curve in the widest possible energy range (3–30 keV; open circles in the top panel). It also includes two other light curves from the hardest (5–30 keV; top panel) and softest (3–5 keV; middle panel) photons and the corresponding hardness ratio (hard/soft; bottom panel). All light curves were constructed by combining the FPMA and FPMB data in time bins of 500 s. Both soft and hard light curves are marked by variations up to a factor 2.5 on timescales as short as 500 s. There is marginal evidence from the photometry that SU Lyn exhibits spectral evolution with time, especially when comparing the first and second halves of the observation. Figure 2 (bottom) suggests that the hardness ratio is more variable and on average higher during the first half, indicating a higher fraction of hard X-rays or lower fraction of soft X-rays in comparison with the rest of the observation. While the suspicion of fast variability (of about 500 s) cannot be accessed, with the flux being consistent with the mean value at a 1 level even from the photometry (horizontal lines at the bottom of Fig. 2), the variability in 10 h can be investigated from spectroscopy. We return to latter point in the Section 3.3.3.
3.3.2 Search for period modulation in X-rays
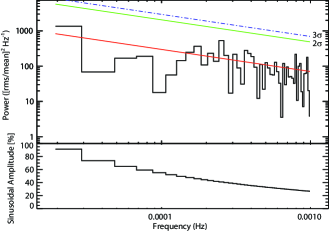
We searched for periodic modulation in X-rays by investigating the Fourier power spectrum of the 3-30 keV NuSTAR (FPMA+FPMB) light curve binned in 500 s. A simple power law model was applied to describe the log-log power spectrum from 10-5 to 10-3 Hz and a deviation at a 3 level was obtained by following the method outlined by Vaughan (2005). Also, the upper limits on the sinusoidal fractional amplitude as a function of frequency were calculated following equation 13 in Israel & Stella (1996). Since no peak exceeds a 3 detection threshold, there is no evidence for periodic modulation from the NuSTAR data (Fig. 3).
3.3.3 Evaluating X-ray spectral evolution
Figure 2 (bottom) suggests that the X-ray hardness ratio of SU Lyn was on average higher during the first half of the observation. To evaluate this suspicion, we split the observation into two segments and performed spectral analysis on each segment separately, with a pair of FPMA and FPMB spectra from the first 6 orbits and another pair from the rest (7 orbits). The vertical line in Fig. 2 shows where we split the data and Fig. 4 shows the corresponding unfolded spectra (only FPMA, for clarity) – with both following the same colour code.
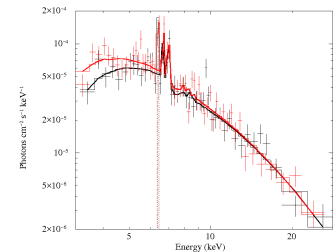
We consider two cases using M2 (both without reflection). In the first one, the plasma parameters were frozen to those presented in Table 2 (T = 21.1 keV and = 0.75 ). It resulted in NH = 28.4 1022 cm-2 for the first half and NH = 20.6 1022 cm-2 for the second half of the observation (/d.o.f = 1.07/89 and /d.o.f = 1.16/111, respectively). Then we considered a second case in which the temperature was free during the fit, resulting in NH = 28.4 1022 cm-2 and T = 21.1 keV with /d.o.f = 1.08/88 for the first half, and NH = 22.1 1022 cm-2 and T = 19.2 keV with /d.o.f = 1.16/110 for the second one.
This analysis reveals a significant decrease in the local absorption by about 25% on a timescale of 10 hours, while the properties of the X-ray emitting plasma remained essentially the same, including the unabsorbed flux. Similar results are obtained with M1. The impact of the absorption on the continuum can be seen up to 5 keV (Figure 4 shows the unfolded spectra for the first case cited above, with parameters frozen).
3.3.4 UV photometric variability
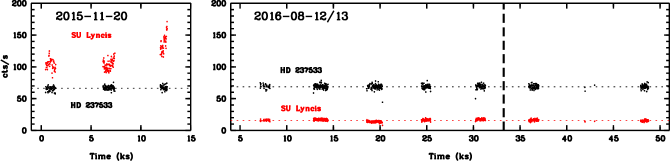
We compared the recent dataset with that collected five months earlier also with the UVM2 filter, and reported by Mukai et al. (2016). Following the procedure adopted by those authors, we use HD 237533 as a comparison star. Figure 5 shows the UV light curves of both SU Lyn and HD 237533. While the count rate of the comparison star remained essentially constant during both campaigns (66.40 3.40 counts s-1 and 68.62 4.64 counts s-1 for the whole first and second observations, respectively), the brightness of SU Lyn had decreased by a factor of about 8.7 when comparing the mean value registered during the last orbit on 2015 November 20 (137.51 13.34 counts s-1) and that from the orbits on 2016 August 12/13 (15.84 1.85 counts s-1).
Individually, the mean count rates for each orbit of the 2016 observation are consistent at a 1 level with the mean value from the whole light curve. This is also true when dividing the UVOT data into two portions (see the vertical line in Fig. 5, which markes the same time as the vertical line in Fig. 2) – with the first portion having been conducted during the first half of the NuSTAR observation and the second portion carried out during the second half of the NuSTAR observation explored in Section 3.3.3. The first portion corresponds to five Swift orbits, with a mean count rate of 15.862.04 counts s-1, while the second portion was covered by three orbits, from which the mean count rate was 15.581.90 counts s-1. Thus, contrary to X-rays, the first and second portions of the observation in UV remained essentially the same and were consistent with the mean value for the whole light curve, even with the 25% drop in the NH affecting the X-rays. However, a difference of about 20% in count rate can be present from one orbit to another, as seen between the second (17.091.28 counts s-1) and third (13.491.33 counts s-1) orbits.
The fractional RMS level of SU Lyn in the Swift/UVOT campaign on 2016 remained essentially constant from one orbit to another, ranging from 7.5 per cent to 9.8 per cent, and about 12 per cent for the whole UV light curve. This is consistent with the values pointed out by Mukai et al. (2016) for the UVOT campaign carried out in November 2015.
4 Discussion
SU Lyn is marked by a hard thermal X-ray emission of moderate luminosity, which is affected by strong and variable local absorption. Both X-ray and UV fluxes vary on short and long timescales. In the following, we discuss the properties of the system as inferred from NuSTAR X-ray spectroscopy and in the light of a dramatic decrease in the LUV/LX ratio observed over the course of 9 months.
4.1 From the X-ray spectroscopy of SU Lyn
Our analysis showed that both single-temperature (apec) and cooling plasma (mkcflow) models describe well the X-ray spectrum of SU Lyn (Table 2). However, a single temperature plasma model is unphysical: thermal emission cools the plasma, for one thing, and a thermal plasma cannot settle onto the white dwarf until it cools to the photospheric temperature, for another. Such a cooling flow is exactly the situation that the mkcflow model represents, with some simplifying assumptions, meaning that this is a more realistic physical model of the X-ray emission from SU Lyn (see Mukai, 2017) for a more complete discussion). Moreover, direct evidence for a multi-temperature plasma in another symbiotic star with -type X-ray emission was provided by the Chandra observation of V658 Car (Eze et al., 2010). While a cooling flow can be associated with either an accretion column or a boundary layer in an accretion disk, the lack of periodic X-ray modulations disfavors magnetic accretion and argues in favor of accretion through a boundary layer.
The cooling flow model reveals a maximum temperature T approximately equal to 21 keV, or 16 keV if reflection of hard X-rays in cold material is present. The data are consistent with either models with or without reflection, as judged by the continuum shape (i.e., whether a Compton reflection hump is present) and by the strength of the fluorescent 6.4 keV line. With or without reflection, the unabsorbed flux implies a luminosity of 4.91032 erg s-1 at the 3–30 keV energy band, assuming a distance of 640 pc. Extrapolating the NuSTAR response to 0.1-100 keV, we estimate the bolometric luminosity to be 7.41032 erg s-1 and 9.81032 erg s-1 for apec and mkcflow based models, respectively.
The maximum temperature in the boundary layer suggests that the mass of the white dwarf is at least about 0.8 M⊙. In non-magnetic accreting systems in which an accretion disk is formed, approximately half the potential energy of the falling matter is radiated away in the disk where the Keplerian velocity corresponds to (1/2)2 times free-fall velocity. Assuming that this is the modus operandi for SU Lyn, the maximum shock temperature (Ts,max) comes from the X-ray spectral fits using the mkcflow model (M2 in Section 3.1) and allows us to estimate the white dwarf mass (MWD). Doing this, we calculate half of the total energy from free-fall from infinity following Frank et al. (2002), assuming the mass-radius relation for white dwarfs suggested by Pringle & Webbink (1975). Factors such as rapid rotation, high core temperature, and high envelope temperature can all modify the mass-radius relationship in principle. However, they all go in the direction of larger radii, and hence the lower limits we derive below on the white dwarf mass and the mass accretion rate are secure. This theoretical approach was successfully applied by Byckling et al. (2010) to explain the locus occupied by a sample of dwarf novae in the MWD versus Ts,max diagram. Our results indicate that the mass of the white dwarf in SU Lyn is consistent with 0.87 M⊙ for Ts,max = 21.1 keV (from the mkcflow model), and can be 14% less, 0.76 M⊙ if reflection is present (Section 3.2). From this model, the mass accretion through the optically thin portion of the boundary layer is approximately equal to (1.80.3)10-10 M⊙ yr-1, or (2.00.2)10-10 M⊙ yr-1 if reflection is present. When the UV luminosity exceeds the X-ray luminosity, part of the boundary layer is likely optically thick, and therefore the values above correspond to lower limits for the mass accretion rate.
4.2 From the spectral and photometric variability
Our observations show that in 2016 the UV emission from SU Lyn had dropped after the high state in 2015 reported by Mukai et al. (2016). These authors reported from Swift/UVOT and GALEX data that SU Lyn is variable in UV on timescales as short as tens of seconds with a fractional variability of 7–10 per cent. They reported from GALEX data that SU Lyn was much fainter in UV on 2006 December 21 and 2007 January 27 than Swift/UVOT showed it to be on 2015 November 20. In the Swift/UVOT data, Mukai et al. (2016) also observed that the UVM2 count rate increased by about 30 per cent within 95 minutes from the second to the third and last orbit of the campaign on 2015 November 20 (Fig. 5, left).
We show here that SU Lyn underwent a dramatic decrease by a factor 8.7 in the UV flux on an unknown timescale but which is constrained to be less than 9 months, the elapsed time between the two recent Swift/UVOT observations (2016-08-12 and 2015-11-20; Fig. 5). The low state lasted for at least 11.6 hours. We refer to this behavior as “long-term variability”, if not for the timescale on which it occurred, then for the duration of the states. It corresponds to a change from (1.160.11)10-13 erg s-1 cm-2 Å-1, to (1.340.16)10-14 erg s-1 cm-2 Å-1, in the spectral range covered by the UVM2 filter, and therefore to a drop in the total UV at 2000–4000Å from 2.310-10 erg s-1 cm-2 to 2.710-11 erg s-1 cm-2. In terms of luminosity, these values correspond to 1.11034(/640 pc)2 erg s-1 and 1.31033(/640 pc)2 erg s-1, respectively. In contrast, the hard X-ray flux observed with NuSTAR in 2016 in the 15-35 keV energy band is similar to that seen with Swift/BAT during the normal state, as defined by Mukai et al. (2016).
The intervening column affecting X-rays changed significantly from 281022 cm-2 to 211022 cm-2 in the course of the NuSTAR observation (Section 3.3.3), proving that changes may happen on timescales as short as 10 ks. It suggests that the spikes in the hardness ratio (Fig. 2; bottom) are associated with a decrease of softest X-rays (3–5 keV) caused by an increase of the photoelectric absorption that, on average, results in a higher column for the first half than that for the second half of the observation. In this case, the “instantaneous” absorption in the short period of time associated with the “hardness spikes” may be even higher than the inferred value. What could be causing this variation? Despite the complexity in the absorption with time, the X-ray spectrum (3–30 keV) is well described for a simple absorption component. Although this can only be confirmed by sensitive observations including softest X-rays, the results suggest that the intervening material may be inhomogeneous but relatively well distributed over the X-ray emitting sites.
As for SU Lyn, there is also evidence that X-rays of -type symbiotics as a whole suffer the effect of local absorbers that are variable on a day to day time scales. Regardless of whether this is due to spatial inhomogeneities or due to temporal changes, the timescale of the NH variability can be used to constrain the origin of the absorber. In particular, it is unlikely to be the wind of the mass donor: the binary likely has a scale of AU, and the wind of a red giant has a characteristic velocity of order 10 km s-1, so it would be difficult for this to lead to variable NH on timescales much shorter than 1 AU / 10 km s-1 6 months. An origin much closer to the white dwarf is indicated.
The local X-ray absorber does not appear to absorb the UV emission from SU Lyn, as evidenced by the lack of detectable changes in UV count rates between the first and second halves of the NuSTAR observation, when the local X-ray absorber varied significantly. We can understand this in the context of localized absorbers in two possible ways. If the absorber is extremely localized, right next to the X-ray emission region (presumably the boundary layer between the disk and the white dwarf), then it might not obstruct our view of the UV emission region (parts of the Keplerian accretion disk proper). Alternatively, the X-ray absorber might cover both the X-ray and UV emitting regions but may be transparent to UV. This is possible because UV absorption in the ISM is due to dust and molecules, while that in interacting binaries may be due to 10,000K material (“Fe II Curtain”; Horne et al., 1994) and the localized absorber in SU Lyn may well be too hot for either.
4.3 The scenario
Whereas the Keplerian part of the accretion disk accounts for the UV radiation, the boundary layer accounts for the X-rays. Mukai et al. (2016) suspected that the boundary layer during the Swift observation on 2015 November 20 was at least partially optically thick to X-rays – implying that the WD mass estimate they obtained from X-rays, 1 M⊙, is a lower limit. Changes in the ratio of LUV to LX give us clues about the physical conditions in the boundary layer. Assuming that the observed UV is not subject to strong intrinsic absorption, as is the case for the X-ray photons in the 15-35 keV energy regime, we use the LUV/L as a proxy of the boundary layer conditions. The NuSTAR flux was similar to that during the normal state as seen by BAT (2004 December 8 through 2010 October 13, and 2012 August 2 to 2016 January 11; see Figure 1 of Mukai et al., 2016). Since the 2015 November Swift observations took place during the normal state, the instantaneous X-ray flux at that time was probably similar to the NuSTAR measurement; however, we cannot be certain due to the optical loading issue affecting the XRT data.
Therefore L was formally constant (about 1.21032(/640 pc)2 erg s-1) while LUV dropped from 1.1 1034(/640 pc)2 erg s-1 to 1.31033(/640 pc)2 erg s-1, with LUV/L changing from 84 to 11. Even in a narrow band (2000–4000 Å) the UV luminosity exceeds the estimated bolometric X-ray luminosity (estimated to be 9.81032(/640 pc)2 erg s-1), whereas in the case of an optically thin boundary layer, it is expected that X-ray emission roughly equals the bolometric disk luminosity. These UV and X-ray features suggest: (i) a substantial decrease in the total mass accretion rate and (ii) that more of the boundary layer became optically thin to X-ray photons, so that any decrease in X-ray luminosity that we might have expected from the drop in accretion rate was compensated for by the increased fraction of the boundary layer emitting in the X-ray regime.
5 Summary
The main findings of this paper came from the first reliable X-ray spectroscopy of SU Lyn and complementary UV photometry. They are:
-
1.
The hard X-ray spectrum is consistent with the presence of reflection of hard X-rays from cold material, with reflection amplitude (R) equal to 1.
-
2.
We revised the WD mass estimate from Mukai et al. (2016) taking into account the effects of the reflection component, with R = 1 and R = 0 fits resulting in a minimum mass between about 0.7 and 0.8 M⊙, respectively.
-
3.
We identified strong and variable intrinsic X-ray absorption, with rapid variability suggesting that the absorber is near the accreting white dwarf.
-
4.
The X-ray absorber appears not to absorb UV. This implies that the absorber is extremely localized, predominantly in the line of sight of the primary X-ray emitter, and/or significantly ionized, and therefore without molecules and dust that could affect the UV photons.
-
5.
Between 2015 November and 2016 August, the LUV/LX ratio dropped dramatically, supporting a decrease in accretion rate while the boundary layer became more optically thin.
We encourage further observations of SU Lyn to refine our findings and to take further advantage of its long-term variability to study the response of accretion disk and the boundary layer to changes in accretion rate.
References
- Anders & Grevesse (1989) Anders, E., & Grevesse, N. 1989, Geochim. Cosmochim. Acta, 53, 197
- Byckling et al. (2010) Byckling, K., Mukai, K., Thorstensen, J. R., & Osborne, J. P. 2010, MNRAS, 408, 2298
- Eze et al. (2010) Eze, R. N. C., Luna, G. J. M., & Smith, R. K. 2010, ApJ, 709, 816
- Ezuka & Ishida (1999) Ezuka, H., & Ishida, M. 1999, ApJS, 120, 277
- Frank et al. (2002) Frank, J., King, A., & Raine, D. J. 2002, Accretion Power in Astrophysics: Third Edition, 398
- Gaia Collaboration et al. (2018) Gaia Collaboration, Brown, A. G. A., Vallenari, A., et al. 2018, ArXiv e-prints, arXiv:1804.09365
- Gaia Collaboration et al. (2016) Gaia Collaboration, Prusti, T., de Bruijne, J. H. J., et al. 2016, A&A, 595, A1
- Gehrels et al. (2004) Gehrels, N., Chincarini, G., Giommi, P., et al. 2004, ApJ, 611, 1005
- Harrison et al. (2013) Harrison, F. A., Craig, W. W., Christensen, F. E., et al. 2013, ApJ, 770, 103
- Horne et al. (1994) Horne, K., Marsh, T. R., Cheng, F. H., Hubeny, I., & Lanz, T. 1994, ApJ, 426, 294
- Israel & Stella (1996) Israel, G. L., & Stella, L. 1996, ApJ, 468, 369
- Kenyon (1986) Kenyon, S. J. 1986, The symbiotic stars
- Luna et al. (2013) Luna, G. J. M., Sokoloski, J. L., Mukai, K., & Nelson, T. 2013, A&A, 559, A6
- Luna et al. (2018) Luna, G. J. M., Mukai, K., Sokoloski, J. L., et al. 2018, ArXiv e-prints, arXiv:1801.02492 [astro-ph.SR]
- Madsen et al. (2015) Madsen, K. K., Harrison, F. A., Markwardt, C. B., et al. 2015, ApJS, 220, 8
- Magdziarz & Zdziarski (1995) Magdziarz, P., & Zdziarski, A. A. 1995, MNRAS, 273, 837
- Mukai (2017) Mukai, K. 2017, PASP, 129, 062001
- Mukai et al. (2016) Mukai, K., Luna, G. J. M., Cusumano, G., et al. 2016, MNRAS, 461, L1
- Pringle & Webbink (1975) Pringle, J. E., & Webbink, R. F. 1975, MNRAS, 172, 493
- Vaughan (2005) Vaughan, S. 2005, A&A, 431, 391
- Wilms et al. (2000) Wilms, J., Allen, A., & McCray, R. 2000, ApJ, 542, 914