DLA and sub-DLA metallicity evolution: A case study of absorbers towards Q 0338-0005
Abstract
The damped and sub-damped Ly systems (DLAs and sub-DLAs) traced in absorption against bright background quasars represent the main reserve of neutral hydrogen at high redshifts. We used the archival Very Large Telescope (VLT) instrument Ultraviolet and Visual Echelle Spectrograph (UVES) high-resolution data of Q 0338-0005 () to study abundances of the DLA () and sub-DLA () along the line of sight. We estimated column densities of H i and various elements present in the DLA and sub-DLA through Voigt profile fitting. The DLA throgh shows the Ly emission from the its host galaxy. We derive the metallicities of the DLA and sub-DLA with [Zn/H] and [S/H] , respectively. We compared our abundances of the DLA and sub-DLA with other high resolution DLA and sub-DLA metallicities and find that both populations show an overall increase of metallicity with decreasing redshift. However, sub-DLAs usually have higher metallicities than the DLAs.
keywords:
Galaxies; abundances - galaxies; ISM - quasars; absorption lines - intergalactic medium1 Introduction
Quasar lines of sight provide a wealth of information about intergalactic medium and galaxies through the analysis of absorption line systems along with their sightlines. The detection of damped Lyman- systems (DLAs; log N(H i) cm-2) and sub-damped Ly systems (sub-DLAs; log N(H i) ) against luminous background quasars does not depend on the brightness of associated galaxies rather on the cross-section of neutral hydrogen gas (e.g., Wolfe et al. 1986, 2005). These systems represent the main source of neutral hydrogen at higher redshifts (e.g., Storrie-Lombardi & Wolfe 2000; Noterdaeme et al. 2009; Zafar et al. 2013a). Moreover, these are excellent laboratories, to study metals, dust, molecules, and to estimate the cosmological evolution of H i gas mass density.
Evolution and formation of galaxies is a key aspect in current observational cosmology and especially the gradual build-up of metallicity over cosmological time (e.g., Sommer-Larsen & Fynbo 2008). DLA surveys also reported systematic absorption from neutral and ionised species (N i, Al ii, O i, Fe ii, S ii, Si iv, C iv etc.), demonstrating a complex interstellar structure observed in galaxies at present time (Wolfe & Prochaska 2000; Dessauges-Zavadsky et al. 2003; Fox et al. 2007a, b; Zafar et al. 2014b, a). To understand absorption gas properties, high resolution spectroscopy is crucial to better estimate the metal column densities. Sub-DLAs are found to have super-solar metallicities compared to the DLAs (Kulkarni et al. 2007). Therefore, it is important to compare both absorbers over redshifts to study their metal evolution to understand the metal budget at high redshifts. We here use the Very Large Telescope (VLT) Ultraviolet and Visual Echelle Spectrograph (UVES) data of quasar Q 0338-0005 (RA: 03 38 54.78 Dec: 05 20.99; ) reported in Zafar et al. (2013b) to study the DLA at and a sub-DLA at along its line of sight. The hydrogen column densities of both damped absorbers are published by Noterdaeme et al. (2009) with log N(H i) of the DLA and log N(H i) of sub-DLA. These column densities are derived from the low-resolution data from the Sloan Digital Sky Survey (SDSS) Data Release (DR) 12. In this work, we estimated metallicities for both systems and compared them with other DLAs and sub-DLAs from literature to study metallicity evolution.
2 Methods
The high-resolution VLT/UVES (Dekker et al. 2000) spectroscopic data for Q 0338-0005 is taken under the programmes 074.A-0201(A) (PI: Srianand) and 080.A-0014(A) (PI: Lopez) with BLUE346, BLUE437, RED570, and RED760 settings. The wavelength coverage of the combined spectrum is 3030–9460 Å with a spectral resolution () of 90,000 and 110,000 for BLUE and RED arm, respectively. Standard UVES pipeline has been used to reduce data (Ballester et al. 2000). Individual spectra are merged and normalised within the ESO-MIDAS environment. Local continuum of the merged spectrum was determined by using spline function passing through the spectral regions and smoothly connecting the regions free from absorption lines. This is done to perform the column density analysis of the absorption lines. Because of multiple spectra obtained, the good signal-to-noise regions are 3760–4998 Å, 5680–7500 Å, and 7662–9320 Å.

At redshift of DLA () and sub-DLA () we identify several metal absorption lines spread in the quasar spectrum. We identify lines from O i ( Å), Fe ii ( Å), Si ii ( Å), Zn ii ( Å), Cr ii ( Å), and Mg ii ( Å) for the DLA which spread over twelve components. The lines from S ii ( Å), O i ( Å), Fe ii ( Å), Si ii ( Å), and Al ii ( Å) elements are identified for the sub-DLA spreading over four components.

We used the MIDAS Voigt profile fitting FITLYMAN package (Fontana & Ballester 1995) to fit H i column density and low-ionisation lines simultaneously. For the atomic data, laboratory wavelengths and oscillator strengths from (Cashman et al. 2017) were used. The FITLYMAN finds the best fit using a minimisation routine which fits the following function:
| (1) |
where Voigt function is defined by , is the speed of light, is the oscillator strength, is the classic radius of the electron, , with denoting damping coefficient and with and denoting Doppler thermal and turbulent broadening, respectively. The software includes the spectral resolution and returns best fit parameters for central wavelength (), column density (), Doppler thermal and turbulent broadening (collectively as ) and 1 errors in each quantity.
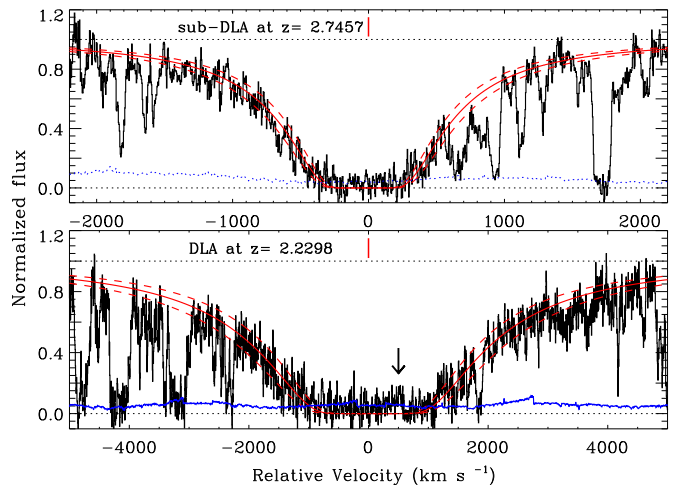
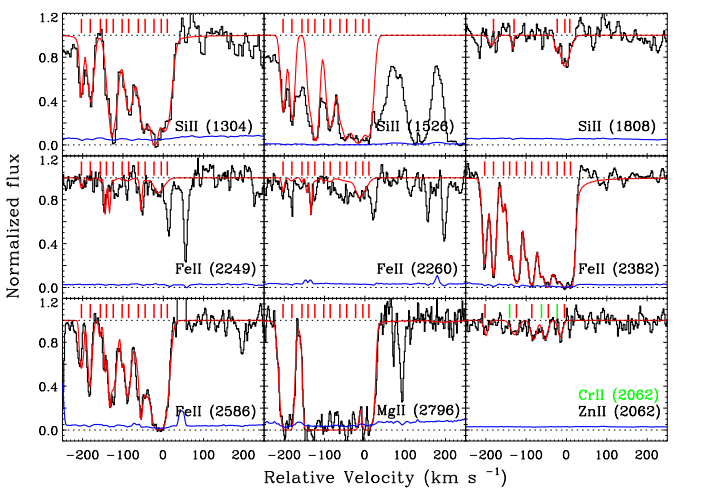
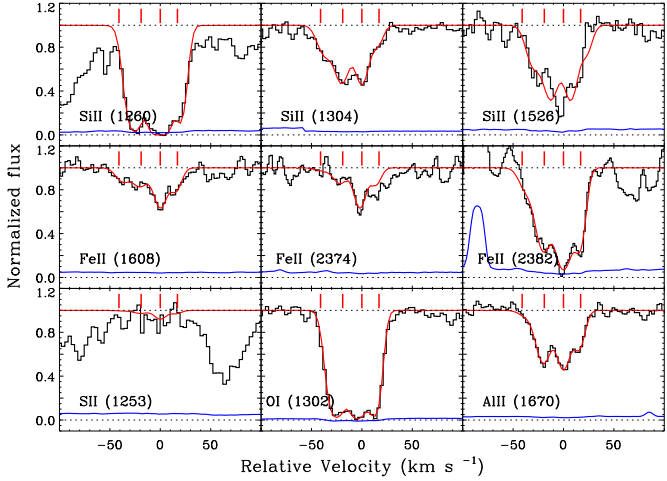
Using the high-resolution data, we again fit the H i column densities of damped absorbers again. We find the best-fit H i column densities for DLA () and sub-DLA () are log N(H i) cm-2 and log N(H i) cm-2, respectively (Fig. 1). Emission seen in the trough of the absorber is likely to correspond to the Ly emission from the DLA host (see e.g., Kulkarni et al. 2012; Rahmani et al. 2016; Zafar et al. 2017). The Ly emission from this DLA host galaxy is previously reported by Krogager et al. (2012) at impact parameters of arcsec. The metal column densities of both QSO damped absorbers derived by fitting the normalised spectrum of the quasar with the FITLYMAN Voigt profile fitting routine. The best fit results are provided in Table 1 for the DLA and Table 2 for the sub-DLA, respectively. The Tables provide for detected metals, the column densities in logarithmic form (log ) for each velocity component with a Doppler thermal and turbulent broadening (). The resulting best fits in red are shown overlaid on the VLT/UVES data for both DLA and sub-DLA towards Q 0338-0005 in Fig. 2 and Fig. 3, respectively.
| log N(Si ii/cm2) | log N(Fe ii/cm2) | log N(O i/cm2) | log N(Mg ii/cm2) | log N(Zn ii/cm2) | log N(Cr ii/cm2) | |
| km s-1 | 1304, 1526 | 2249, 2260 | 1302 | 2796, 2803 | 2026, 2062 | 2026, 2056 |
| 1808 | 2382, 2586 | 2062 | ||||
| log N(S ii/cm2) | log N(Si ii/cm2) | log N(Fe ii/cm2) | log N(O i/cm2) | log N(Al ii/cm2) | |
|---|---|---|---|---|---|
| km s-1 | 1253, 1259 | 1260, 1304, 1526 | 1608, 2374, 2382 | 1302 | 1670 |

The VLT/UVES resolving power is high enough to better resolve the lines within a few km/s. Weak lines, which are not saturated and lie on the optically thin region of the curve of growth, are used to extract accurate column densities. Strong lines have issues of saturation and because of this reason column densities derived from these are underestimated. Because of this reason, abundances of O i and Mg ii are considered to be lower limits. Individual element abundances in the neutral gas phase via comparison to the solar photospheric neighborhood (Asplund et al. 2009) are provided for the DLA and sub-DLA in Table 3. The hydrogen column densities derived from the UVES data are used to obtain the relative abundances.
| Absorber | Ion | log | [X/H] |
|---|---|---|---|
| cm-2 | |||
| DLA | Ly | ||
| Si ii | |||
| Fe ii | |||
| Mg ii | |||
| O i | |||
| Zn ii | |||
| Cr ii | |||
| sub-DLA | Ly | ||
| S ii | |||
| Si ii | |||
| Fe ii | |||
| O i | |||
| Al ii |
3 Discussion
The depletion of metal on to dust grain cause a fraction of refractory element (such as Fe, Si, Mg, and Al) to disappear from its gas phase. Si is marginally affected by dust depletion (Vladilo et al. 2011) out of the gas phase but is not strongly depleted when compared to other refractory elements like Fe and Cr (Ledoux et al. 2002; Draine 2003; Fynbo et al. 2010; Krogager et al. 2016). The best tracers of metallicity are zinc and sulphur. We looked for Zn ii absorption lines for both systems to have a reliable estimate of the metallicity. For sub-DLA, we cover only Zn ii (2062 Å) line between the good signal-to-noise regions, however, finding no significant detection. For DLA, we cover both transitional lines and detected Zn ii in 5 components (out of 12). We obtained Zn-based metallicity of DLA at and used S-based metallicity for sub-DLA at towards Q 0338-0005. This gives us an opportunity to compare the metal content of these classes of objects and study their evolution over redshift. In the era of large quasar surveys, where thousands of DLAs are reported in the literature (Noterdaeme et al. 2012), sub-DLAs are not much explored and studied. Indeed, high spectral resolution and high signal-to-noise are required to estimate elemental abundances at lower H i column densities of the sub-DLA. The studies of the high-resolution data available through spectrographs such as VLT/UVES are crucial to make our understanding better of the sub-DLAs and their properties.
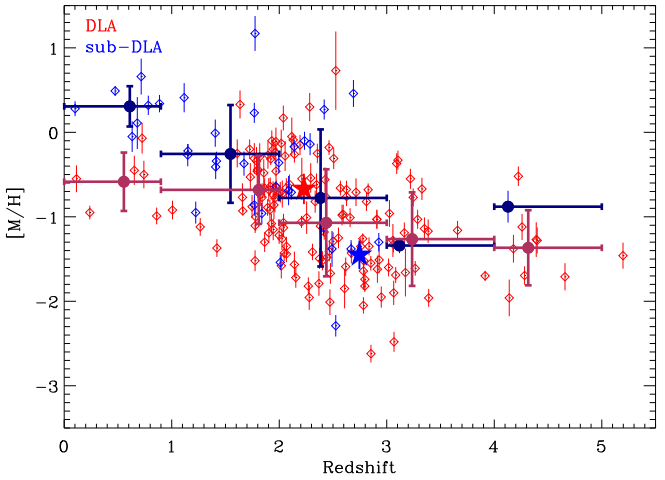
DLAs plus sub-DLAs together contain the majority of neutral gas mass in the universe (Zafar et al. 2013a). Therefore, these classes of absorbers are an excellent tool to estimate the cosmic metal budget throughout the cosmic history. In Fig. 4 we compared metallicities of the DLA and sub-DLA towards Q 0338-0005 (shown as stars) with the other DLAs and sub-DLAs metallicities available from the literature. We here used both Zn and S abundances as a tracer of metallicity because of their less inclination to go onto dust grains.
We collected Zn abundances for 122 and S abundances for 67 other DLAs and sub-DLAs from various high-resolution studies in the literature. In Fig. 4, the DLAs are shown in red colour and sub-DLAs in blue colour. The metallicities of both populations are compared with redshift to study the metal evolution. We binned the DLAs and sub-DLAs into five bins with a step-size of one in redshift. Central redshift for each bin, mean metallicity and standard deviation error (in quadrature) are plotted for both classes of damped absorbers. We have only one sub-DLA in each and bins, therefore, results are affected but low number statistics in those regions. Overall, the sub-DLAs have higher metallicities then DLAs. Although low statistics hinder to say much at high redshifts. Total sub-DLA metallicities reach near to the solar level at lower redshifts. Fig. 4 also indicate that the total metal budget of both DLA and sub-DLA is overall decreasing at higher redshift which is consistent with the fact that at short timescales the absorbers are not evolved enough to produce enough metals in their interstellar medium.

Previously, Kulkarni et al. (2007) consider a constant relative H i gas in DLAs and sub-DLAs at low and high redshifts. According to them, the contribution of sub-DLAs to total metal budget increases with decreasing redshift. We find consistent results here where we further find that contribution of sub-DLAs to the metal budget is usually higher. Bouché et al. (2007) reported that at , 17% of the metals are in sub-DLAs but their estimate is highly dependent on the ionised fraction of the gas. It is important to compare sub-DLA metallicities with those of DLAs as done in this work. Som et al. (2015) and Quiret et al. (2016) also compared metallicity of sub-DLAs with the DLAs and find a steeper increase of sub-DLA metallicity with decreasing redshift than the DLA one.
Not only observations present results of the total metal budget but also the chemical evolution models predict the metal budget. Models of cosmic chemical evolution claim that the global interstellar metallicity would decrease with increasing redshift such that the present day metallicity reaches the solar value Lanzetta et al. (1995); Pei & Fall (1995); Pei et al. (1999); Tissera et al. (2001). Our results and other studies suggest that sub-DLAs contribute substantially to the cosmic metal budget at all redshifts.
4 Conclusions
We estimated the column densities of various elements present in the DLA (at ) and sub-DLA (at ) along the line of sight of Q 0338-0005 using the VLT/UVES spectrum. We derived the H i column densities for both systems and detect Ly emission from the DLA host galaxy. We calculated metallicity of the DLA with [Zn/H] and sub-DLA with [S/H] . We put these damped absorbers in context with other high-resolution DLA and sub-DLA metallicities and find that both DLA and sub-DLA populations show an overall increase of metallicity with decreasing redshift. However, sub-DLAs have higher metallicities compared to the DLAs at all redshifts.
5 Acknowledgements
Based on the spectroscopic observations collected at the European Organisation for Astronomical Research in the Southern Hemisphere, 8.2 m Very Large Telescope (VLT) with the UVES instrument mounted at UT2 under ESO programmes 074.A-0201(A) and 080.A-0014(A).
References
- Asplund et al. (2009) Asplund, M., Grevesse, N., Sauval, A. J., & Scott, P. 2009, ARA&A, 47, 481
- Ballester et al. (2000) Ballester, P., Modigliani, A., Boitquin, O., et al. 2000, The Messenger, 101, 31
- Bouché et al. (2007) Bouché, N., Lehnert, M. D., Aguirre, A., Péroux, C., & Bergeron, J. 2007, MNRAS, 378, 525
- Cashman et al. (2017) Cashman, F. H., Kulkarni, V. P., Kisielius, R., Ferland, G. J., & Bogdanovich, P. 2017, ApJS, 230, 8
- Dekker et al. (2000) Dekker, H., D’Odorico, S., Kaufer, A., Delabre, B., & Kotzlowski, H. 2000, in Optical and IR Telescope Instrumentation and Detectors, ed. M. Iye & A. F. Moorwood, Vol. 4008, 534–545
- Dessauges-Zavadsky et al. (2003) Dessauges-Zavadsky, M., Péroux, C., Kim, T.-S., D’Odorico, S., & McMahon, R. G. 2003, MNRAS, 345, 447
- Draine (2003) Draine, B. T. 2003, ARA&A, 41, 241
- Fontana & Ballester (1995) Fontana, A. & Ballester, P. 1995, The Messenger, 80, 37
- Fox et al. (2007a) Fox, A. J., Ledoux, C., Petitjean, P., & Srianand, R. 2007a, A&A, 473, 791
- Fox et al. (2007b) Fox, A. J., Petitjean, P., Ledoux, C., & Srianand, R. 2007b, A&A, 465, 171
- Fynbo et al. (2010) Fynbo, J. P. U., Laursen, P., Ledoux, C., et al. 2010, MNRAS, 408, 2128
- Krogager et al. (2012) Krogager, J.-K., Fynbo, J. P. U., Møller, P., et al. 2012, MNRAS, 424, L1
- Krogager et al. (2016) Krogager, J.-K., Fynbo, J. P. U., Noterdaeme, P., et al. 2016, MNRAS, 455, 2698
- Kulkarni et al. (2007) Kulkarni, V. P., Khare, P., Péroux, C., et al. 2007, ApJ, 661, 88
- Kulkarni et al. (2012) Kulkarni, V. P., Meiring, J., Som, D., et al. 2012, ApJ, 749, 176
- Lanzetta et al. (1995) Lanzetta, K. M., Wolfe, A. M., & Turnshek, D. A. 1995, ApJ, 440, 435
- Ledoux et al. (2002) Ledoux, C., Bergeron, J., & Petitjean, P. 2002, A&A, 385, 802
- Noterdaeme et al. (2012) Noterdaeme, P., Laursen, P., Petitjean, P., et al. 2012, A&A, 540, A63
- Noterdaeme et al. (2009) Noterdaeme, P., Petitjean, P., Ledoux, C., & Srianand, R. 2009, A&A, 505, 1087
- Pei & Fall (1995) Pei, Y. C. & Fall, S. M. 1995, ApJ, 454, 69
- Pei et al. (1999) Pei, Y. C., Fall, S. M., & Hauser, M. G. 1999, ApJ, 522, 604
- Quiret et al. (2016) Quiret, S., Péroux, C., Zafar, T., et al. 2016, MNRAS, 458, 4074
- Rahmani et al. (2016) Rahmani, H., Péroux, C., Turnshek, D. A., et al. 2016, MNRAS, 463, 980
- Som et al. (2015) Som, D., Kulkarni, V. P., Meiring, J., et al. 2015, ApJ, 806, 25
- Sommer-Larsen & Fynbo (2008) Sommer-Larsen, J. & Fynbo, J. P. U. 2008, MNRAS, 385, 3
- Storrie-Lombardi & Wolfe (2000) Storrie-Lombardi, L. J. & Wolfe, A. M. 2000, ApJ, 543, 552
- Tissera et al. (2001) Tissera, P. B., Lambas, D. G., Mosconi, M. B., & Cora, S. 2001, ApJ, 557, 527
- Vladilo et al. (2011) Vladilo, G., Abate, C., Yin, J., Cescutti, G., & Matteucci, F. 2011, A&A, 530, A33
- Wolfe et al. (2005) Wolfe, A. M., Gawiser, E., & Prochaska, J. X. 2005, ARA&A, 43, 861
- Wolfe & Prochaska (2000) Wolfe, A. M. & Prochaska, J. X. 2000, ApJ, 545, 591
- Wolfe et al. (1986) Wolfe, A. M., Turnshek, D. A., Smith, H. E., & Cohen, R. D. 1986, ApJS, 61, 249
- Zafar et al. (2014a) Zafar, T., Centurión, M., Péroux, C., et al. 2014a, MNRAS, 444, 744
- Zafar et al. (2017) Zafar, T., Møller, P., Péroux, C., et al. 2017, MNRAS, 465, 1613
- Zafar et al. (2013a) Zafar, T., Péroux, C., Popping, A., et al. 2013a, A&A, 556, A141
- Zafar et al. (2013b) Zafar, T., Popping, A., & Péroux, C. 2013b, A&A, 556, A140
- Zafar et al. (2014b) Zafar, T., Vladilo, G., Péroux, C., et al. 2014b, MNRAS, 445, 2093