Near-barrier Photofission in 232Th and 238U
Abstract
A study of photofission of 232Th and 238U was performed using quasi-monoenergetic, linearly-polarized -ray beams from the High Intensity -ray Source at Triangle Universities Nuclear Laboratory. The prompt photofission neutron polarization asymmetries, neutron multiplicities and the photofission cross sections were measured in the near-barrier energy range of 4.3-6.0 MeV. This data set constitutes the lowest energy measurements of those observables to date using quasi-monoenergetic photons. Large polarization asymmetries are observed in both nuclei, consistent with the E1 excitation as observed by another measurement of this kind made in a higher energy range. Previous experimental evidence of a deep third minimum in the 238U fission barrier has been identified as an accelerator-induced background.
pacs:
I Introduction
There has been much progress over the past 80 years in understanding the fission process but a complete model of the fission mechanism has yet to be established. Recent advances in computing power have facilitated the possibility of a comprehensive microscopic description of the fission process. A complete and quantitatively accurate microscopic fission model would significantly impact a number of fission applications which are currently of interest. The physical observables of fission such as the fission cross section, prompt neutron multiplicity, fragment masses and angular distributions are determined by the structure of the fission barrier - the potential energy surface that an excited nucleus must overcome to split apart. In order for any calculation to be able to predict those observables accurately, it must be able to predict the effective fission barrier. The barrier can not be directly measured and thus can only be inferred through measurements of these fission observables.
Recent experimental Csige et al. (2009); Krasznahorkay et al. (1999); Csatlós et al. (2005); Csige et al. (2013) and theoretical Jachimowicz et al. (2013); McDonnell et al. (2013); Zhao et al. (2015) results have been in disagreement over the topic of a “third minimum,” or third well, in the potential energy surface (PES) describing the fission barrier of actinides. The barriers are typically presented by projecting the multidimensional PES along the quadrupole deformation of the nucleus, . The second and third wells are then seen as relative minima in the potential energy curve of this 1D model at values corresponding to spheroidal nuclear shapes with major to minor axis ratios of approximately 2:1 and 3:1, respectively. Owing to the deformations of the nuclear shapes, states in these potential minima are referred to as super- and hyper-deformed Jachimowicz et al. (2013).
Theoretical calculations of fission barriers in U and Th nuclei tend to predict shallow or non-existent third minima, especially in the heavier isotopes such as 232Th and 238U. Theoretical results by McDonnell et al. McDonnell et al. (2013) highlight the role of shell corrections in the prominence of the third minima for Th and light U isotopes. These self-consistent calculations were performed using finite-temperature superfluid nuclear density functional theory with the Skyrme energy density functionals SkM∗ and UNEDF1, the latter being optimized for fission studies. A shallow third minimum was observed in the lightest Th and U isotopes, with at most a very shallow third minimum or shoulder in the 232Th and 232U barriers. The cause of the neutron number dependence is identified as a neutron shell effect that reduces the third outer barrier, making the third minimum increasingly shallow with increasing . The calculations were limited to 226,228,230,232Th and 228,230,232,234U, but the clear trend with increasing leads to a prediction of no third minimum in 238U. These results are at odds with the relativistic mean field (MDC-RMF) model calculations of Zhao et al. Zhao et al. (2015) which show a shallow, but well-formed 0.5 MeV and 1.11 MeV deep third minima in the fission barrier in 232Th and 238U, respectively. A shallow third minimum in 232Th is also supported by the macroscopic-microscopic calculations of Jachimowicz et al. Jachimowicz et al. (2013), using for the first time an eight-dimensional PES for that nucleus. After a proper inclusion of the dipole deformation, the depth of the third minimum was determined to be about 0.36 MeV. The authors conclude that new experimental study dedicated to hyper-deformation in 232Th is essential for the understanding of the third minima in actinide nuclei.
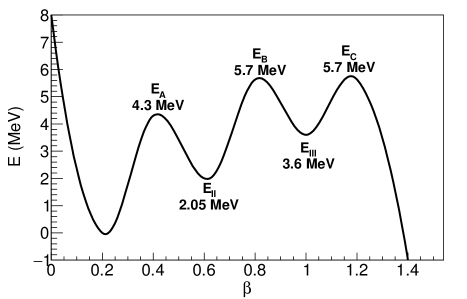
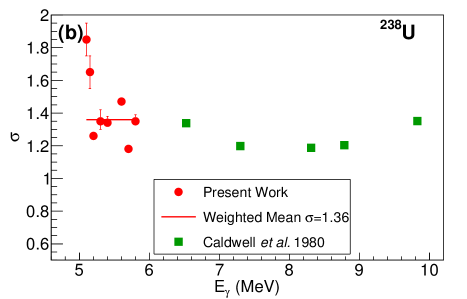
In contrast with shallow third minima favored by theoretical models, a new paradigm of the triple-humped fission barrier with a deep hyper-deformed third minimum for U and Th isotopes was developed from experimental data. When the double-humped fission barrier was initially established Vandenbosch and Huizenga (1973); Bjørnholm and Lynn (1980) for the lighter actinide isotopes, the so-called “Thorium anomaly” persisted. Strong transmission resonances were observed for Th nuclei, which pointed to equal heights of the inner and outer fission barrier Back et al. (1972). However, the systematics of the fission barriers (and their theoretical predictions) suggested instead a much lower inner barrier than the outer one. In this context a triple-humped fission barrier was introduced assuming only a shallow third potential minimum. Almost two decades later it has been demonstrated with data from light-ion induced fission reactions that the outer third minimum for 232,234,236U is in fact as deep as the second minimum Csige et al. (2009); Krasznahorkay et al. (1999); Csatlós et al. (2005). Most recently, photofission cross section measurements performed by Csige et al. Csige et al. (2013) on 238U indicated a 2 MeV deep third well in the 238U fission barrier as shown in Fig. 1. However, while these data were interpreted to show pronounced preference for triple-humped barrier in 238U, low statistics at near threshold energies did not allow for precise mapping of the resonance structure of the cross sections near threshold.
The experimental support for deep third minima in Th isotopes is more conflicted. Neutron-induced fission measurements by Blons et al. Blons et al. (1984, 1988); Blons (1989) indicated a shallow third minimum of less than 0.5 MeV in the 230,231,233Th fission barriers. However a deep third minimum of MeV in the 232Th fission barrier was obtained by Blokhin and Soldatov Blokhin and Soldatov (2009) by analyzing photofission cross sections extracted from data obtained by unfolding bremsstrahlung beams Smirenkin and Soldatov (1996). In light of the experimental evidence of deep third minima in the fission barriers of U isotopes, older 232Th photofission data Zhang et al. (1986) was reinterpreted by Thirolf et al. Thirolf et al. (2012) to tentatively show a MeV deep third minimum, roughly equal in depth to the second minimum. The prospects for further re-analysis of older 232Th photofission cross section data are limited by the large discrepancies between data sets, particularly in the sub-barrier energy region where the effects of the fission barrier structure are most pronounced Lindgren and Sandell (1978).
Photofission, which is the tool used in the present work, has proven to be a valuable probe of the fission barrier structure since an incident -ray photon brings a single unit of angular momentum into the fissioning system. Additionally, at energies near the fission barrier, the -ray photon interacts with the nucleus primarily through E1 transitions, greatly reducing the number of fission channels that contribute to the measured data. This is especially true for even-even nuclei such as 232Th and 238U, which have a ground state and thus can only be connected to a state by an E1 excitation. Recently, Mueller et al. Mueller et al. (2014) probed the spin and parity distribution of the fissioning compound nucleus in a number of actinides including 232Th and 238U, by measuring polarization asymmetries in the angular distribution of prompt photofission neutrons induced by linearly polarized -ray beams. However these measurements were limited primarily to energies above the fission barrier.
Currently there are very few photofission data at low -ray energies where the effects of the fission barrier are most apparent, and there are significant discrepancies in some of the existing data sets. A majority of the available data comes from measurements performed using bremsstrahlung beams, meaning that the cross section data is dependent on the specific method of unfolding the beam spectrum applied to the measured fission yields. It is the aim of the present work to provide data that will help to better constrain the shape of the fission barrier through measurements of the photofission process on 232Th and 238U targets. Photofission was investigated with linearly polarized -ray beams with energies between 4.3 and 6.0 MeV, and prompt fission neutrons were detected to measure the photofission cross sections, photofission neutron polarization asymmetries and prompt fission neutron multiplicities. A majority of the existing photofission data was obtained using bremsstrahlung beams. The present measurements were made with quasi-monoenergetic -ray beams thus avoiding potential systematic error introduced by a beam energy deconvolution process.
II Experiment
II.1 -ray Beams
Photofission measurements were performed at the High Intensity -ray Source (HIS), located at Triangle Universities Nuclear Laboratory (TUNL). The HIS facility Weller et al. (2009) produces intense, quasi-monoenergetic, 100% linearly polarized -ray beams by Compton back-scattering free electron laser (FEL) photons off of relativistic electrons. For this work -ray beams were produced in the range of 4.3-6.3 MeV with an energy resolution of and a typical flux on target of /s. The accelerator was operated with 780 nm FEL photons, electron storage ring energies of MeV and a typical electron storage ring current of 90 mA. A 12 mm diameter, 15.24 cm long Pb collimator was used to limit the -ray beam size and define the energy resolution.
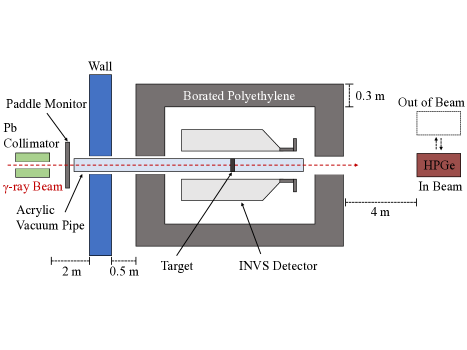
The experimental setup is shown in Fig. 2. The absolute flux of the -ray beam was measured placing a thin sheet of plastic scintillator upstream of the main experimental target and detector assembly. The flux monitor consisted of a 10 cm x 10 cm x 1 mm sheet of polyvinyltoluene affixed to a photomultiplier tube (PMT) by a light guide. Similar scintillating paddles were characterized as HIS -ray beam flux monitors by Pywell et al. Pywell et al. (2009). The energy spectrum of the incident -ray beam was measured with a 120% efficiency high purity germanium detector (HPGe). The HPGe was mounted on a movable platform allowing it to be positioned off-axis during the main photofission runs and in the -ray beam to measure the energy spectrum. In these measurements copper attenuators were placed upstream of the collimator to reduce the -ray beam flux and consequently the HPGe dead time to reasonable levels.
II.2 Targets
Table 1 lists the properties of the 232Th, 238U, natPb and D2O targets used in this work. The 232Th target consisted of 5 identical disks of 2.00 mm thickness and 25.40 mm diameter. The disks are made of natTh which is 99.98% 232Th and contains only trace amounts of 227-231,234Th. The 238U target was composed of 8 disks of depleted uranium with thicknesses varying from mm. The natPb target served as a ‘blank’ to measure -ray beam induced backgrounds, and was machined to be comparable in areal density to the 232Th and 238U targets. A cylindrical D2O cell made with an acrylic casing was used for characterizing the INVS detector response to neutrons from the D(,n) reaction.
| Target | Mass (g) | Enrichment (%) | Thickness (mm) |
|---|---|---|---|
| 232Th | 99.98 | ||
| 238U | |||
| natPb | |||
| D2O |
II.3 Neutron Detector
Neutrons were detected with a model-IV Inventory Sample neutron detector Sprinkle et al. (1993) (INVS), shown in Fig. 3, consisting of 18 3He proportional counters (PCs) embedded in a cylindrical shell of polyethylene moderator. The PCs had a diameter of 2.54 cm, an active length of 39 cm and a nominal 3He gas pressure of 6 atm. The PCs were arranged in 2 concentric rings with radii of 7.24 cm and 10.60 cm, with each ring containing 9 equally spaced PCs. The polyethylene detector body was 46.2 cm long and 30.5 cm in diameter with an 8.9 cm diameter axial cavity for placing a neutron generating target.
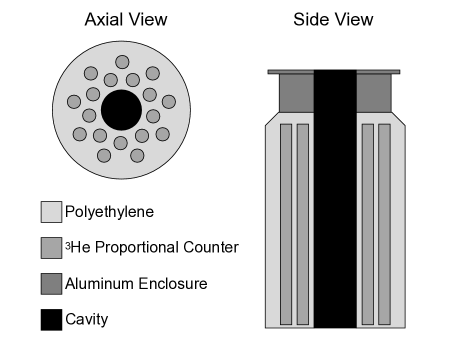
As designed at Los Alamos National Laboratory, the INVS initially had preamplifier and discriminator circuits built into the detector. The INVS was modified for the present experiment to allow for single tube readout by installing SHV connections with direct access to each of the PC anodes. An array of Cremat CR-110 charge sensitive preamplifiers was mounted in a single enclosure with each preamplifier connected to a PC. The outputs of the preamplifiers were then sent to a CAEN V1730 500 MS/s 16-channel digitizer. The digitizer recorded 15 preamplifier channels, with the 16th channel reserved for a 1 Hz pulser for synchronizing digitizer time stamps and monitoring the DAQ live time.
III Detector Simulation & Calibration
The full experimental setup including the INVS detector, targets, target holder assembly and detector shielding was modeled with a geant4 Monte Carlo simulation Agostinelli et al. (2003). The simulation was calibrated with efficiency measurements of the INVS detector made by Arnold et al. Arnold et al. (2011). The INVS neutron detection efficiency was measured on site using the D(,n) reaction, with statistical uncertainties of 1% and systematic uncertainties of . In order to fit the calibration data, the simulated INVS efficiency was scaled by 0.7900.003 (stat) 0.02 (sys) for the inner ring and 0.7750.004 (stat) 0.02 (sys) for the outer ring. These scaling factors account for loss of 3He gas pressure over time, inefficiencies caused by the DAQ signal processing and discriminator threshold settings.
Since the 3He gas pressure, threshold settings and DAQ signal processing settings could be different for each PC, there was variation in the relative efficiency of each PC. The relative PC tube efficiencies were measured by detecting neutrons from 232Th(,f) reaction using circularly-polarized -ray beams, and were found to vary by % from the average efficiencies of the inner and outer rings.
The geant4 simulation was validated through measurements of neutrons from the D(,n) reaction using linearly-polarized, 4.3 MeV -ray beams. This reaction generates neutrons with well-defined energy and asymmetry in the angular distribution Tornow et al. (2003); Schreiber et al. (2000). The ratio of counts in the inner to outer ring of the INVS detector was measured to be 1.4440.005, in agreement with the simulated ratio of 1.460.05. The systematic uncertainty in the simulation comes from the uncertainties in the scaling factors for the inner and outer ring efficiencies. Enough events were included in the simulation to keep the statistical uncertainties more than an order of magnitude below that of the systematics.
The angular distribution of neutrons from the D(,n) reaction with linearly-polarized -ray beams has been explored in detail Tornow et al. (2003) and a simple formalism was developed to account for the polarization of the -ray beam Schreiber et al. (2000). A D(,n) reaction neutron generator was written and incorporated into the geant4 simulation to compare the resulting asymmetries with the measured data. The simulation and measurement data were fit with a function of the form , where is an overall scaling factor, is the detected asymmetry and is the angle of the PC relative to the polarization axis of the beam. The measurement yielded an asymmetry of 0.1320.002 for the inner ring and 0.2520.003 for the outer ring, in agreement with the simulated asymmetries of 0.1320.001 and 0.2480.002 for the inner and outer ring, respectively.
Since neutrons from a single fission event are highly correlated in angle and energy, accurately simulating the INVS detector efficiency required a source of event-by-event photofission neutrons. The Monte Carlo-based code freya Randrup and Vogt (2009) models fission observables in an event-by-event basis. By calculating neutron emission for specific instances of fission fragment masses and excitation energies, freya inherently provides correlations between the various observables, including the neutron energy and angle of emission relative to the direction of the fission fragments. freya only supports neutron-induced and spontaneous fission of several isotopes, so it was necessary to extend the code to model photofission of 232Th and 238U using the method described by Mueller et al. Mueller et al. (2014).
Fission product mass distributions were sampled from 0.5 MeV neutron induced fission data England and Rider (1993) as suitable photofission data was not available. Fragment kinetic energies were also sampled from neutron induced fission data, with 2.97 MeV neutrons on 232Th Holubarsch et al. (1971) and 1.7 MeV neutrons on 238U Vivès et al. (2000).
The geant4 simulation sampled neutrons from data sets generated by freya, rotating the momentum of the neutrons so that the fission fragment axis followed the appropriate angular distribution. From the formalism in Refs. Fagg and Hanna (1959); Mueller et al. (2012), fission fragments induced by a linearly polarized -ray beam have an angular distribution of the form
| (1) | ||||
where is the angle relative to the beam axis, is the azimuthal angle and is the beam polarization. Assuming 100% linear polarization Weller et al. (2009) and neglecting the quadrupole contribution, the expression simplifies to
| (2) |
where and are normalized such that . Eq. 2 can also be used to fit the angular distribution of the neutrons emitted by the fragments, in order to give the correlation between the fragment distribution the neutron distribution. In this paper, the angular distribution is specified as being for the fission fragments or fission neutrons by the use of the subscripts f and n, respectively.
IV Data Reduction & Analysis
IV.1 Pulse Shape Discrimination
The digitized waveforms of the preamplifier outputs of the PCs were analyzed offline. When a trigger occurred in any channel the digitizer recorded a 4.1 s long, 2050 sample trace for all 16 channels. In addition each trigger had an associated timestamp based on a 125 MHz internal clock in the digitizer. A 1 Hz pulser in one of the digitizer channels served as the DAQ live time monitor. The maximum trigger rate that the digitizer could handle without data loss was approximately 1 kHz, so caution was taken to keep the trigger rate below Hz by limiting the -ray beam flux with attenuators at higher energies where the photofission cross sections were greater. As long as the trigger rate was kept reasonable, the 1 Hz pulser consistently indicated no dead time.
3He-based PCs are relatively insensitive to -rays but the large -ray beam flux of /s provided by HIS combined with a thick actinide target created a detectable background of Compton scattered -rays. The scattered -rays interact with the PCs primarily by scattering electrons into the active gas volume. These -ray induced events have the potential to produce pulses with a sufficiently large amplitude that they overlap with the pulse height spectrum from neutron induced events, in which a proton and triton created by the 3He(n,p)3H reaction deposit a maximum of 763.8 keV into the active gas volume of the PC.
Identification of neutron and -ray detection events was achieved through the use of a pulse shape discrimination (PSD) technique originally developed for 3He proportional counters in low background experiments Langford et al. (2013). This technique exploits the difference in stopping power between the ions in a neutron detection event and the electron in a -ray detection event. For the same deposited energy the proton and triton will have a shorter track length than the electron, and thus a shorter pulse rise time.
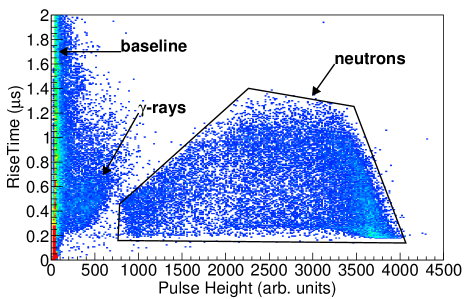
Following the application of a Gaussian smoothing routine to reduce high-frequency noise, the rise time, pulse height and timestamp of each digitized waveform were extracted. The rise time was defined as the time for a pulse to rise from 10% to 50% of its maximum pulse height above the baseline. Fig. 4 shows the PSD cut used for one of the 3He proportional counters. The neutron and -ray event regions are well separated in rise time vs pulse height space. Measurements made with a natPb target for generating Compton scattered -rays and a deuterium target for generating neutrons confirmed the particle identification regions in the PSD plot. Events in the baseline noise region occur because the analysis code attempts to extract pulse characteristics from each digitizer channel, regardless of which channel triggered the DAQ since coincident neutron detections happened regularly. In the absence of a neutron or -ray event waveform, the analysis routine extracts pulse characteristics from random noise.
IV.2 Background Neutron Multiplicity Analysis
Determining the detected neutron multiplicities requires setting a time window in which neutrons from the same fission event may be counted. The time window must be long enough that any correlated neutrons from a single fission event will have either been detected or escaped the detector; however, making it excessively long increases the likelihood that uncorrelated neutrons from other fission events or backgrounds are counted as well. Thus a clear understanding of the neutron detection timescale is necessary.
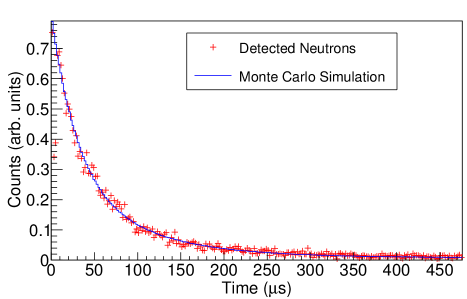
geant4 simulations of the INVS detector were performed and the detection time for each neutron was recorded, where the neutron is always emitted at time and detected some time after that. The simulated neutron detection time distribution was found to be well represented by an exponential decay function with a 31 half life fit. A direct comparison of neutron detection time cannot be generated from the experimental data because there is no ‘start’ signal for each fission event. The closest comparison is to instead sort through the detected neutrons in chronological order, with the first detected neutron creating a gate and subsequent neutron detection times recorded relative to the first one. A 1 ms long gate was used to guarantee that all detected neutrons from the fission event were included. The analysis was applied to Monte Carlo simulation data and experimental data from the 238U(,f) reaction at Eγ=5.1 MeV, an energy at which the photofission rate was much larger than the background event rate but still sufficiently low that coincident fission events were rare. Fig. 5 shows the good agreement between the time distributions for simulated and detected photofission neutrons in the INVS detector, validating the neutron detection time response of the geant4 simulation.
There were three sources of background neutrons present throughout this work: cosmic-ray induced neutrons, neutrons from the D(,n) reaction occurring in the detector moderator, and neutrons from bremsstrahlung contamination in the HIS beam Carman et al. (1996) inducing (,xn) and (,f) reactions on the targets. Sources of background neutrons were differentiated with a multiplicity analysis technique. Background multiplicities were defined by grouping together neutrons within 300 s coincidence windows, where the first detected neutron defines the start of the coincidence gate. The multiplicity was defined as the total number of neutrons in the gate including the one which triggered it, meaning that the minimum detected multiplicity was 1 by definition. The next 300 s long gate was created on the first neutron that fell outside of the previous gate so that any neutron was only counted towards one multiplicity event. The observed neutron multiplicity distributions for the various backgrounds are shown in Fig. 6.
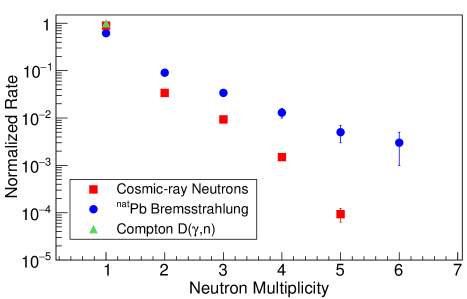
The cosmic-ray induced neutron background was reduced to a neutron detection rate of Hz by surrounding the INVS detector with cm of borated polyethylene shielding on all sides.
A bremsstrahlung component of the -ray beam was identified by placing a natPb target in the INVS detector and operating HIS in “single bunch mode,” in which a single electron bunch was held in the FEL storage ring instead of the two used in normal operation Weller et al. (2009). In this configuration there are no counter-propagating electrons so the HIS facility is incapable of generating -rays by Compton scattering the FEL photons. Further, the configuration of the HIS facility was such that -rays generated by Compton scattered FEL photons would have been below the threshold for natPb(,xn) reactions. Determining the properties of the bremsstrahlung beam is beyond the scope of this work. We sought to only measure the directly observable effects of the bremsstrahlung: the neutron detection rates and detected neutron multiplicity distribution. The observed bremsstrahlung-induced natPb(,xn) neutron multiplicity distribution is shown in Fig. 6, with a typical neutron detection rate of Hz.
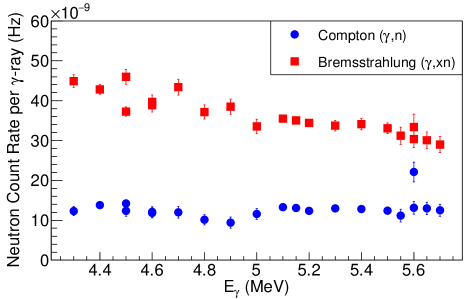
The combined bremsstrahlung and Compton scattering induced backgrounds were measured by placing a natPb target in the INVS detector and running HIS in the standard “two bunch mode” which produces an intense, quasi-monoenergetic -ray beam. The observed neutron multiplicity distributions were fit with neutrons from the natPb(,xn) reaction and Compton scattering D(,n) reaction multiplicity distributions to determine the contributions from the two backgrounds, with typical uncertainties of . The background neutron detection rates as a function of Eγ are shown relative to the primary -ray beam flux in Fig. 7. The Compton scattering D(,n) reaction and bremsstrahlung (,xn) reaction backgrounds were both scaled appropriately for the 232Th and 238U targets. The Compton scattering component scales with the number of electrons in the target nuclei, the target thickness and density. The bremsstrahlung component was multiplied by scaling factors for each target which were experimentally measured using the “single bunch mode” HIS operation.
IV.3 Prompt Fission Neutron Multiplicity Analysis
Defining the detected neutron multiplicities by grouping together neutrons within a 300 s window works well for the low event rates in the background analysis (see Sec. IV.2), but suffers from pileup effects for the higher event rates of photofission measurements. Consequently the prompt fission neutron analysis relied on the Rossi-alpha method Pacilio (1969), a multiplicity logic scheme originally developed for reactor neutron noise analysis. This method is more robust against accidental coincidences caused by high fission rates.
The gating logic used in the present work was as follows: after a neutron detection, there was a 10 s delay to account for a small dead time immediately following the digitizer gate. Next a 500 s long gate was set which contained real and accidental coincidences (RA), and following that a 500 s long gate which should only contain accidental coincidences (A). Each neutron detection created the RA and A gates, and the number of events of each multiplicity was given by RA-A, the difference between the real events plus accidental events and just the accidentals.
Even with the Rossi-alpha multiplicity gating logic, the detected neutron multiplicity distributions depend on the fission event rate and overlap with the background in a nonlinear manner. A Monte Carlo simulation was developed to fit the prompt fission neutron multiplicity distribution with the detected Rossi-alpha multiplicities. The fission neutron multiplicity distribution was modeled as a Gaussian distribution Terrell (1957) with the fit parameters mean, , and spread, . The Monte Carlo simulation modeled the detection of the photofission neutrons with the assumed initial distribution, added the background events with the experimentally measured multiplicities and rates (see Sec. IV.2), and analyzed the resulting data stream using the Rossi-alpha gating logic. The multiplicity distribution parameters and were varied to minimize the between the measured and the Monte Carlo simulated RA-A distributions.
IV.4 Neutron Asymmetry Analysis
After subtracting background counts and correcting for the relative PC efficiencies, the detected prompt photofission neutron asymmetries were measured by fitting the relative yields of each PC tube with the function
| (3) |
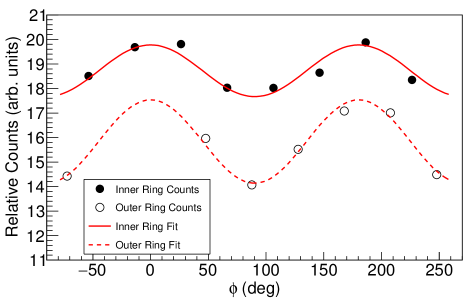
where is the detected neutron yield in the PC tube at angle , is an overall scaling factor and is the detector asymmetry. Fig. 8 shows examples of the fit, performed independently on the inner and outer rings of the INVS detector.
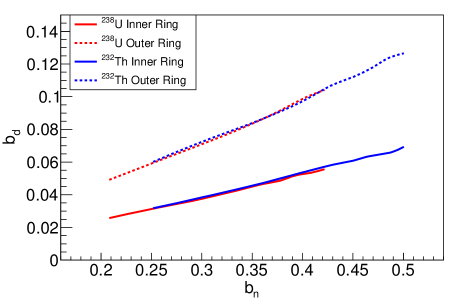
The simulated correlation between the detected neutron asymmetry and the emitted neutron asymmetry is shown in Fig. 9, where is defined in Eq. 2. geant4 simulations were performed using the photofission neutrons from the freya calculations for both 238U and 232Th, with each unique target geometry modeled to account for neutron scattering in the target and target holder assemblies. Since the inner and outer rings of the INVS detector have different detected asymmetry responses to the same emitted neutron angular distribution, each ring was treated as a separate measurement of the polarization asymmetry and the results were combined for a single measurement for each Eγ and target. There was no strong dependence observed between the fissioning isotope species and the detector response to the neutron asymmetry, which is consistent with the results of Ref. Mueller et al. (2014).
IV.5 Photofission Cross Section Analysis
The photofission cross section is written as
| (4) |
where is the total number of detected neutrons, is the number of background neutrons, is the atomic mass of the target nuclei, is the efficiency of the INVS detector, is the mean prompt neutron multiplicity, is the total number of -rays on target, is the target thickness, is the target density, is a factor which accounts for the attenuation of the -ray beam within the thick target and is Avogadro’s number. The thick target correction factor is written as
| (5) |
where is the attenuation coefficient of the target material Hubbell and Seltzer . is determined using the multiplicity analysis technique described in Sec. IV.3.
The photofission neutron spectra from the freya calculations did not differ enough over the range of 4.3 MeV E MeV to change the simulated efficiency of the INVS detector. Thus for the 232Th(,f) neutrons and for the 238U(,f) neutrons. The values of for 232Th(,f) and 238U(f) were determined by taking the weighted average of the multiplicity measurements results for each target (see Sec. V.2). The photofission cross section analysis in this work uses = and = for 232Th and 238U, respectively. The systematic error in the photofission cross section data includes contributions from (3%), target thickness (0.2% for 232Th, 0.6% for 238U, 1% for natPb and 0.7% for D2O) and mean neutron multiplicities (0.4-2%).
V Results & Discussion
V.1 Prompt Photofission Neutron Polarization Asymmetries
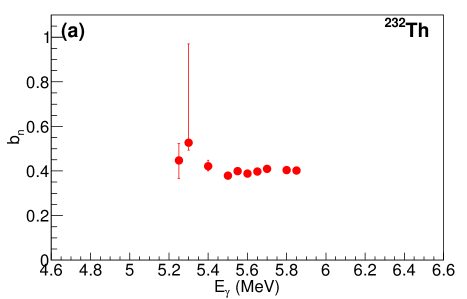
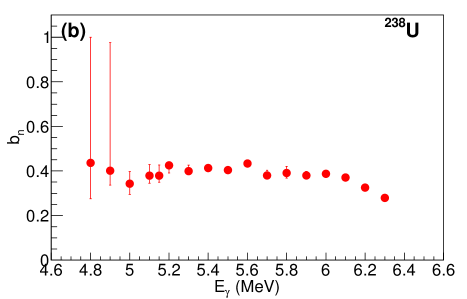
The measured prompt photofission polarization asymmetries are shown in Fig. 10 for 238U and 232Th, and are qualitatively consistent with the expected effects of the transmission through the fission barrier. Based on the the most likely energy level ordering for an even-even nucleus Huizenga and Katsanos (1967), the lowest energy excitation is which corresponds to the mass asymmetry mode. This would then be the dominant fission channel at low Eγ and would result in large polarization asymmetries. The next lowest channel would be the bending mode which would begin to contribute as Eγ is increased, reducing the polarization asymmetry, as experimentally observed.
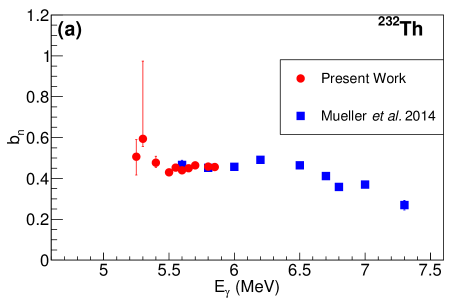
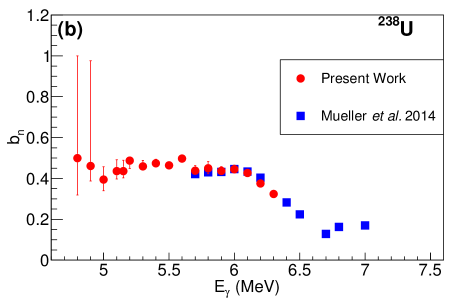
In Fig. 11 the present asymmetry results are compared with the data of Mueller et al. Mueller et al. (2014), the only other measurement of photofission neutron polarization asymmetries in 238U and 232Th. Since liquid scintillating neutron detectors were used in Ref. Mueller et al. (2014), the presented data were limited to neutrons above E MeV. In order to make a direct comparison with the prior data, the present asymmetry calculations were adjusted to include only neutrons above E MeV. This adjustment was achieved by setting a 1.5 MeV energy threshold on the neutron distribution fit which correlates the fission fragment asymmetry with the emitted neutron asymmetry. Omitting the lower energy neutrons increases by about 10% since the neutrons which are emitted in the direction of the fragment receive more of a kinematic boost, and therefore tend to have higher energies than those emitted perpendicular to the fragment motion. Once the effects of the neutron energy cut of E MeV are accounted for, there is excellent agreement between the present results and the data of Mueller et al. in the energy region where they overlap.
V.2 Prompt Photofission Neutron Multiplicities
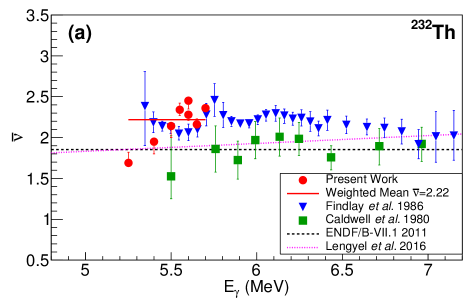
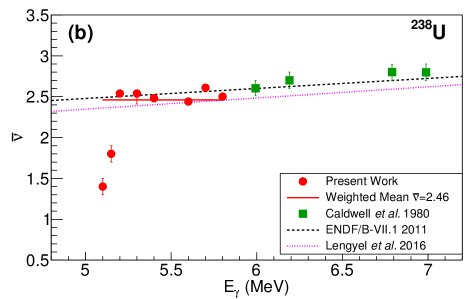
The mean prompt photofission neutron multiplicities, , for 232Th and 238U are shown in Fig. 12, along with previous measurements Caldwell et al. (1980a); Findlay et al. (1986), the ENDF/B-VII.1 evaluation Chadwick et al. (2011), and an empirical model developed by Lengyel et al. Lengyel et al. (2016). The error bars in the present data represent the range of values that increase the of the fit by less than 1. A weighted mean of the present data was calculated using the inverse of the as the weighting factor. Multiplicities determined in the present work are = and = for the photofission of 232Th and 238U, respectively. The lowest Eγ points which diverge from the rest of the data suffer from poor statistics and consequently have larger values exceeding 200 and 50 for the lowest Eγ measurements for 232Th and 238U, respectively. In the case of 232Th, the present data are in better agreement with Findlay et al. Findlay et al. (1986) than with the data of Caldwell et al. Caldwell et al. (1980a). The measurements of Ref. Caldwell et al. (1980a) appear systematically low in comparison, along with the ENDF/B-VII.1 evaluation Chadwick et al. (2011) and the empirical model Lengyel et al. (2016). In the case of 238U, the present data are in good agreement with the data of Ref. Caldwell et al. (1980a), the ENDF/B-VII.1 evaluation Chadwick et al. (2011) and the empirical model of Ref. Lengyel et al. (2016).
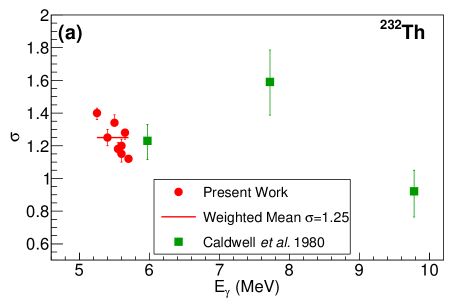
The spreads of the Gaussian prompt neutron multiplicity distributions, , are plotted in Fig. 13, in good agreement with the only previous measurement in a comparable Eγ range Caldwell et al. (1980a). The weighted means were measured to be and for 232Th and 238U, respectively.
V.3 Photofission Cross Sections
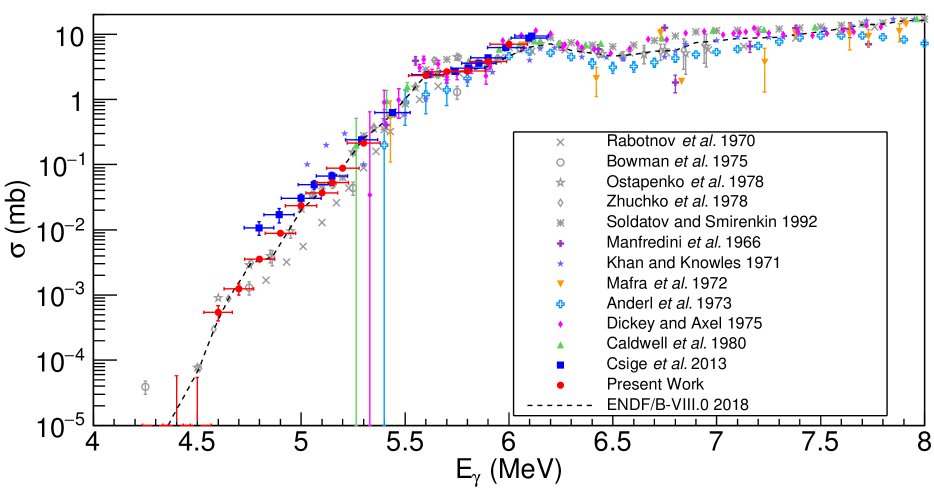
The 232Th(,f) reaction cross section results are listed in Table 2 and plotted in Fig.14, along with all available literature data sets which extend below an excitation energy of 6 MeV Rabotnov et al. (1970); Bowman et al. (1978); Zhuchko et al. (1978); Findlay et al. (1986); Smirenkin and Soldatov (1996); Caldwell et al. (1980b); Zhang et al. (1986) and the ENDF/B-VIII.0 evaluation Brown et al. (2018). Data sets consistent with 0 mb below MeV Knowles et al. (1982); Dickey and Axel (1975); Yester et al. (1973); Mafra et al. (1972); Khan and Knowles (1972) were omitted.
| Eγ (MeV) | (MeV) | ,f) (b) |
|---|---|---|
| 4.7 | 0.071 | -0.4 0.2 |
| 4.8 | 0.072 | -0.04 0.1 |
| 4.9 | 0.074 | -0.4 0.1 |
| 5.0 | 0.075 | 0.30 0.07 |
| 5.1 | 0.077 | 0.27 0.06 |
| 5.2 | 0.078 | 3.73 0.09 |
| 5.25 | 0.079 | 7.4 0.2 |
| 5.3 | 0.080 | 22.7 0.2 |
| 5.4 | 0.081 | 92.9 0.3 |
| 5.5 | 0.083 | 203.8 0.5 |
| 5.55 | 0.083 | 227.3 0.5 |
| 5.6 | 0.084 | 248.0 0.5 |
| 5.65 | 0.085 | 235.1 0.5 |
| 5.7 | 0.089 | 277.1 0.5 |
| 5.8 | 0.087 | 799 3 |
There is some tension between the present data and the ENDF/B-VIII.0 evaluation, with the present data about an order of magnitude higher in the 5.2-5.5 MeV range. In this region the cross section in the ENDF/B-VIII.0 evaluation is lower than nearly all of the available experimental data. The present results are generally in good agreement with the data obtained using bremsstrahlung beams Rabotnov et al. (1970); Bowman et al. (1978); Zhuchko et al. (1978); Findlay et al. (1986); Smirenkin and Soldatov (1996). In particular the present work observes the same plateau in the photofission cross section of 232Th in the Eγ range of MeV. Blokhin and Soldatov Blokhin and Soldatov (2009) attribute this plateau to an almost complete fragmentation of a resonance in the second minimum caused by damping, and a partial fragmentation of a resonance in the third minimum which is shifted in energy relative to the second minimum resonance. This combination of resonant states in the second and third minima explains the large width of the plateau and the presence of resonance structure. However, the 5.6 MeV resonance observed in the data of Smirenkin and Soldatov Smirenkin and Soldatov (1996) is not seen in the present results. This resonance is also not apparent in the only other data measured with quasi-monoenergetic -ray beams in that energy region Caldwell et al. (1980b). Despite the absence of the 5.6 MeV resonance in present results, the MeV plateau that is apparent in all available data sets is difficult to explain without damped vibrational states, which is suggestive of a deep third minimum in the fission barrier.
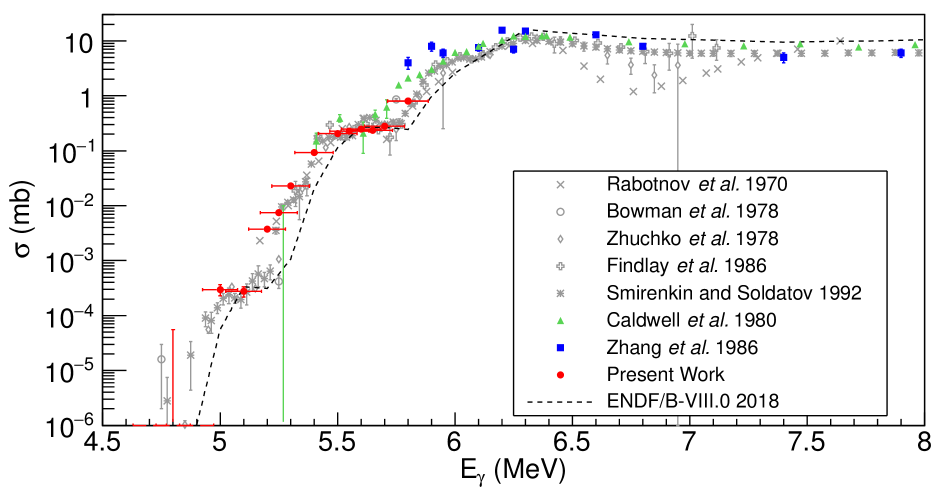
The 238U(,f) reaction cross section results are listed in Table 3 and plotted in Fig. 15, along with all available literature data sets which extend below an excitation energy of 6 MeV Rabotnov et al. (1970); Anderl et al. (1973); Bowman et al. (1975); Ostapenko et al. (1978); Zhuchko et al. (1978); Soldatov and Smirenkin (1992); Manfredini et al. (1966); Khan and Knowles (1972); Mafra et al. (1972); Dickey and Axel (1975); Caldwell et al. (1980b); Csige et al. (2013) and the ENDF/B-VIII.0 evaluation Brown et al. (2018).
| Eγ (MeV) | (MeV) | ,f) (b) |
|---|---|---|
| 4.3 | 0.065 | -0.3 0.2 |
| 4.4 | 0.066 | -0.08 0.1 |
| 4.5 | 0.068 | -0.06 0.1 |
| 4.6 | 0.069 | 0.5 0.1 |
| 4.7 | 0.071 | 1.2 0.2 |
| 4.8 | 0.072 | 3.5 0.2 |
| 4.9 | 0.074 | 8.9 0.3 |
| 5.0 | 0.075 | 23.3 0.2 |
| 5.1 | 0.077 | 37.0 0.2 |
| 5.15 | 0.077 | 52.7 0.2 |
| 5.2 | 0.078 | 88.0 0.3 |
| 5.3 | 0.080 | 215.6 0.6 |
| 5.6 | 0.084 | 2330 5 |
| 5.7 | 0.086 | 2639 6 |
| 5.8 | 0.087 | 2722 6 |
| 5.9 | 0.089 | 3798 7 |
| 6.0 | 0.090 | 7060 10 |
The present results are in good agreement with the data of Ostapenko et al. Ostapenko et al. (1978), Zhuchko et al. Zhuchko et al. (1978) and Soldatov and Smirenkin Soldatov and Smirenkin (1992) obtained using bremsstrahlung beams. Additionally, the present results are in remarkably good agreement with the ENDF/B-VIII.0 evaluation.
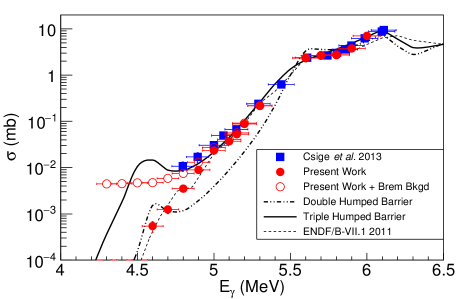
The present 238U(,f) reaction cross section data are consistent with the data of Csige et al. Csige et al. (2013) above MeV, however there is increasing disagreement between the data sets below this energy, with a factor of discrepancy at 4.8 MeV. Because the data of Ref. Csige et al. (2013) was also obtained at the HIS facility, using nominally the same -ray beams as the present work, there is a unique opportunity to determine the source of the inconsistency between the prior measurement and the present results. We attribute this low energy divergence to a bremsstrahlung beam contamination present at the HIS facility, which was previously discussed in Ref. Carman et al. (1996). The effects of the bremsstrahlung beam were measured precisely for the first time in this work and were not taken into account in the results of Ref. Csige et al. (2013). The 238U photofission cross section was measured in Ref. Csige et al. (2013) using an array of parallel plate avalanche counters, detecting both fragments from a fission event in coincidence. Since it is not possible to distinguish fission fragments from fission induced by the two different beam components, the background from the bremsstrahlung contamination of the HIS beam cannot be removed from the measured fission yields.
In Fig. 16 the present results are shown with and without proper subtraction of the bremsstrahlung-induced background, with the non-background subtracted data in much better agreement with the data of Ref. Csige et al. (2013). This agreement supports our assertion that the previously measured excess cross section at low energies was caused by the bremsstrahlung contamination of the HIS -ray beam. Fig. 16 also includes photofission cross sections calculated assuming double- and triple-humped 238U fission barriers by Csige et al. The calculations were performed with the empire 3.1 code Herman et al. (2007), tuning the input parameters to best reproduce the measured photofission cross section data. Neither calculation is in good agreement with the present results, in particular the predicted resonance at 4.6 MeV which is present in both calculations is not observed in the present data. The discrepancy between the current 238U photofission data and the calculated cross sections from Ref. Csige et al. (2013) assuming a double- and triple- humped fission barrier casts significant doubt on the triple-humped shape of the 238U fission barrier proposed in Ref. Csige et al. (2013) and shown in Fig. 1.
A more definitive statement about the structure of the 238U fission barrier will require new photofission cross section calculations tuned to fit not only the present data, but the broadest range of available data near the fission barrier. Given the good agreement between the present data obtained using quasi-monoenergetic -ray beams and the data of Zhuchko et al. Zhuchko et al. (1978) obtained using bremsstrahlung beams, it is reasonable to conclude that the unfolding procedure applied to that data gives accurate results. Since the data of Ref. Zhuchko et al. (1978) extends down to E MeV, these data could supplement the present data set below E MeV, the lowest energy non-zero data point.
VI Conclusions
High-precision measurements of the photofission cross sections, prompt fission neutron polarization asymmetries, and the mean and spread of the prompt fission neutron multiplicity distributions of 232Th and 238U have been performed in the -ray energy region of E MeV and E MeV, respectively. This work, performed using the monochromatic, high-intensity, Compton-backscattered -ray beams of the HIS facility, represents the lowest energy measurements of this kind using quasi-monoenergetic -ray beams. Our results show that a previously observed shelf in the 238U photofission cross section, that had been identified as a resonance caused by a deep third minimum in the 238U fission barrier, is instead an accelerator background induced by a bremsstrahlung contamination of the -ray beam. Future measurements of the photofission cross sections of both 238U and 232Th would help to place additional constraints on the structure of the fission barriers of the respective nuclei, especially with regards to the debate over the existence of deep third minima. Next generation Compton-backscatter -ray sources such as the ELI-NP facility Thirolf et al. (2012) and the proposed HIS2 upgrade Ahmed et al. (2012) will provide -ray beams with the improved flux and resolution needed to measure photofission cross sections and resonances well below the fission barrier.
Acknowledgements.
The authors thank G. Rich for invaluable contributions to the development of this project. Additionally, we express gratitude A. Banu and N. Parikh for their help in the experiment and data taking, and to J. Langenbrunner for providing material support. We thank the HIS staff for delivering high-quality -ray beams for this work. We especially wish to thank S. Mikhailov for enlightening discussions of the -ray beam properties. This work was performed under the auspices of US DOE by LLNL under contract DE-AC52-07NA27344, with support from the US DOE Office of Science, Office of Nuclear Physics through grants DE-FG02-97ER41033 and DE-FG02-97ER41041.References
- Csige et al. (2009) L. Csige, M. Csatlós, T. Faestermann, Z. Gácsi, J. Gulyás, D. Habs, R. Hertenberger, A. Krasznahorkay, R. Lutter, H. J. Maier, P. G. Thirolf, and H.-F. Wirth, Phys. Rev. C 80, 011301 (2009).
- Krasznahorkay et al. (1999) A. Krasznahorkay, D. Habs, M. Hunyadi, D. Gassmann, M. Csatlós, Y. Eisermann, T. Faestermann, G. Graw, J. Gulyás, R. Hertenberger, H. Maier, Z. Máté, A. Metz, J. Ott, P. Thirolf, and S. van der Werf, Phys. Lett. B 461, 15 (1999).
- Csatlós et al. (2005) M. Csatlós, A. Krasznahorkay, P. Thirolf, D. Habs, Y. Eisermann, T. Faestermann, G. Graw, J. Gulyás, M. Harakeh, R. Hertenberger, M. Hunyadi, H. Maier, Z. Máté, O. Schaile, and H.-F. Wirth, Phys. Lett. B 615, 175 (2005).
- Csige et al. (2013) L. Csige, D. M. Filipescu, T. Glodariu, J. Gulyás, M. M. Günther, D. Habs, H. J. Karwowski, A. Krasznahorkay, G. C. Rich, M. Sin, L. Stroe, O. Tesileanu, and P. G. Thirolf, Phys. Rev. C 87, 044321 (2013).
- Jachimowicz et al. (2013) P. Jachimowicz, M. Kowal, and J. Skalski, Phys. Rev. C 87, 044308 (2013).
- McDonnell et al. (2013) J. D. McDonnell, W. Nazarewicz, and J. A. Sheikh, Phys. Rev. C 87, 054327 (2013).
- Zhao et al. (2015) J. Zhao, B.-N. Lu, D. Vretenar, E.-G. Zhao, and S.-G. Zhou, Phys. Rev. C 91, 014321 (2015).
- Vandenbosch and Huizenga (1973) R. Vandenbosch and J. Huizenga, Nuclear Fission (Academic Press, New York, 1973).
- Bjørnholm and Lynn (1980) S. Bjørnholm and J. E. Lynn, Rev. Mod. Phys. 52, 725 (1980).
- Back et al. (1972) B. B. Back, H. C. Britt, J. D. Garrett, and O. Hansen, Phys. Rev. Lett. 28, 1707 (1972).
- Blons et al. (1984) J. Blons, C. Mazur, D. Paya, M. Ribrag, and H. Weigmann, Nucl. Phys. A 414, 1 (1984).
- Blons et al. (1988) J. Blons, B. Fabbro, C. Mazur, D. Paya, M. Ribrag, and Y. Patin, Nucl. Phys. A 477, 231 (1988).
- Blons (1989) J. Blons, Nucl. Phys. A 502, 121 (1989).
- Blokhin and Soldatov (2009) A. I. Blokhin and A. S. Soldatov, Phys. At. Nuclei 72, 917 (2009).
- Smirenkin and Soldatov (1996) G. N. Smirenkin and A. S. Soldatov, Phys. At. Nuclei 59, 185 (1996).
- Zhang et al. (1986) H. X. Zhang, T. R. Yeh, and H. Lancman, Phys. Rev. C 34, 1397 (1986).
- Thirolf et al. (2012) P. Thirolf, L. Csige, D. Habs, M. Günther, M. Jentschel, A. Krasznahorkay, D. Filipescu, T. Glodariu, L. Stroe, O. Tesileanu, H. Karwowski, and G. Rich, EPJ Web of Conferences 38, 08001 (2012).
- Lindgren and Sandell (1978) L. J. Lindgren and A. Sandell, A. Z Physik A 285, 415 (1978).
- Mueller et al. (2014) J. M. Mueller, M. W. Ahmed, R. H. France, M. S. Johnson, H. J. Karwowski, L. S. Myers, J. Randrup, M. H. Sikora, M. C. Spraker, S. Stave, J. R. Tompkins, R. Vogt, H. R. Weller, C. S. Whisnant, and W. R. Zimmerman, Phys. Rev. C 89, 034615 (2014).
- Weller et al. (2009) H. R. Weller, M. W. Ahmed, H. Gao, W. Tornow, Y. K. Wu, M. Gai, and R. Miskimen, Prog. Part. Nucl. Phys. 62, 257 (2009).
- Pywell et al. (2009) R. Pywell, O. Mavrichi, W. Wurtz, and R. Wilson, Nucl. Instrum. Methods A 606, 517 (2009).
- Sprinkle et al. (1993) J. K. Sprinkle, Jr., H. O. Menlove, M. C. Miller, and P. A. Russo, An Evaluation of the INVS Model IV Neutron Counter, Tech. Rep. LA-12496-MS (Los Alamos National Laboratory, 1993).
- Agostinelli et al. (2003) S. Agostinelli et al., Nucl. Instrum. Methods A 506, 250 (2003).
- Arnold et al. (2011) C. Arnold, T. Clegg, H. Karwowski, G. Rich, J. Tompkins, and C. Howell, Nucl. Instrum. Methods A 647, 55 (2011).
- Tornow et al. (2003) W. Tornow, N. Czakon, C. Howell, A. Hutcheson, J. Kelley, V. Litvinenko, S. Mikhailov, I. Pinayev, G. Weisel, and H. Witała, Phys. Lett. B 574, 8 (2003).
- Schreiber et al. (2000) E. C. Schreiber, R. S. Canon, B. T. Crowley, C. R. Howell, J. H. Kelley, V. N. Litvinenko, S. O. Nelson, S. H. Park, I. V. Pinayev, R. M. Prior, K. Sabourov, M. Spraker, W. Tornow, Y. Wu, E. A. Wulf, and H. R. Weller, Phys. Rev. C 61, 061604 (2000).
- Randrup and Vogt (2009) J. Randrup and R. Vogt, Phys. Rev. C 80, 024601 (2009).
- England and Rider (1993) T. England and B. Rider, Evaluation and Compilation of Fission, Tech. Rep. LA-UR-94-3106 (Los Alamos National Laboratory, 1993).
- Holubarsch et al. (1971) W. Holubarsch, E. Pfeiffer, and F. Gönnenwein, Nucl. Phys. A 171, 631 (1971).
- Vivès et al. (2000) F. Vivès, F.-J. Hambsch, H. Bax, and S. Oberstedt, Nucl. Phys. A 662, 63 (2000).
- Fagg and Hanna (1959) L. W. Fagg and S. S. Hanna, Rev. Mod. Phys. 31, 711 (1959).
- Mueller et al. (2012) J. M. Mueller, M. W. Ahmed, B. Davis, J. M. Hall, S. S. Henshaw, M. S. Johnson, H. J. Karwowski, D. Markoff, L. S. Myers, B. A. Perdue, S. Stave, J. R. Tompkins, M. J. Tuffley, and H. R. Weller, Phys. Rev. C 85, 014605 (2012).
- Langford et al. (2013) T. Langford, C. Bass, E. Beise, H. Breuer, D. Erwin, C. Heimbach, and J. Nico, Nucl. Instrum. Methods A 717, 51 (2013).
- Carman et al. (1996) T. S. Carman, V. Litveninko, J. Madey, C. Neuman, B. Norum, P. G. O’Shea, N. R. Roberson, C. Y. Scarlett, E. Schreiber, and H. R. Weller, Nuclear Instruments and Methods in Physics Research Section A: Accelerators, Spectrometers, Detectors and Associated Equipment 378, 1 (1996).
- Pacilio (1969) N. Pacilio, Reactor-noise Analysis in the Time Domain. AEC Critical Review Series., Tech. Rep. (Argonne National Lab., Ill. Comitato Nazionale per l’Energia Nucleare, Rome (Italy), 1969).
- Terrell (1957) J. Terrell, Phys. Rev. 108, 783 (1957).
- (37) J. H. Hubbell and S. M. Seltzer, “Tables of x-ray mass attenuation coefficients and mass energy-absorption coefficients (version 1.4),” .
- Huizenga and Katsanos (1967) J. Huizenga and A. Katsanos, Nucl. Phys. A 98, 614 (1967).
- Caldwell et al. (1980a) J. T. Caldwell, E. J. Dowdy, R. A. Alvarez, B. L. Berman, and P. Meyer, Nuclear Science and Engineering 73, 153 (1980a).
- Findlay et al. (1986) D. Findlay, N. Hawkes, and M. Sené, Nucl. Phys. A 458, 217 (1986).
- Chadwick et al. (2011) M. Chadwick et al., Nucl. Data Sheets 112, 2887 (2011), special Issue on ENDF/B-VII.1 Library.
- Lengyel et al. (2016) A. Lengyel, O. Parlag, V. Maslyuk, M. Romanyuk, and O. Gritzay, Journal of Nuclear and Particle Physics 6, 43 (2016).
- Rabotnov et al. (1970) N. S. Rabotnov, G. N. Smirenkin, A. S. Soldatov, L. N. Usachev, S. P. Kapitza, and Y. M. Tsipenyu, Sov. J. Nucl. Phys. 11, 285 (1970).
- Bowman et al. (1978) C. D. Bowman, I. G. Schröder, K. C. Duvall, and C. E. Dick, Phys. Rev. C 17, 1086 (1978).
- Zhuchko et al. (1978) V. Zhuchko, Y. B. Ostapenko, G. Smirenkin, A. Soldatov, and Y. M. Tsipenyuk, Sov. J. Nucl. Phys.(Engl. Transl.);(United States) 28 (1978).
- Caldwell et al. (1980b) J. T. Caldwell, E. J. Dowdy, B. L. Berman, R. A. Alvarez, and P. Meyer, Phys. Rev. C 21, 1215 (1980b).
- Brown et al. (2018) D. Brown et al., Nucl. Data Sheets 148, 1 (2018), special Issue on Nuclear Reaction Data.
- Knowles et al. (1982) J. Knowles, W. Mills, R. King, B. Pich, S. Yen, R. Sobie, L. Watt, T. Drake, L. Cardman, and R. Gulbranson, Phys. Lett. B 116, 315 (1982).
- Dickey and Axel (1975) P. A. Dickey and P. Axel, Phys. Rev. Lett. 35, 501 (1975).
- Yester et al. (1973) M. Yester, R. Anderm, and R. Morrison, Nucl. Phys. A 206, 593 (1973).
- Mafra et al. (1972) O. Mafra, S. Kuniyoshi, and J. Goldemberg, Nucl. Phys. A 186, 110 (1972).
- Khan and Knowles (1972) A. Khan and J. Knowles, Nucl. Phys. A 179, 333 (1972).
- Anderl et al. (1973) R. Anderl, M. Yester, and R. Morrison, Nucl. Phys. A 212, 221 (1973).
- Bowman et al. (1975) C. D. Bowman, I. G. Schröder, C. E. Dick, and H. E. Jackson, Phys. Rev. C 12, 863 (1975).
- Ostapenko et al. (1978) Y. B. Ostapenko, G. Smirenkin, A. Soldatov, V. Zhuchko, and Y. M. Tsipenyuk, Voprosy Atomnoy Nauki i Tekhniki, Seriya Yadernye Konstanty 3, 3 (1978).
- Soldatov and Smirenkin (1992) A. Soldatov and G. Smirenkin, Phys. At. Nuclei 55, 1757 (1992).
- Manfredini et al. (1966) A. Manfredini, M. Muchnik, L. Fiore, C. Ramorino, H. De Carvalho, R. Bösch, and W. Wölfli, Il Nuovo Cimento B (1965-1970) 44, 218 (1966).
- Herman et al. (2007) M. Herman, R. Capote, B. Carlson, P. Obložinský, M. Sin, A. Trkov, H. Wienke, and V. Zerkin, Nucl. Data Sheets 108, 2655 (2007), special Issue on Evaluations of Neutron Cross Sections.
- Ahmed et al. (2012) M. W. Ahmed, A. E. Champagne, C. R. Howell, W. M. Snow, R. P. Springer, and Y. Wu, HIGS2: The Next Generation Compton -ray Source, Tech. Rep. (Triangle Universities Nuclear Laboratory, 2012).