EasyCritics II. Testing its efficiency: new gravitational lens candidates in CFHTLenS
Abstract
We report the results of EasyCritics, a fully automated algorithm for the efficient search of strong-lensing (SL) regions in wide-field surveys, applied to the Canada-France-Hawaii Telescope Lensing Survey (CFHTLenS). By using only the photometric information of the brightest elliptical galaxies distributed over a wide redshift range () and without requiring the identification of arcs, our algorithm produces lensing potential models and catalogs of critical curves of the entire survey area. We explore several parameter set configurations in order to test the efficiency of our approach. In a specific configuration, EasyCritics generates only possibly super-critical regions in the CFHTLS area, drastically reducing the effective area for inspection from sq. deg to sq. deg, i.e. by more than two orders of magnitude. Among the pre-selected SL regions, we identify 32 of the 44 previously known lenses on the group and cluster scale, and discover 9 new promising lens candidates. The detection rate can be easily improved to by a simple modification in the parameter set, but at the expense of increasing the total number of possible SL candidates. Note that EasyCritics is fully complementary to other arc-finders since we characterize lenses instead of directly identifying arcs. Although future comparisons against numerical simulations are required for fully assessing the efficiency of EasyCritics, the algorithm seems very promising for upcoming surveys covering sq. deg, such as the Euclid mission and LSST, where the pre-selection of candidates for any kind of SL analysis will be indispensable due to the expected enormous data volume.
keywords:
cosmology: dark matter — galaxies: clusters: — gravitational lensing: strong — gravitational lensing: weak — galaxies: elliptical, cD — galaxies: evolution1 Introduction
Gravitational lensing by clusters of galaxies is among the main cosmological tools to access the nature of dark matter (DM) and the far universe. Strong lensing (SL) signatures probe the inner matter distribution of galaxy clusters, allowing robust mass reconstruction and magnification studies of the clusters core (e.g. Kneib et al., 2003; Broadhurst et al., 2005b, a; Zitrin et al., 2012b; Coe et al., 2012; Limousin et al., 2012; Jauzac et al., 2015). The apparent flux magnification turns galaxy clusters into gravitational telescopes, which can be used to study very high-redshift galaxies which would otherwise be too faint to be observed (e.g. Stark et al., 2007; Richard et al., 2008; Bouwens et al., 2009; Bradač et al., 2009; Hall et al., 2012; Zheng et al., 2012; Coe et al., 2013). Moreover, the abundance of strongly lensed background galaxies, which appear as gravitational arcs and multiple images, can be compared against predictions of the lensing efficiency of cluster-scale halos in simulations to test the current cosmological framework (Bartelmann et al., 1998; Bartelmann et al., 2003; Meneghetti et al., 2013). Several theoretical and observational studies have found that the CDM cosmological models underestimate the number of giant arcs on the sky by perhaps as much as an order of magnitude (known as the “arc statistics problem”; Bartelmann et al., 1998; Gladders et al., 2003; Li et al., 2006b). Besides, a long series of theoretical works have explored a variety of astrophysical effects of both the lenses and the sources, which can mitigate the tension of the arc statistics problem (e.g. Dalal et al., 2004; Wambsganss et al., 2004; Meneghetti et al., 2003; Torri et al., 2004; Puchwein et al., 2005; Meneghetti et al., 2007; Wambsganss et al., 2008; Mead et al., 2010); however, the discrepancy is not yet solved. It is important to notice that all studies conducted so far suffer from the lack of systematic arc surveys and from the limited abundance of giant arcs (Bayliss, 2012), making the available sample not uniform (Meneghetti et al., 2011, 2013), as well as by the fact that different approaches have been used. Therefore, enlarging and standardizing the sample of giant arcs by using a well-characterized selection function and common comparison methods, is mandatory for explaining or alleviating this controversy.
In recent years, automated algorithms have been developed for the search of gravitational arcs and multiple images (Lenzen et al., 2004; Horesh et al., 2005; Alard, 2006; Seidel & Bartelmann, 2007; Joseph et al., 2014; More et al., 2012; Gavazzi et al., 2014); however these approaches suffer from strong contamination and require a large amount of human intervention (More et al., 2012; Limousin et al., 2009; Cabanac et al., 2007; Maturi et al., 2014). Moreover, most of the detections are just candidates and only few hundred cases have been spectroscopically confirmed (e.g. Bayliss et al., 2011; Oguri et al., 2012; Carrasco et al., 2017). As a matter of fact, the search for SL systems has been conducted almost exclusively by visual inspection of several hundred thousand images. An attempt to deal with such a large amount of eye-balling has been based on citizen science, the SPACE WARPS project (SW; Marshall et al., 2016; More et al., 2016). Through crowd-sourced visual inspection, this program yields high purity and completeness samples. SW has recovered about of known lenses previously discovered on the Canada–France–Hawaii Telescope Legacy Survey (CFHTLS111http://www.cfht.hawaii.edu/Science/CFHTLS/), by dividing its sq. deg into overlapping 82 by 82 arcseconds tiles and performing more than 11 million image classifications over the course of 8 months, with the help of volunteers. Despite these results, SW depends on the number of citizen scientists and their performance, making it less competitive for the upcoming wide-field surveys ( sq. deg area) where there will be of the order of images to visually inspect and classify (assuming that the same tiling strategy is used). Performing those tasks in reasonable time thus requires to either increase the number of volunteers by orders of magnitude or change completely the approach and rely on robust and efficient automated pre-selection methods to robotically reduce the number of targets to be inspected.
In order to perform such a search for gravitational arcs on wide-field surveys with a significantly reduced number of spurious detections and minimal human intervention, in Stapelberg et al. (2018) we present our fully automated algorithm “EasyCritics”. Based on the assumption that light traces mass (LTM; Broadhurst et al., 2005c; Umetsu & Broadhurst, 2008; Zitrin et al., 2009), our algorithm constructs a simple model of the lensing potential for the total mass projected along each line of sight (LOS) on wide field surveys by using the flux and position of the brightest elliptical galaxies, in combination with their photometric redshift information and angular size. EasyCritics then finds the most likely super-critical regions on the sky, i.e. where the total surface mass density integrated along the LOS is sufficient to produce SL events.
The development of EasyCritics has been motivated by successful results of several previous mass reconstruction studies (e.g. Zitrin et al., 2009; Limousin et al., 2007, 2009, 2012; Richard et al., 2010; Jauzac et al., 2015; Caminha et al., 2017b, a); in particular, by the lens modeling analysis of several massive galaxy clusters presented in Zitrin et al. (2011) and by the arc-free approach described in Zitrin et al. (2012a). In those studies, they have pointed out that, by constructing a simple preliminary mass model based only on the light distribution of the cluster members (mostly elliptical galaxies), critical curves can be correctly predicted. Additionally, we have also included into our approach the contribution of extra but uncorrelated structures projected along the LOS, since it has been proved to significantly affect the total lensing cross section (Wambsganss et al., 2005; Hilbert et al., 2007; Puchwein & Hilbert, 2009; Wong et al., 2012; Ammons et al., 2014; Bayliss et al., 2014). Wong et al. (2012) have shown that multiple small cluster-scale halos along the LOS can enhance the lensing cross section, reaching, in some cases, values comparable to those of single massive halos. Therefore, EasyCritics not only searches for single massive SL galaxy clusters but also for alignments of multiple group- and small cluster-scale halos, which may also lead to successful detections of SL events on the sky.
In this paper we present the results of EasyCritics applied to the Canada–France–Hawaii Telescope Lensing Survey (CFHTLenS; Heymans et al., 2012), which is a based on the same observations as the CFHTLS-Wide survey. We test the efficiency of our automated approach by systematically exploring the parameter space and comparing the results with known lenses in the survey. We show that EasyCritics is able to identify more than 70% of the known lenses by pre-selecting for inspection only of the total survey area, which drastically reduces the total post-processing time. Among the pre-selected SL regions, we find 9 new promising lens candidates and several regions having a low or medium probability of containing a lens. Moreover we present statistics regarding the Einstein radius of the lens candidates and mass-scaling relations.
This paper is organized as follows: In §2 we give an overview of EasyCritics, while in §3 we summarize the main properties of CFHTLenS and describe the selection criteria for the sub-sample of the elliptical galaxies used to construct the lensing potential maps. Then, in §4 we introduce the reference sample of known lenses used in this work and explain the procedure of our systematic exploration of the parameter space. In §5 we present the results obtained from the parameter exploration analysis and report on the efficiency of our approach based on the detection rate and total number of pre-selected SL regions. In this section we also show the first characterizations of the SL region candidates and introduce the new promising lens candidates discovered by EasyCritics. In §6 we analyze possible systematics that might affect our results. Lastly, we summarize the main results and present the final conclusions in §7. Throughout the paper we assume a flat CDM cosmology with , , and km s-1 Mpc-1.
2 EasyCritics
Motivated by the successful results of the studies mentioned above, we have developed EasyCritics (Stapelberg et al., 2018), a new LTM approach based on a more efficient mathematical derivation of the critical curves, which allows us to perform a blind analysis of the data on wide field surveys, and does not require any list of pre-selected targets. Among other features, EasyCritics is built with the purpose of obtaining direct estimates of the lensing quantities in the field of interest by taking into account all the contribution of massive structures along the LOS. In brief, once the galaxies are selected that best trace the DM distribution (described in §3.2), they are sliced in several lens planes, distributed in the redshift range and located at the redshift bin center (). We then construct an individual lensing potential model for each of these lens planes. These models are constructed by assuming that the surface density at every lens plane can be idealized by a superposition of embedded galaxy-scale subhalos, , and a smooth group- or cluster-scale component . The latter component is derived from the galaxy distribution assuming that the DM component approximately follows the observed galaxy distribution of the selected galaxies. Neglecting any non-linear coupling between the lens planes (e.g. Schneider, 2014), we then compute the total lensing potential of the field under study as
| (1) |
where every is evaluated at its respective lens-plane redshift.
We start by creating the galaxy component for a given lens plane at , assuming a common axially symmetric power-law density profile, with slope , for all selected galaxies. This profile is then scaled linearly in amplitude by the observed luminosity (Brainerd et al., 1996). For a given galaxy , we thus have
| (2) |
where represents the ratio for galaxy-scale halos and corresponds to one of the free parameters of our approach, refers to the angular impact parameter and denotes the angular-diameter distance to the respective redshift bin . Note that the slope222We restrict to the interval to ensure a well-defined lensing potential on the whole domain . is also a free parameter of EasyCritics.
The Poisson equation relates the surface mass density profile to the lensing potential as
| (3) |
where we introduced the convergence , a dimensionless surface mass density. The convergence is normalized by the critical surface density for lensing , which depends on the angular-diameter distances to the lens plane , , to the source plane, , and between the lens plane and source plane, .
Then, the lensing potential due to the galaxy component of a lens plane at can be obtained by applying the Poisson equation (3) and the superposition principle:
| (4) |
where the index runs over all galaxies binned to the -th redshift slice at .
As anticipated, we find that the cluster-scale DM halos are smoother than the galaxy components and have a much higher overall mass scaling. The cluster-scale component for a lens plane at is modeled as a convolution of the galaxy component with a Gaussian function333 The choice of this function is empirically motivated (e.g. Zitrin et al., 2013).,
| (5) |
of smoothing window 444 For simplicity, we neglect the weak redshift dependence of , which may arise due to the mass-concentration relation, and we thus use a unique smoothing window for all redshift slices.. The kernel not only defines the smoothing scale but also affects the steepness of the profile of the cluster-scale halos and corresponds to another free parameter of our approach.
It is expected that not all selected galaxies are living in cluster environments, since they may also trace smaller group-scale structures along the LOS or just be isolated field galaxies. We thus introduce a conditional probability for our selected galaxies to trace a massive cluster-scale halo, , which depends on the local number density of selected galaxies of a given lens plane at and , which specifies the ‘critical’ number density of galaxies to satisfy the condition of being in a super-critical massive environment, which gives . The value of is given by the number of elliptical cluster members located in the lens plane of the main deflector.
In analogy to the galaxy component, by applying the Poisson equation and the superposition principle, the lensing potential due to the cluster-scale component of a lens plane at can be computed as
| (6) |
where we introduced an additional free parameter into our approach, , which represents the ratio for cluster-scale halos.
The lensing potential of a given lens plane at is then just the sum of both components,
| (7) |
Finally, the total lensing potential of the field under study is then computed via Eq. (1), adding all the lens-plane potentials , evaluating them at their respective lens-plane redshifts and neglecting any correlation between the lens-planes.
This new LTM approach has only five free parameters, which are calibrated by fitting critical curves to known gravitational arcs (explained in §4). These free parameters are listed in Table 1. All the details of EasyCritics and its practical application can be found in Stapelberg et al. (2018). It should be noted that we have simplified some equations of our algorithm in the text and we have also interchanged the order of the two-dimensional convolutions in order to give a better understanding to the reader.
| Symbol | Description |
|---|---|
| Slope of the power-law density profile | |
| ratio for galaxy-scale halos | |
| ratio for group- or cluster-scale halos | |
| Smoothing window for the Gaussian function | |
| Critical number density of LRGs |
3 The LRG catalogs
3.1 The CFHTLenS data
CFHTLenS is a wide field optical survey designed to accurately measure weak gravitational lensing from deep multicolour images. The data have been extracted from the CFHTLS. All imaging data of this survey have been obtained with the MegaPrime instrument555http://www.cfht.hawaii.edu/Instruments/Imaging/Megacam/, between the semesters 2003A and 2008B inclusive. MegaPrime is an optical multichip instrument with a field of view of and a pixel scale resolution of arcsec (Boulade et al., 2003). CFHTLenS spans 154 sq. deg in the five optical bands , with a point source limiting magnitude in the band of . Given the survey strategy, the median seeing is for the primary lensing -band, making CFHTLenS ideal for SL studies as well. Furthermore, its deep multicolour data result in accurate photometric redshifts (photo), with a photo scatter in the range and an average catastrophic outlier rate smaller than 10, when limited to the photo range and to objects with magnitudes in (Hildebrandt et al., 2012). The data reduction has been carried out with the THELI pipeline (Schirmer et al., 2003; Erben et al., 2005; Schirmer, 2013) following the procedures described in Erben et al. (2009). For a complete description of CFHTLenS data, see Erben et al. (2013).
3.2 Selection of the tracing galaxies
Our procedure is based on the well-tested underlying assumption that DM approximately follows light; hence, the key point is to select the best galaxies to be used as tracers. Several former studies have shown that bright elliptical galaxies (or luminous red galaxies; LRGs), are biased probes of the underlying matter distribution (e.g. Zehavi et al., 2005; Li et al., 2006a; Ho et al., 2009; White et al., 2011; Wong et al., 2013), and are observable up to relatively high redshift (Gladders & Yee, 2000, 2005; Gilbank et al., 2011). In particular, Wong et al. (2013) have shown that by using the light of LRGs projected on the sky over a wide redshift range (), one can predict the LOSs with the highest integrated mass densities. Furthermore, the observed elliptical galaxy distribution has been successfully used as the starting point of several lens–mass reconstruction studies of SL galaxy clusters and groups (e.g. Broadhurst et al., 2005b, a; Zitrin et al., 2009; Zitrin et al., 2011; Zitrin et al., 2012a). For these reasons, we use these galaxies to trace the DM distribution.

The selection procedure is based on: magnitude in the band, photo, spectral index , and size (semi-major axis). In order to include all possible elliptical galaxies, we start selecting all objects with 666As stated in Coleman et al. (1980), objects with spectral index corresponds to ’early-type’ E/S0 galaxies, to SBc barred spirals and to ’late-type’ spiral and irregular galaxies.. To ensure the precision of the photo of our galaxy candidates and to decrease the number of outliers, we limit the selection to objects falling within the magnitude and photo ranges and , respectively. This selection procedure results in a sample of elliptical galaxies with photo in excellent agreement with the available spectroscopic redshifts (spec; Hildebrandt et al., 2012, private communication), with an average photo scatter777The photo scatter, , is calculated as the standard deviation around the mean of . Objects with are considered as outliers. and an outlier rate (Fig. 1). Then, we apply a -correction to the fluxes and magnitudes of the selected LRGs using the template spectra described by Capak (2004) and the final transmittance curves for the MegaPrime filters.
To improve the redshift accuracy of our sample, we replace the photo of the galaxy candidates with the spec where available. Therefore, the given outlier rate and scatter are just upper limits. Hereafter, when referring to redshift in our galaxy sample, we mean the spectroscopic redshift when available and the photo otherwise.
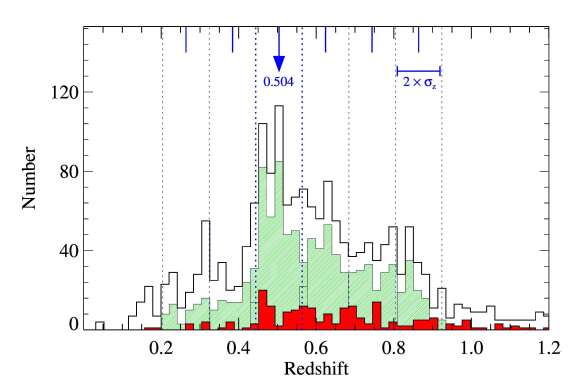
In order to create a smooth transition between the lensing potential maps, we divide the LRG sample into galaxy catalogs of each, with a conservative overlap of per side. As mentioned in §2, the survey is sliced in redshift bins of 888We conservatively decide to use the upper limit of the photo scatter but taking into account the whole CFHTLenS data, i.e. (Hildebrandt et al., 2012), to ensure that all massive structures are included. in thickness to cope with the photometric redshift uncertainties but still preserve correlated structures. Once the slices are created, the redshift of each elliptical galaxy is updated to the redshift center of its corresponding bin. In this step, we search for possible outliers by comparing galaxy sizes; if the size of a galaxy is larger than the average size of the brightest galaxies of the corresponding bin, then this galaxy is shifted to another redshift slice by applying an empirical size relation. We finally derive the Schechter luminosity function for each angular and redshift portion of the survey (LF; Schechter, 1976); all galaxies fainter than are removed from the catalogs. The characteristic magnitude, , corresponds to the slope change of the LF, from an exponential to a power-law form, dividing the bright tail from the faint galaxies. In order to ensure the inclusion of all LRGs and, at the same time, to remain in the magnitude range , we limit the values of to the range . For illustration, we show in Fig. 2 the redshift distribution of the LOS selected galaxies in the cutout centered on the SL galaxy cluster SA125 (More et al., 2012). The final selected LRGs are shown by the green histograms. By comparing with the spec distribution (red histogram), one can see that our selection procedure properly selects galaxies that belong to the most massive objects in the LOS, associated to the galaxy cluster SA125 and other small groups.
4 The parameter set configuration
In this section we explore several parameter sets in order to test the efficiency of EasyCritics to identify SL regions in wide field surveys. For this purpose, we define a reference sample of known SL systems previously found by other studies in CFHTLenS. From the reference sample, we select the most representative lenses in three different mass intervals, in order to perform three independent parameter calibrations, one for each mass range. Based on these parameter calibrations and aiming at identifying the majority of the known lenses, we then systematically explore the parameter space.
 |
 |
 |
4.1 Reference samples: known confirmed and candidate lenses
In order to find the most suitable parameter sets, we compare our results with confirmed lenses previously found on CFHTLenS and its predecessor CFHTLS999As mention earlier, CFHTLenS is a sub-sample of CFHTLS.. These surveys have been extensively used for the search of SL objects since their earliest releases, yielding to date of the order of 500 candidates, of which approximately 150 are confirmed lenses 101010Note that confirmed lenses correspond to a subset of the lens candidates sample.. Note that in the previous studies, the term “confirmed” lens not necessarily refers to a spectroscopic confirmation of the system; instead this term usually corresponds to objects that have been classified as real lens systems by several experts, making them the most promising candidates.
The known SL systems discovered in these surveys cover a very wide mass range, from to M⊙, encompassing galaxy-scale DM halos with Einstein radii , group-scale DM halos with Einstein radii in the range of 111111The upper limit of is somewhat arbitrary and may be considered by others as a characteristic size of a poor cluster., and massive galaxy clusters with Einstein radii (Oguri, 2006). Since our approach is designed to detect massive objects, we restrict the comparison to known lenses on group- and cluster-scales. For this purpose, we create our reference sample of known SL systems by selecting confirmed lenses with an Einstein radius . Since some galaxy-scale lenses are placed in group- or cluster-scale DM halos, there is a possibility that these SL systems have also been enhanced by the smooth lensing potential of the massive host halo. Therefore, we visually inspect all objects with Einstein radii , in order to include in our reference sample SL systems where the creation of arcs or multiple images is boosted by the external shear and convergence from the smooth group or cluster component (Limousin et al., 2007; Fassnacht et al., 2006; Oguri et al., 2005).
Our reference sample of known SL systems, namely the ‘known lenses’ (KLs) sample, lists 44 confirmed lenses. Furthermore, by applying the same criteria as before but now also including objects that have been flagged as candidate lenses, we create a sample of ‘known lens candidates’ (KCs), which is composed of 98 objects. Note that the KLs sample is a subset of the KCs sample, e.g. the 44 KLs are included in the KCs list. These objects are listed in Table LABEL:table:app:reference_sample, in Appendix A, together with their main characteristics; ID, Ra, Dec, redshift, Einstein radius (or distance to the arc), and reference publication.
4.2 Exploring the parameter space in three mass intervals
The mass range covered by the systems of the KL and KC samples, given by the Einstein radius or image separation, extends from to M⊙ (Oguri, 2006). As expected, different mass regimes require different mass scalings to initialize our approach. Therefore, we perform three independent parameter calibrations for three different mass intervals in order to find the initial parameter sets for our systematic parameter exploration. Then, aiming at identifying most of the KLs, we explore several parameter setups based on these initial parameter sets.
4.2.1 Parameter calibration: initial parameter sets for three different mass intervals
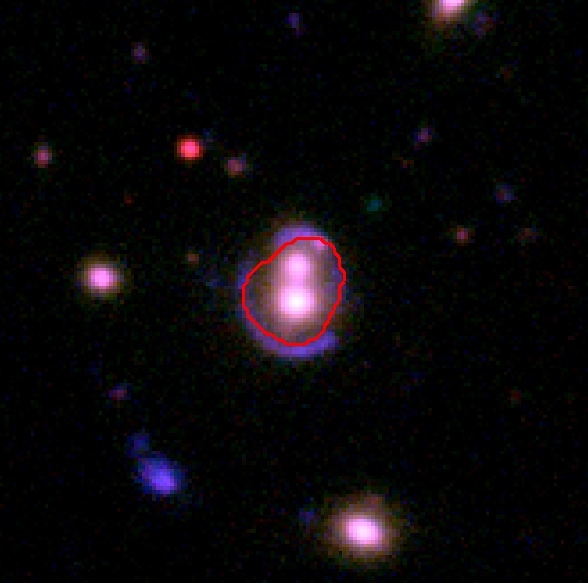
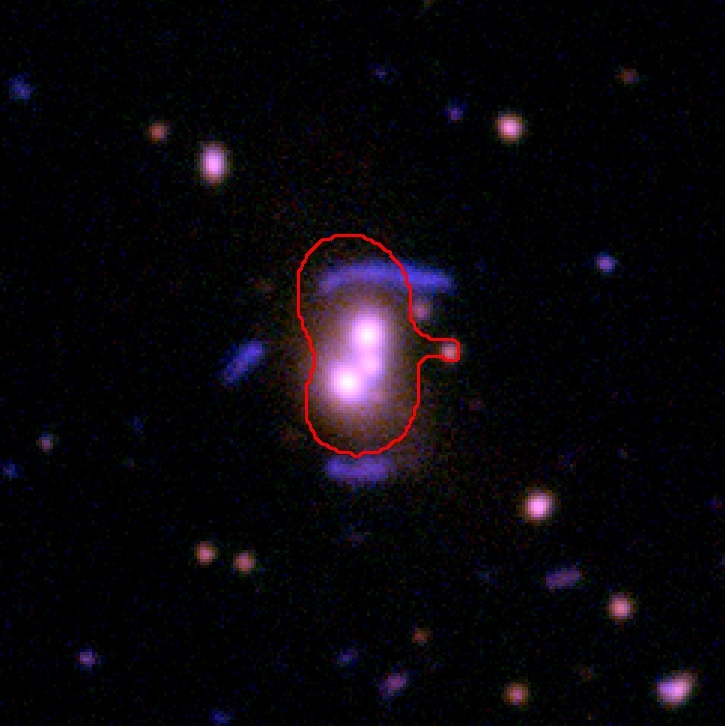
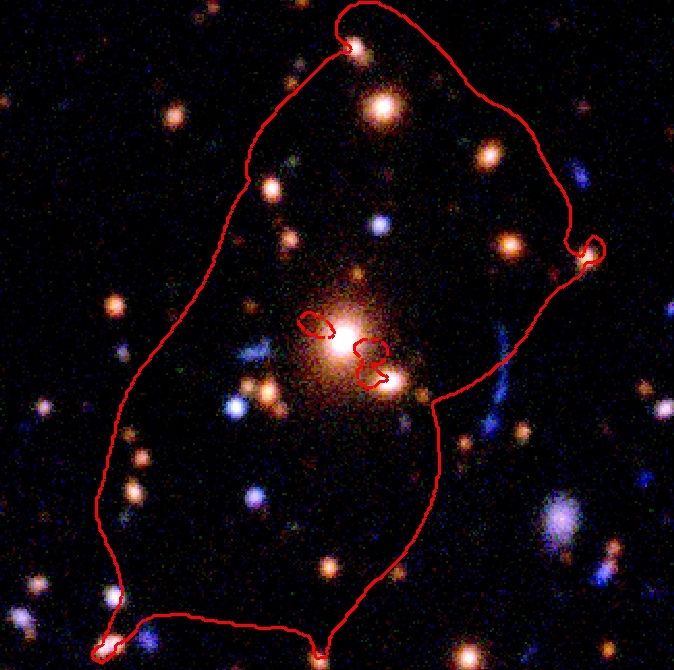
We select the most representative lenses in each mass interval; the SL galaxy groups SA14, SA22, and the SL galaxy cluster SA100, with Einstein radii of , and , respectively. For simplicity, we call these mass intervals , , and , correspondingly. These systems are shown in Fig. 3, while their coordinates and references are listed in Table LABEL:table:app:reference_sample (Appendix A). Note that for those systems, the Einstein radius measurement corresponds to the distance from the BCG to the average position where the arc is located (More et al., 2012).
For each of these lenses, we carry out an independent parameter calibration by fitting critical curves to the position of KL arcs; where critical curves are derived from the total lensing potential, described in §2 by Eq. (1), and by using the selected LRG catalogs (described in §3.2), centered on the BCG of the SL systems and covering a region of on the sky. Our calibration routine uses a parallelized generalization of the Metropolis-Hastings algorithm (Metropolis et al., 1953; Hastings, 1970), combining a Markov Chain Monte-Carlo (MCMC) sampling with an adaptive grid technique, introduced in Stapelberg et al. (2018). This new method is in general much faster than similar algorithms, while preserving the resolution necessary for accurate results.
The limited number of constraints results in highly degenerate parameters, which translates into several different combinations of equivalent free parameters yielding similar results, in terms of orders of magnitude for the . To cope with this degeneracy we fix three of our parameters to some physical values; , , and (previously described in §2). Neglecting any misalignment between the BCG light profile and the galaxy-scale DM profile, we use the light distribution of the brightest galaxies of the selected KLs to find the most suitable values for the power-law index . Although this assumption is not always accurate, the estimates of are fully consistent with those reported in previous works (e.g. Zitrin et al., 2012a, and references therein), falling within the range of . Hence, we set this parameter to . It is worth mentioning that in the studies cited above, it is shown that the locations of critical curves are very well predicted independently of the value for , as long as it is in the range . Since the parameter is defined as the ‘critical’ number density of selected galaxies for having a complete DM component (i.e. a SL system), it therefore can be directly extracted from the number of LRGs located in the redshift slice of the SL system, i.e. the galaxy members photometrically selected as described in §3.2. For a region, corresponds to a number of bright elliptical galaxies of , , and , for the SL galaxy groups SA14, SA22, and the SL galaxy cluster SA100, respectively. Finally, given the well-known abundance of baryons in clusters (e.g. Dai et al., 2010; Semboloni et al., 2011; Laganá et al., 2013; Ge et al., 2016), the parameter can be directly related to the parameter. In Stapelberg et al. (2018), we showed that the ratio between and is limited to the range , which is consistent with the expectations. Therefore, we set the galaxy-scale component to of the total mass scaling .
Consequently, the only remaining free parameters in our model are and . With these constraints we finally perform an independent calibration for each of the selected KLs by following the procedure described in our first paper. Throughout the calibration process, we assume the source plane to be at redshift , which is a representative source redshift for the observed giant arc population according to broadband photometric (e.g. Bayliss, 2012) and spectroscopic studies (e.g. Bayliss et al., 2011; Carrasco et al., 2017). The critical curves resulting from this minimization approach are shown in Fig. 3, while the calibrated parameters are listed in Table 2. As expected, the critical curves nicely match the locations of the arcs; there are relatively small deviations, which can be expected within the limits of the LTM approximation and the assumptions made in this analysis. Furthermore, by comparing our results for the SL galaxy group SA22 with the models from Verdugo et al. (2011); Verdugo et al. (2016), we can conclude that the approach used in this work reaches the expectations, e.g. consistent critical line estimates well suited to our goal of finding regions potentially containing strong lensing effects.
| M. R.a | KLb | |||||
|---|---|---|---|---|---|---|
| [%] | [ a.u.] | [′′] | ||||
| SA14 | 1.14 | 95 | 0.10 | |||
| SA22 | 1.14 | 163 | 0.10 | |||
| SA100 | 1.14 | 252 | 0.10 |
a Mass interval.
b ID from More et al. (2012).
c Relative to .
d The errors correspond to of the parameter distribution.
4.2.2 Parameter exploration: systematic probing of in each mass interval
Having chosen the initial parameter sets for the three mass intervals, we can systematically explore the parameters based on those initial values, aiming at identifying most of the KLs of the reference sample. Since the parameter represents the total mass scaling of each SL system and since its value depends on the mass interval, we can independently explore each mass interval by setting this parameter to the values in Table 2 for the corresponding interval, and by varying only .
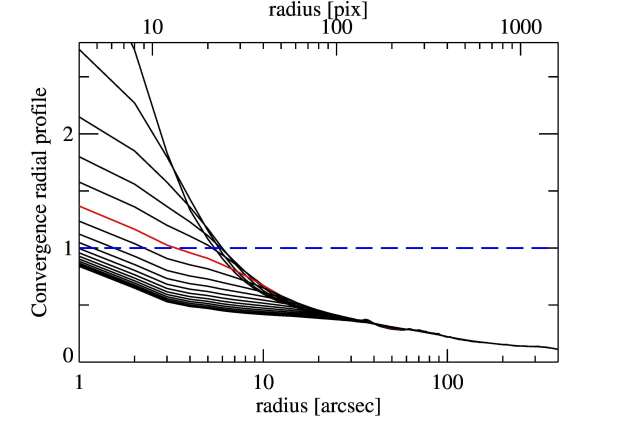
Furthermore, the radial convergence profiles of our selected KLs can turn from flat to super-critical matter distributions by changing only. This is because does not only determine the smoothness of the cluster-scale component but it also affects the steepness of its profile. In other words, in the particular case when and the overall mass normalization are fixed, the smoothness and steepness of the profile play the decisive role in the determination of the critical curves. For illustration, we show in Fig. 4 the dependence of the radial convergence profile as a function of for the SL galaxy group SA22. The continuous red line corresponds to the profile derived from the calibrated parameters for the mass interval , while the black lines correspond to profiles obtained from different values of . Note that is kept fixed through all the computations. From this figure, one can see the impact of on the concentration of the projected matter, which directly affects the ability to produce critical curves. Once all the parameters are set, we explore the parameter space by varying only.
For each of the three mass intervals, we create new parameter sets by fixing , , , and to the values obtained from the corresponding calibration based on the three reference lenses , and . We vary from till , in steps of . This exploration results in a total of 30 different parameter sets, i.e. 10 different values of for each mass interval. Finally, we apply EasyCritics to the whole area of CFHTLenS by using each of these parameter sets, i.e. we create lensing potential models, convergence maps, and critical curve catalogs for more than sq. deg, 30 times. This exhaustive task can be carried out thanks to the highly parallelized and efficient performance of EasyCritics, which is able to analyze a region of 1 sq. deg in less than 42 seconds (Stapelberg et al., 2018). These results are analyzed in the next section, where the SL region candidates generated by EasyCritics are compared with the KLs and KCs of the reference sample.
5 Testing EasyCritics: results, analysis, and new SL candidates
In this section we present the results of EasyCritics, after processing the whole area of CFHTLenS using 30 different parameter sets. These outcomes correspond to lensing potential models, convergence maps, and critical curve catalogs of the entire survey. We define the detection rate of our approach by comparing the pre-selected SL regions by EasyCritics with the KLs of the reference sample. We also determine the most suitable parameter set, as the one yielding the highest detection rate but still generating a low number of SL region candidates. We then analyze and correlate these results with Einstein radii, mass estimates, and luminosity density maps.Finally, we present a catalog of new SL candidates, provided by our approach and found in the completely automated way.
5.1 The detection rate of EasyCritics
Having processed the survey, we study the performance of our algorithm by comparing the SL region candidates generated by EasyCritics, with each of the 30 parameter sets, with the KLs of the reference sample.
We define the detection rate of our approach as the ratio between the number of pre-selected SL regions121212The center of our super-critical regions is defined as in Stapelberg et al. (2018). that coincide with the center of KLs, within a certain radius , and the total number of KLs in our reference sample. We choose a conservative value for the matching radius, given by , in order to take into account two independent effects: 1) the intrinsic offset between the peak of the light distribution and the cluster-scale DM halos (Becker et al., 2007; Johnston et al., 2007; Rozo et al., 2009, 2010; Oguri & Takada, 2011); 2) and an extra misalignment due to the nature of our approach, where uncorrelated structures along the LOS are stacked to produce the total lensing potential. The choice of is also motivated by the image size used in the SW project (More et al., 2016; Marshall et al., 2016), where they visually inspect several thousand tiles of size.
The parameter sets that predict most of the KLs are placed in the mass range , which corresponds to group and small galaxy cluster scales. As explained in §5.2 and §5.3, the mass scaling parameter of and concentrated DM halos are the most favorable configurations for the discovery of group and cluster lenses. In configuration , 36 of the pre-selected SL regions by EasyCritics coincide with the lenses from our reference sample. Counting the 44 KLs in the sample, this corresponds to a detection rate of . These results are followed by those from configuration , where 32 of the KLs are identified. In this setup EasyCritics reaches a detection rate of by pre-selecting regions for inspection. The detection rates in the other two mass intervals are poor, and therefore, they are not considered in the next analyses.
 |
 |
 |
 |
 |
 |
 |
 |
 |
5.2 Einstein-radius distributions
It has been shown that the Einstein radius, , is the most direct measurement of the total inner mass of SL systems (e.g. Broadhurst & Barkana, 2008; Zitrin et al., 2011); and therefore, by investigating its distribution one can obtain a direct understanding of the halo mass distribution of the lens population under study. In Fig. 5 we show the distribution of the Einstein radii returned by EasyCritics131313The derivation of is given in Stapelberg et al. (2018). obtained from 9 different parameter sets, including the most significant cases we considered.
For the three mass intervals (, , and ), the Einstein-radius distributions of the pre-selected SL regions show a qualitatively similar behavior. There is a strong increment in the number of super-critical regions generated by EasyCritics, together with a slight displacement of their distribution peak (from till ; black arrows in Fig. 5), when the smoothing window decreases from till . This correlation arises because the size of determines the capability of the 2D Gaussian function of boosting the cluster-scale component. Then, a small kernel produces a convolution function that concentrates most of the light and hence, most of the mass, in a very small region. This enhances the surface mass density for poor LRG environments when having high spatial densities, i.e. groups composed of few galaxies () that are highly concentrated can also reach the required amount of surface mass density to be critical. This effect is better seen by comparing the middle and left panels of Fig. 5, where the total number of super-critical regions increases by a factor of when decreases from to .
It should be mentioned that we observe, in all the explored parameter sets, a maximum of only 15 candidates having Einstein radii larger than ; of which 8 actually correspond to spurious detections given by photometric problems in the original catalogs of CFHTLenS, as explained in the following section. The other 7 remaining regions correspond to different group-scale objects aligned on the LOS but with relatively high offsets of the order of . One of these SL regions actually contains (at from its center) the known candidate SA8 (Table 3), located in a rich environment of LRGs. Despite this, we could not identify any SL signature on the other 6 regions, and therefore, they are not selected as possible SL candidates.
| IDa | R.A. | Dec. | Lens IDc | Rankf | Offsetg | |||||
|---|---|---|---|---|---|---|---|---|---|---|
| [J2000] | [J2000] | [′′] | [′′] | [km s-1] | [] | [′′] | ||||
| SLEC-J0202-1109 | 02:02:10.34 | -11:09:09.8 | 18.3 | SA2 | 0.48 | 5.0 | 758 | 2.720.21 | KL | 3.0 |
| SLEC-J0203-0734 | 02:03:20.40 | -07:34:43.3 | 13.5 | SA6 | 0.59 | 5.0 | 914 | 1.920.12 | KL | 7.5 |
| SLEC-J0203-0942 | 02:03:49.88 | -09:42:55.8 | 4.8 | SA7 | 0.25 | 5.0 | – – | – – | KL | 2.7 |
| SLEC-J0205-1105 | 02:05:03.22 | -11:05:47.0 | 5.5 | SA9 | 0.62 | 3.3 | 543 | 1.200.12 | KL | 1.0 |
| SLEC-J0206-0657 | 02:06:47.92 | -06:57:01.3 | 35.4 | SA10 | 0.49 | 3.2 | 856 | 3.650.36 | KL | 8.2 |
| SLEC-J0209-0643 | 02:09:29.66 | -06:43:08.5 | 17.5 | SA14 | 0.45 | 3.2 | – – | – – | KL | 5.6 |
| SLEC-J0214-0535 | 02:14:08.24 | -05:35:22.5 | 23.5 | SA22 | 0.44 | 7.1 | 638 | 2.210.19 | KL | 10.1 |
| SLEC-J0215-0440 | 02:15:28.95 | -04:40:47.0 | 16.1 | arc68c | 0.31 | 8.0 | – – | – – | KL | 9.7 |
| SLEC-J0219-0528 | 02:19:55.97 | -05:28:05.3 | 3.5 | SA36 | 0.35 | 4.0 | 724 | 3.180.28 | KL | 9.0 |
| SLEC-J0224-1058 | 02:24:09.40 | -10:58:08.0 | 8.6 | SW1 | 0.50 | 4.8 | – – | – – | KL | 2.1 |
| SLEC-J0225-0737 | 02:25:46.11 | -07:37:41.5 | 9.4 | SA50 | 0.51 | 5.8 | 540 | 1.320.15 | KL | 3.0 |
| SLEC-J0227-1056 | 02:27:16.45 | -10:56:02.5 | 4.0 | SW22 | 0.40 | 4.8 | – – | – – | KL | 0.2 |
| SLEC-J0227-0451 | 02:27:40.34 | -04:51:32.0 | 8.5 | XLSSC022 | 0.29 | 5.0 | – – | – – | KL | 1.4 |
| SLEC-J0229-0554 | 02:29:17.34 | -05:54:05.8 | 6.5 | SA55 | 0.38 | 3.2 | 701 | 2.580.47 | KL | 0.4 |
| SLEC-J0852-0343 | 08:52:07.20 | -03:43:15.8 | 4.8 | SA63 | 0.48 | 5.0 | 561 | 1.510.16 | KL | 0.6 |
| SLEC-J0854-0121 | 08:54:46.60 | -01:21:37.3 | 10.3 | SA66 | 0.35 | 4.8 | 644 | 2.420.17 | KL | 0.7 |
| SLEC-J0858-0240 | 08:58:49.95 | -02:40:00.3 | 25.8 | SA71 | 0.36 | 3.7 | – – | – – | KL | 38.3 |
| SLEC-J0859-0345 | 08:59:14.54 | -03:45:14.7 | 6.0 | SA72 | 0.64 | 4.5 | 466 | 1.440.16 | KL | 0.1 |
| SLEC-J0901-0158 | 09:01:39.23 | -01:58:56.3 | 15.0 | SL2SJ0901-0158 | 0.29 | 6.8 | – – | – – | KL | 5.3 |
| SLEC-J1357+5317 | 13:57:25.69 | +53:17:42.7 | 15.8 | SA87 | 0.54 | 3.5 | 425 | 2.350.28 | KL | 2.2 |
| SLEC-J1401+5654 | 14:01:10.37 | +56:54:20.9 | 4.9 | SA90 | 0.53 | 3.7 | 1015 | 2.820.27 | KL | 0.8 |
| SLEC-J1405+5445 | 14:05:54.47 | +54:45:48.4 | 10.8 | SA96 | 0.41 | 3.9 | 449 | 2.740.42 | KL | 1.1 |
| SLEC-J1408+5429 | 14:08:13.70 | +54:29:03.7 | 10.0 | SA97 | 0.42 | 8.0 | 384 | 1.090.23 | KL | 4.5 |
| SLEC-J1414+5447 | 14:14:47.24 | +54:47:04.4 | 28.5 | SA100 | 0.63 | 14.7 | 969 | 5.490.35 | KL | 0.9 |
| SLEC-J1419+5326 | 14:19:11.92 | +53:26:13.7 | 9.3 | SA102 | 0.69 | 9.9 | 1028 | 3.400.27 | KL | 3.1 |
| SLEC-J1429+5625 | 14:29:34.06 | +56:25:40.2 | 14.6 | SW4 | 0.50 | 5.9 | – – | – – | KL | 1.6 |
| SLEC-J1431+5533 | 14:31:39.72 | +55:33:24.7 | 3.4 | SA113 | 0.67 | 4.0 | 745 | 2.210.23 | KL | 1.9 |
| SLEC-J2202+0234 | 22:02:57.01 | +02:34:33.2 | 21.6 | SW7 | 0.50 | 6.8 | – – | – – | KL | 2.3 |
| SLEC-J2206+0411 | 22:06:41.94 | +04:11:30.7 | 4.1 | SA121 | 0.62 | 3.7 | 443 | 1.760.26 | KL | 1.3 |
| SLEC-J2213-0018 | 22:13:06.30 | -00:18:28.8 | 10.5 | arc20a | 0.49 | 5.0 | – – | – – | KL | 9.0 |
| SLEC-J2214+0110 | 22:14:18.98 | +01:10:31.9 | 20.4 | SA125 | 0.74 | 8.0 | 695 | 3.660.34 | KL | 3.0 |
| SLEC-J2220+0058 | 22:20:52.24 | +00:58:14.9 | 13.5 | arc54c | 0.41 | 8.0 | – – | – – | KL | 11.0 |
| SLEC-J0204-1024 | 02:04:55.36 | -10:24:18.3 | 40.8 | SA8 | 0.33 | 10.8 | 654 | 2.850.44 | KC | 20.1 |
| SLEC-J0209-0354 | 02:09:57.61 | -03:54:58.0 | 3.6 | SA15 | 0.44 | 3.9 | 534 | 0.780.06 | KC | 1.3 |
| SLEC-J0216-0935 | 02:16:04.63 | -09:35:06.5 | 7.8 | SA26 | 0.69 | 16.4 | 853 | 5.600.31 | KC | 0.4 |
| SLEC-J0228-0949 | 02:28:32.70 | -09:49:27.5 | 33.5 | SA54 | 0.45 | 6.3 | 793 | 3.730.38 | KC | 20.3 |
| SLEC-J0848-0407 | 08:48:23.51 | -04:07:26.5 | 10.5 | SA61 | 0.51 | 7.4 | 677 | 3.300.35 | KC | 11.4 |
| SLEC-J0900-0230 | 09:00:49.33 | -02:30:53.5 | 28.0 | SA74 | 0.36 | 3.2 | 672 | 2.830.31 | KC | 11.5 |
| SLEC-J1356+5527 | 13:56:49.31 | +55:27:07.2 | 8.9 | SA86 | 0.46 | 3.7 | 600 | 2.880.25 | KC | 0.2 |
| SLEC-J1402+5257 | 14:02:06.35 | +52:57:07.2 | 4.5 | arc81c | 0.51 | 5.0 | – – | – – | KC | 0.4 |
| SLEC-J1411+5212 | 14:11:20.91 | +52:12:09.7 | 29.6 | SA98 | 0.52 | 18.4 | 932 | 3.370.46 | KC | 3.5 |
| SLEC-J1428+5213 | 14:28:34.84 | +52:13:13.2 | 18.4 | SA111 | 0.52 | 5.0 | 889 | 3.730.26 | KC | 6.7 |
| SLEC-J2210+0023 | 22:10:33.03 | +00:23:51.4 | 3.5 | arc53c | 0.58 | 4.0 | – – | – – | KC | 1.1 |
| SLEC-J2215+0102 | 22:15:13.77 | +01:02:39.9 | 9.6 | arc23a | 0.69 | 7.0 | – – | – – | KC | 5.6 |
a ID of the SL region candidates generated by EasyCritics. The name is given by the acronym Strong Lensing regions by EasyCritcs (SLEC) and the corresponding location in sexagesimal coordinates.
b Einstein radius derived from the critical curves of the SL regions.
c IDs from Cabanac et al. (2007), Limousin et al. (2009), More et al. (2012), Maturi et al. (2014), and More et al. (2016). The corresponding publications of each lens are listed in Table LABEL:table:app:reference_sample, Appendix A.
d Corresponds to the distance from the BCG of the lens system till the average location of the arc.
e Measurements from Foëx et al. (2012).
f Ranking from previous studies. KL stands for known lenses, while KC stands for known candidates. More details in Table LABEL:table:app:reference_sample, Appendix A.
g Distance between the location of the KLs or KCs and the center of the predicted critical curves, defined in Stapelberg et al. (2018).
5.3 The most suitable parameter set:
As mentioned above, the parameter sets that yield the highest efficiency to correctly identify KLs belong to the intermediate mass interval , which maximizes the probability of generating lenses at the group- and small cluster-scales. These results are indeed expected, since the majority of the galaxies of the Universe are living in groups (Limousin et al., 2009). In fact, extrapolating the results from Oguri et al. (2006) to the total area of the CFHTLenS ( sq. deg) and assuming an equivalent magnification factor in all cases, we anticipate lenses in the group-scale and SL massive galaxy clusters, i.e. we expect to discover about 4 times more SL galaxy groups than clusters (Limousin et al., 2009; Cabanac et al., 2007).
In configuration , EasyCritics generates only possibly super-critical regions. Among these pre-selected SL regions, we identify 32 of the 44 previously KLs corresponding to a detection rate of . We adopt this specific setup as the ‘best’ parameter set because of the high number of identified KLs and the relatively low amount of SL region candidates, which helps to decrease both the total post-processing time and the size in the final sample of tentative SL candidates. However, determining the parameter set representing the best compromise between purity and completeness can only be done with extensive simulations or exhaustive observational follow-up campaigns. The coordinates of the pre-selected SL regions generated by our approach in configuration that correctly match the KLs of the reference sample, together with their main properties, are listed in Table 3. Note that when compared with the KCs, the efficiency drops to ; however, it is expected to find few previously known low ranked candidates, since their nature is not clear yet.
The Einstein-radius distribution (central panel in Fig. 5) derived from configuration peaks at , which is in agreement, within the errors, with the results of the Einstein-radius distribution derived from 10 000 SDSS clusters in Zitrin et al. (2012a). Note that even if most of the SL regions are in the range , our approach also generates super-critical regions with larger Einstein radii. In fact, several of these massive regions are those matching the lenses from the reference samples. These objects are studied below, where their characteristics are compared with the properties of the KLs and KCs.
|
|
|
5.4 Einstein radius vs lens properties
In order to verify whether the features of the pre-selected SL regions by our approach agree with the properties of the cluster lensing population, we compare our results with mass and luminosity estimates of the reference lenses, which have been previously computed in former studies. In doing so, it is important to remember that here we are not fitting lens by lens as done in the literature, instead we are predicting the lens properties by using fixed values of the parameters for the whole population. In configuration , there are 32 super-critical regions matching with KLs and 12 with KCs. We then have a total of 44 pre-selected SL regions that coincide with formerly studied lenses. These regions and their main properties derived from EasyCritics are listed in Table 3, together with all the relevant information from previous studies.
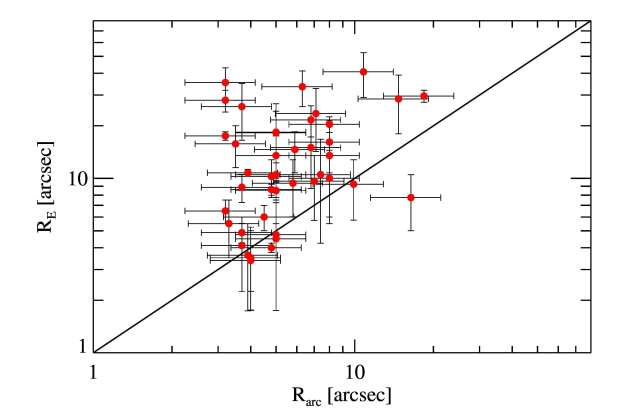
We start by comparing the Einstein radius, , of our pre-selected SL regions with the arc radius, , which is defined as the distance from the BCG of the lens system till the average location of the visible arc. A one-to-one relation is not expected due to the fixed value for the source redshift used in our calculations and the different redshifts where the lensed galaxies are placed. Furthermore, we are in general overestimating the inner mass of the regions by decreasing the kernel size as explained in §5.2. Thus, a large scatter is expected as well as an excess in the size of our critical curves as shown in Fig. 6 (panel ).
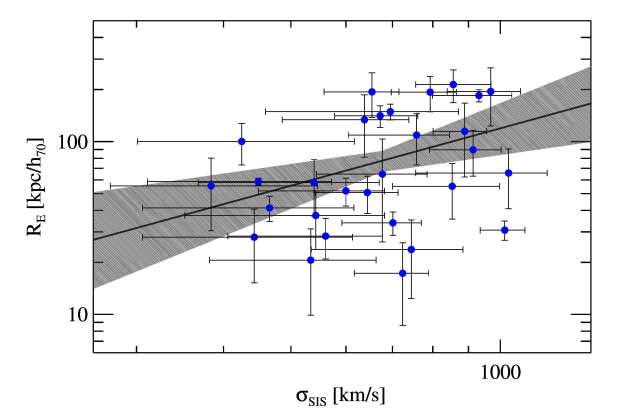
Then, by assuming that most of the mass is concentrated in the lens plane of the main deflector, we compute the physical Einstein radius of each region by using the redshift of the associated lens. This quantity is less biased when comparing with the intrinsic properties of lenses, since it is corrected by angular scale factors and then represents a physical size in the lens plane. We use the weak lensing (WL) measurements from Limousin et al. (2009) and Foëx et al. (2012) to compare the total mass of the reference lenses with our results. In these WL studies, they assume a singular isothermal sphere (SIS) profile to compute their mass estimates, which is parameterized by the velocity dispersion parameter . Then, we focus on estimates of the total mass via the velocity dispersion parameter and core masses through the Einstein radius . Due to the low mass of some small groups, not all lenses have WL measurements and not all of them coincide with our 44 pre-selected SL regions. This results in only 29 objects matching our SL candidates and having WL data. The range of this SL–WL sample goes from km s-1 to km s-1, with an average value of km s-1, which is used as a pivot value for the next step of the analysis. Fig. 6 (panel ) shows the plane for these 29 SL–WL systems. The correlation is expected as well as a large dispersion in the relation. For a more quantitative assessment, we fit the data by performing a Levenberg-Marquardt least-squares fit and assuming a power-law scaling relation given by
| (8) |
where is chosen to be the mean value of the SL–WL sample, which is a representative normalization of these objects and optimizes the fit of the scaling relation, reducing the correlation between the logarithmic slope and normalization , as pointed out in Foëx et al. (2012). The best-fitting results are listed in Table 4 and shown in Fig. 6 (panel ) by the continuous black line and the gray region. The average scatter of this relation is . This large dispersion can be explained by the combination of the large uncertainties in the measurements of the velocity dispersion parameter, due to the intrinsic low WL signal of groups, and the construction of our method itself. Nonetheless, the fact that these two independent estimates correlate with an accuracy of better than is by itself remarkable, since the WL approach is based on the statistical analysis of the background galaxies, without using any photometric information of the galaxy members, while our estimates are derived directly from the luminosity data of the LRGs.
| Scaling law | Pivot valuea | |||
|---|---|---|---|---|
| [kpc] | ||||
| 677 [km s-1] | 7911 | 1.050.52 | 0.370.12 | |
| 6712 | 0.730.29 | 0.310.09 |
a These normalizations correspond to the average values of our SL–WL sample, and , respectively.
b Average scatter of the corresponding correlation.
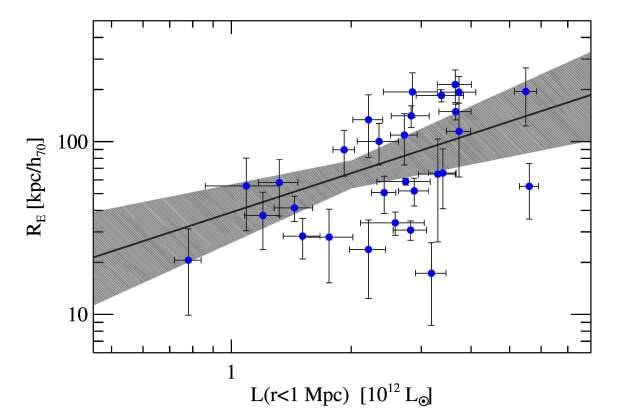
A better correlation is expected between the Einstein radii of the SL regions and the total luminosities of the systems, since the luminosity is the observable on which EasyCritics is based. The luminosity density maps of the 29 SL–WL systems are also obtained from Foëx et al. (2012). They have derived the total luminosity of each lens by collapsing the individual luminosities of the galaxy members (within a radius of 1 Mpc), which have been previously selected by using a red-sequence technique (e.g. Gladders & Yee, 2000, 2005) and applying a luminosity cut (). This process results in total luminosities ranging from till . The total luminosities of our SL–WL sample are in the same range above and have an average total luminosity of , which is consistent with the previous results as well. The plane for the 29 SL systems is presented in Fig. 6 (panel ). By fitting the same power-law scaling relation given by Eq. (8), but using the average total luminosity as normalization, we obtain an average scatter of , which is slightly smaller than the dispersion obtained in the relation. The best-fitting parameters are listed in Table 4 and its relation is presented in panel in analogy to the previous panel.
In interpreting these results, note that the purpose of EasyCritics is not to estimate the lens features but to find super-critical regions; thus, this analysis serves just as a consistency check.
5.5 New SL candidates and inspection efficiency
Given the expected number of SL galaxy clusters and groups in numerical simulations (Oguri et al., 2006) and the number of KLs, one can see that it is still possible to find missing lenses in the survey. Thus, we systematically search for new SL candidates. In configuration , EasyCritics produces of the order of super-critical regions, which are sorted by their Einstein radii in order to start the search by looking first at the more promising regions. We use the -, -, and -band imaging data from CFHTLenS to generate color composite images and RGB FITS files of all pre-selected SL regions. These files are created by using our own IDL routines and by choosing an adequate color scale, in order to maximize the contrast between faint extended objects and LRGs. The RGB FITS cut-outs are centered on the candidate centers and cover an area of . This choice is motivated by the average angular size of the Einstein radius of known massive gravitational lenses, and in order to compare with the results of SW as well. Note that there are only 12 regions with Einstein radii , where the analysis is carried out in a larger area of .
Aiming at obtaining a sample minimally biased by subjective decisions, all candidates in this configuration are visually inspected by three authors of this work (MC, SS, MM)141414 MC: Mauricio Carrasco; SS: Sebastian Stapelberg; MM: Matteo Maturi.. Then, in order to standardize our results, the pre-selected SL regions are ranked by applying the same scale used in the SW project, from (with a step size of 0.5). Where corresponds to regions unlikely to contain a lens; to regions possibly containing a lens; to regions probably containing a lens; and to regions almost certainly containing a lens (More et al., 2016). The fact that CFHTLenS has been analyzed several times for many years significantly decreases the probability of discovering new spectacular SL systems, e.g. giant arcs around clusters or groups. Thus, we do not expect to find any new candidates with . However, we have found 9 systems showing prominent SL features, which are classified with a final . They are presented in Fig. 7, Appendix B. Our visual inspection has also yielded several regions having a low or medium probability of containing a lens (). The new SL candidates identified by EasyCritics (with ) are listed in Table 5. We have named our SL regions as SLEC-Jhhmmddmm, which stands for Strong Lensing regions by EasyCritics and the corresponding location in sexagesimal coordinates.
It is worth mentioning that, given the low number of SL region candidates produced by EasyCritics, the effective area for inspection can be dramatically reduced by assuming that the chosen size of is enough to detect SL signatures around the center of group- and cluster-scale lenses, which has been already confirmed by the SW project (More et al., 2016; Marshall et al., 2016). The area of one tile () times pre-selected SL region candidates to analyze, results in an effective area of sq. deg, which corresponds to only of the total area of CFHTLenS ( sq. deg). Therefore, the final area where the search is performed is more than two orders of magnitude smaller than the original field. In other words, by using EasyCritics, we effectively reduce the area which has to be visually inspected or where any arcfinder algorithm is executed, which is translated into a large decrease of the total achievement time, from years to weeks. Consequently, EasyCritics is ideal for the upcoming sq. deg surveys where pre-selection of candidates for inspection is mandatory due to the enormous amount of data that these missions are going to yield.
| IDa | R.A. | Dec. | Rank | |
|---|---|---|---|---|
| [J2000] | [J2000] | [′′] | ||
| SLEC-J0211–0609 | 02:11:13.90 | -06:09:48.8 | 19 | 2.5 |
| SLEC-J1405+5356 | 14:05:33.73 | +53:56:12.7 | 7 | 2.5 |
| SLEC-J0211–0422 | 02:11:22.58 | -04:22:05.2 | 7 | 2.4 |
| SLEC-J0213–0951 | 02:13:23.75 | -09:51:40.2 | 11 | 2.1 |
| SLEC-J0204–1017 | 02:04:58.29 | -10:17:31.3 | 13 | 2.0 |
| SLEC-J2220+0058 | 22:20:51.59 | +00:58:15.7 | 12 | 2.0 |
| SLEC-J0233–0530 | 02:33:39.75 | -05:30:36.7 | 11 | 2.0 |
| SLEC-J0216–0558 | 02:16:23.52 | -05:58:46.0 | 7 | 2.0 |
| SLEC-J0212–0820 | 02:12:35.22 | -08:20:45.3 | 12 | 2.0 |
a ID of the new SL candidates. The name is given by the acronym: Strong Lensing regions by EasyCritcs (SLEC) and the corresponding location in sexagesimal coordinates.
6 Discussion
In this section we explore some aspects that may affect our results and interpretations, such as the mass distribution of the KLs matching with the pre-selected SL regions, problems in the photometric catalogs of CFHTLenS, and possible biases in our calibration routine or parameter selection procedure.
6.1 Consistency checks
The correlations discussed in §5.4 might suffer some bias if the super-critical regions generated by EasyCritics were not well distributed over the three mass intervals studied in this work. Nevertheless, from Fig. 6 one can see that the pre-selected super-critical regions are homogeneously spread within , covering a very wide mass range of approximately 3 orders of magnitude (Oguri et al., 2006). Thus, we do not find any indication of possible biases in our results due to a preferred mass interval.
6.2 Missed known lenses
In configuration , EasyCritics is not able to predict super-critical regions for of the KLs of the reference sample. Due to extended halos of bright stars, several regions in the CFHTLenS imaging data are suffering from photometric imperfections, and therefore have been masked (Erben et al., 2013). This masking procedure results in a large decrease in the number of galaxies within areas of several square arcseconds. Since our method is based on the luminosity data of LRGs only, a decline in the galaxy count is directly translated into a decrease in the surface mass density of the DM component, as well as in its weight . Therefore, it is expected to create sub-critical regions in masked areas. Among the 12 missed KLs, 3 have large masked regions around their centers, resulting in flat sub-critical convergence profiles. These objects correspond to the KLs SA103, SA123, and SW3. Taking this into account, the final detection rate of our approach reaches (and for ), since there are only 41 KLs with reliable photometric data.
The other 9 remaining missed KLs might easily reach the super-critical condition by a slight modification in the used parameter set, as shown in Fig. 5. For a better compromise between purity and completeness, a new calibration routine is currently being implemented, where specific parameter set configurations are applied to different mass intervals, given by the density of LRGs in the studied field. This new procedure is explained in the next subsection and presented in a forthcoming paper.
6.3 New calibration routine
We are developing a new calibration routine for EasyCritics, which is going to extend the currently implemented approach by replacing the calibration of parameters on individual known lenses by a method capable of a fully-automated optimization on an entire set of (arbitrarily many) known lenses simultaneously. This ensures that the calibration will be most sensitive to the statistical properties of the lens population rather than to individual properties that may vary from case to case.
This new strategy starts with a classification of known lenses into different mass intervals according to a criterion based on the richness and galaxy number density profiles. For each set defined in such a way, a simultaneous multi-candidate optimization is applied. This new optimization process uses the same MCMC approach described in our first paper, but with a new objective function that includes a larger number of terms. These terms could include the mean deviation between the Einstein radii and the location of arcs, the number of pre-selected SL regions, and the total number of selected or generated SL regions. In other words, the new objective function is defined such that an optimal compromise is achieved between completeness and purity. This new routine is fully described in a forthcoming paper (Stapelberg et al 2018, in prep).
6.4 Large Einstein radii and catalog problems
As mentioned earlier, in configuration , only 12 SL region candidates created by EasyCritics have Einstein radii larger than . Among them, 5 regions are boosted by uncorrelated small group-scale objects aligned in the LOS, but with offsets of the order of . One of these SL regions is located in a rich environment of LRGs, which actually encloses (at from its center) the known candidate SA8 (Table 3). However, the other 4 super-critical regions do not show any clear SL signature, and are therefore not selected as possible SL candidates.
The 7 remaining region candidates actually correspond to spurious detections given by some photometric problems in the CFHTLenS catalogs. In 5 of these regions, critical curves have been produced by a wrong association of satellite tracks to LRGs. The long spatial alignment of these fake measurements considerably augments the luminosity density of the field, resulting in large massive regions having long but narrow critical curves. The other 2 super-critical regions are the product of erroneous classifications of bright stars as elliptical galaxies, which affect the shapes and sizes of critical curves as well. In general, these photometric problems are wrongly generating critical curves of all sizes; nonetheless, these artifacts are producing not more than of the total pre-selected SL regions. These objects are then classified as spurious detections or artificial candidates. These issues can be solved by a simple modification of the SExtractor parameters (Bertin & Arnouts, 1996) and by running an automated satellite removal procedure; however, these tasks are beyond the scope of this work. Since the number of spurious detections due to these problems is very low, we leave these improvements for future studies.
7 Summary and conclusions
In this paper we reported the results of EasyCritics applied to CFHTLenS. Based on the well-known LTM assumption, our algorithm constructs a simple lensing potential model of the total mass projected along the LOS, using only the photometric information of the brightest LRGs distributed in the redshift range .
We used CFHTLenS data, which have been extensively analyzed in the past, to construct the reference samples for finding the initial parameter sets and for testing the performance of our code. These catalogs are composed of 44 secure or confirmed KLs, from a total of 98 KCs, spanning a mass range from to M⊙. Given the nature of our approach, a different mass scaling parameter is required for a different mass interval. Therefore, in order to cover the majority of this mass range and to find the initial parameter sets for our systematic parameter exploration, we performed three independent parameter calibrations; one for each different mass interval (, , and ). We chose the most representative lenses in these mass scales; the SL galaxy groups SA14, SA22, and the SL galaxy cluster SA100, with Einstein radii of , and , respectively. Once the initial parameter sets were found, we systematically explored the parameter space based on those initial values, aiming at identifying most of the KLs of the reference sample. For each of the three mass intervals, we created several new parameter sets by fixing , , , and to the values obtained from the corresponding calibration (Table 2), and by varying from till , in steps of . This exploration results in a total of 30 different parameter sets, i.e. 10 different values of for each mass interval. We then applied EasyCritics to the whole area of CFHTLenS using each of these parameter sets.
Once the survey had been processed, we studied the performance of our algorithm by comparing the SL region candidates generated by EasyCritics, in each of the 30 parameter sets, with the KLs of the reference sample. The parameter set configurations that predicted most of the KLs are placed in the mass range , which maximizes the probability of generating lenses in the group and small cluster scales. These results were indeed expected since the majority of the galaxies of the Universe are living in groups. In configuration , our algorithm pre-selected 32 out of 44 KLs, corresponding to a detection rate of . To achieve this, EasyCritics left only possibly super-critical regions for inspection. The parameter set reached a detection rate of by generating SL region candidates. Even though the ‘best’ parameter set can only be found by using numerical simulations, we chose configuration to perform our analysis and search for new candidates due to the high number of identified KLs and the low amount of SL region candidates left for inspection.
We presented the Einstein-radius distribution of the pre-selected SL regions of configuration , which peaked at and agreed well with previous observations. We found that only 12 SL regions showed excessively large Einstein radii (), of which 7 were produced by photometric problems in the CFHTLenS catalogs. The other 5 remaining SL regions were boosted by uncorrelated small group-scale objects aligned in the LOS, but with large offsets. Among them, one SL region is enclosing the known candidate SA8, at from its center. In total, among the pre-selected candidates, there were 32 super-critical regions matching with KLs and 12 with KCs, and only of the total SL regions were spurious detection caused by imperfections in the photometric catalog.
We also compared our results with WL velocity dispersion and luminosity estimates of the reference lenses. These quantities are direct indicators of the total mass of the clusters, and therefore, a correlation with the Einstein radius is expected. In configuration , there were 29 KLs matching with our pre-selected SL regions and having WL velocity dispersion and luminosity measurements, whose ranges go from km s-1 to km s-1, with an average value of km s-1, and from to , with an average total luminosity of , respectively. By analyzing the and planes, we showed that the Einstein radius measurements derived from our SL regions correlate well with estimates of total luminosity and WL velocity dispersion, and therefore, with the total projected mass of the lenses. In fact, these correlations are well characterized by a power-law scaling relation, with average scatter of and , respectively. Despite the large scatter, the fact that these independent estimates correlated with an accuracy of the order of is by itself remarkable, since these approaches are based on completely independent methods.
Finally, having confirmed that EasyCritics was able to identify the location of most of the KLs and reproduced their features as well, we performed a systematic search of new SL candidates. We created RGB FITS files for all the pre-selected candidates generated in configuration . Each of the cut-outs was centered on the candidate center and covered an area of . Despite the fact that CFHTLenS data have been extensively analyzed by various teams and various methods for several years, we found 9 new systems showing prominent SL features and several regions having a low or medium probability of containing a lens. We also showed that given the low number of SL region candidates pre-selected by EasyCritics, the effective area for inspection was dramatically reduced from sq. deg to sq. deg, which corresponds to only of the total area, indicating the power of EasyCritics as a pre-selection method.
Summing up, EasyCritics is a very successful and efficient method for the search of SL systems. It was able to identify of the previously KLs by generating only SL regions for inspection, with less than of spurious detections. This method effectively reduced the area where the inspection took place by more than two orders of magnitude, resulting in a large decrease of both the total achievement time and the manual post-processing. Furthermore, EasyCritics correctly provided a first characterization of the lensing properties of the region candidates, such as their Einstein radii and convergence profiles. Even though the final answers regarding its efficiency and the implications of its results for cosmological inference will be addressed in a forthcoming paper, in which EasyCritics will be tested against extensive numerical simulations, we can already conclude that EasyCritics is a very promising algorithm to find and characterize SL systems in wide-field surveys. Consequently, this new approach is ideal for upcoming surveys covering sq. deg, such as the Euclid mission and LSST, where a pre-selection of candidates for any kind of SL analysis will be indispensable due to the expected enormous data volume.
Acknowledgments
This work was supported by the Transregional Collaborative Research Center TRR 33 “The Dark Universe”.
References
- Alard (2006) Alard C., 2006, ArXiv Astrophysics e-prints,
- Ammons et al. (2014) Ammons S. M., Wong K. C., Zabludoff A. I., Keeton C. R., 2014, ApJ, 781, 2
- Bartelmann et al. (1998) Bartelmann M., Huss A., Colberg J. M., Jenkins A., Pearce F. R., 1998, A&A, 330, 1
- Bartelmann et al. (2003) Bartelmann M., Meneghetti M., Perrotta F., Baccigalupi C., Moscardini L., 2003, A&A, 409, 449
- Bayliss (2012) Bayliss M. B., 2012, ApJ, 744, 156
- Bayliss et al. (2011) Bayliss M. B., Hennawi J. F., Gladders M. D., Koester B. P., Sharon K., Dahle H., Oguri M., 2011, ApJS, 193, 8
- Bayliss et al. (2014) Bayliss M. B., Johnson T., Gladders M. D., Sharon K., Oguri M., 2014, ApJ, 783, 41
- Becker et al. (2007) Becker M. R., et al., 2007, ApJ, 669, 905
- Bertin & Arnouts (1996) Bertin E., Arnouts S., 1996, A&AS, 117, 393
- Boulade et al. (2003) Boulade O., et al., 2003, in Iye M., Moorwood A. F. M., eds, Proc. SPIEVol. 4841, Instrument Design and Performance for Optical/Infrared Ground-based Telescopes. pp 72–81, doi:10.1117/12.459890
- Bouwens et al. (2009) Bouwens R. J., et al., 2009, ApJ, 690, 1764
- Bradač et al. (2009) Bradač M., et al., 2009, ApJ, 706, 1201
- Brainerd et al. (1996) Brainerd T. G., Blandford R. D., Smail I., 1996, ApJ, 466, 623
- Broadhurst & Barkana (2008) Broadhurst T. J., Barkana R., 2008, MNRAS, 390, 1647
- Broadhurst et al. (2005a) Broadhurst T., Takada M., Umetsu K., Kong X., Arimoto N., Chiba M., Futamase T., 2005a, ApJ, 619, L143
- Broadhurst et al. (2005b) Broadhurst T., et al., 2005b, ApJ, 621, 53
- Broadhurst et al. (2005c) Broadhurst T., et al., 2005c, ApJ, 621, 53
- Cabanac et al. (2007) Cabanac R. A., et al., 2007, A&A, 461, 813
- Caminha et al. (2017a) Caminha G. B., et al., 2017a, A&A, 600, A90
- Caminha et al. (2017b) Caminha G. B., et al., 2017b, A&A, 607, A93
- Capak (2004) Capak P. L., 2004, PhD thesis, UNIVERSITY OF HAWAI’I
- Carrasco et al. (2017) Carrasco M., et al., 2017, ApJ, 834, 210
- Coe et al. (2012) Coe D., et al., 2012, arXiv, 1201.1616
- Coe et al. (2013) Coe D., et al., 2013, ApJ, 762, 32
- Coleman et al. (1980) Coleman G. D., Wu C.-C., Weedman D. W., 1980, ApJS, 43, 393
- Dai et al. (2010) Dai X., Bregman J. N., Kochanek C. S., Rasia E., 2010, ApJ, 719, 119
- Dalal et al. (2004) Dalal N., Holder G., Hennawi J. F., 2004, ApJ, 609, 50
- Erben et al. (2005) Erben T., et al., 2005, Astronomische Nachrichten, 326, 432
- Erben et al. (2009) Erben T., et al., 2009, A&A, 493, 1197
- Erben et al. (2013) Erben T., et al., 2013, MNRAS, 433, 2545
- Fassnacht et al. (2006) Fassnacht C. D., Gal R. R., Lubin L. M., McKean J. P., Squires G. K., Readhead A. C. S., 2006, ApJ, 642, 30
- Foëx et al. (2012) Foëx G., Soucail G., Pointecouteau E., Arnaud M., Limousin M., Pratt G. W., 2012, A&A, 546, A106
- Gavazzi et al. (2014) Gavazzi R., Marshall P. J., Treu T., Sonnenfeld A., 2014, ApJ, 785, 144
- Ge et al. (2016) Ge C., Wang Q. D., Tripp T. M., Li Z., Gu Q., Ji L., 2016, MNRAS, 459, 366
- Gilbank et al. (2011) Gilbank D. G., Gladders M. D., Yee H. K. C., Hsieh B. C., 2011, AJ, 141, 94
- Gladders & Yee (2000) Gladders M. D., Yee H. K. C., 2000, AJ, 120, 2148
- Gladders & Yee (2005) Gladders M. D., Yee H. K. C., 2005, VizieR Online Data Catalog, 215, 70001
- Gladders et al. (2003) Gladders M. D., Hoekstra H., Yee H. K. C., Hall P. B., Barrientos L. F., 2003, ApJ, 593, 48
- Hall et al. (2012) Hall N., et al., 2012, ApJ, 745, 155
- Hastings (1970) Hastings W. K., 1970, Biometrika, 57, 97
- Heymans et al. (2012) Heymans C., et al., 2012, MNRAS, 427, 146
- Hilbert et al. (2007) Hilbert S., White S. D. M., Hartlap J., Schneider P., 2007, MNRAS, 382, 121
- Hildebrandt et al. (2012) Hildebrandt H., et al., 2012, MNRAS, 421, 2355
- Ho et al. (2009) Ho S., Lin Y.-T., Spergel D., Hirata C. M., 2009, ApJ, 697, 1358
- Horesh et al. (2005) Horesh A., Ofek E. O., Maoz D., Bartelmann M., Meneghetti M., Rix H.-W., 2005, ApJ, 633, 768
- Jauzac et al. (2015) Jauzac M., et al., 2015, MNRAS, 452, 1437
- Johnston et al. (2007) Johnston D. E., Sheldon E. S., Tasitsiomi A., Frieman J. A., Wechsler R. H., McKay T. A., 2007, ApJ, 656, 27
- Joseph et al. (2014) Joseph R., et al., 2014, A&A, 566, A63
- Kneib et al. (2003) Kneib J.-P., et al., 2003, ApJ, 598, 804
- Laganá et al. (2013) Laganá T. F., Martinet N., Durret F., Lima Neto G. B., Maughan B., Zhang Y.-Y., 2013, A&A, 555, A66
- Lenzen et al. (2004) Lenzen F., Schindler S., Scherzer O., 2004, A&A, 416, 391
- Li et al. (2006a) Li C., Kauffmann G., Jing Y. P., White S. D. M., Börner G., Cheng F. Z., 2006a, MNRAS, 368, 21
- Li et al. (2006b) Li G. L., Mao S., Jing Y. P., Mo H. J., Gao L., Lin W. P., 2006b, MNRAS, 372, L73
- Limousin et al. (2007) Limousin M., et al., 2007, ApJ, 668, 643
- Limousin et al. (2009) Limousin M., et al., 2009, A&A, 502, 445
- Limousin et al. (2012) Limousin M., et al., 2012, A&A, 544, A71
- Marshall et al. (2016) Marshall P. J., et al., 2016, MNRAS, 455, 1171
- Maturi et al. (2014) Maturi M., Mizera S., Seidel G., 2014, A&A, 567, A111
- Mead et al. (2010) Mead J. M. G., King L. J., Sijacki D., Leonard A., Puchwein E., McCarthy I. G., 2010, MNRAS, 406, 434
- Meneghetti et al. (2003) Meneghetti M., Bartelmann M., Moscardini L., 2003, MNRAS, 346, 67
- Meneghetti et al. (2007) Meneghetti M., Argazzi R., Pace F., Moscardini L., Dolag K., Bartelmann M., Li G., Oguri M., 2007, A&A, 461, 25
- Meneghetti et al. (2011) Meneghetti M., Fedeli C., Zitrin A., Bartelmann M., Broadhurst T., Gottloeber S., Moscardini L., Yepes G., 2011, arXiv, 1103.0044
- Meneghetti et al. (2013) Meneghetti M., Bartelmann M., Dahle H., Limousin M., 2013, Space Sci. Rev., 177, 31
- Metropolis et al. (1953) Metropolis N., Rosenbluth A. W., Rosenbluth M. N., Teller A. H., Teller E., 1953, J. Chem. Phys., 21, 1087
- More et al. (2012) More A., Cabanac R., More S., Alard C., Limousin M., Kneib J.-P., Gavazzi R., Motta V., 2012, ApJ, 749, 38
- More et al. (2016) More A., et al., 2016, MNRAS, 455, 1191
- Oguri (2006) Oguri M., 2006, MNRAS, 367, 1241
- Oguri & Takada (2011) Oguri M., Takada M., 2011, Phys. Rev. D, 83, 023008
- Oguri et al. (2005) Oguri M., Takada M., Umetsu K., Broadhurst T., 2005, ApJ, 632, 841
- Oguri et al. (2006) Oguri M., et al., 2006, AJ, 132, 999
- Oguri et al. (2012) Oguri M., Bayliss M. B., Dahle H., Sharon K., Gladders M. D., Natarajan P., Hennawi J. F., Koester B. P., 2012, MNRAS, 420, 3213
- Puchwein & Hilbert (2009) Puchwein E., Hilbert S., 2009, MNRAS, 398, 1298
- Puchwein et al. (2005) Puchwein E., Bartelmann M., Dolag K., Meneghetti M., 2005, A&A, 442, 405
- Richard et al. (2008) Richard J., Stark D. P., Ellis R. S., George M. R., Egami E., Kneib J., Smith G. P., 2008, ApJ, 685, 705
- Richard et al. (2010) Richard J., et al., 2010, MNRAS, 404, 325
- Rozo et al. (2009) Rozo E., et al., 2009, ApJ, 699, 768
- Rozo et al. (2010) Rozo E., et al., 2010, ApJ, 708, 645
- Schechter (1976) Schechter P., 1976, ApJ, 203, 297
- Schirmer (2013) Schirmer M., 2013, ApJS, 209, 21
- Schirmer et al. (2003) Schirmer M., Erben T., Schneider P., Pietrzynski G., Gieren W., Carpano S., Micol A., Pierfederici F., 2003, A&A, 407, 869
- Schneider (2014) Schneider P., 2014, preprint, (arXiv:1409.0015)
- Seidel & Bartelmann (2007) Seidel G., Bartelmann M., 2007, A&A, 472, 341
- Semboloni et al. (2011) Semboloni E., Hoekstra H., Schaye J., van Daalen M. P., McCarthy I. G., 2011, MNRAS, 417, 2020
- Stapelberg et al. (2018) Stapelberg S., Carrasco M., Maturi M., 2018, preprint, (arXiv:1709.09758)
- Stark et al. (2007) Stark D. P., Ellis R. S., Richard J., Kneib J.-P., Smith G. P., Santos M. R., 2007, ApJ, 663, 10
- Thanjavur (2009) Thanjavur K. G., 2009, PhD thesis, University of Victoria, Canada
- Torri et al. (2004) Torri E., Meneghetti M., Bartelmann M., Moscardini L., Rasia E., Tormen G., 2004, MNRAS, 349, 476
- Umetsu & Broadhurst (2008) Umetsu K., Broadhurst T., 2008, ApJ, 684, 177
- Verdugo et al. (2011) Verdugo T., Motta V., Muñoz R. P., Limousin M., Cabanac R., Richard J., 2011, A&A, 527, A124
- Verdugo et al. (2016) Verdugo T., et al., 2016, A&A, 595, A30
- Wambsganss et al. (2004) Wambsganss J., Bode P., Ostriker J. P., 2004, ApJ, 606, L93
- Wambsganss et al. (2005) Wambsganss J., Bode P., Ostriker J. P., 2005, ApJ, 635, L1
- Wambsganss et al. (2008) Wambsganss J., Ostriker J. P., Bode P., 2008, ApJ, 676, 753
- White et al. (2011) White M., et al., 2011, ApJ, 728, 126
- Wong et al. (2012) Wong K. C., Ammons S. M., Keeton C. R., Zabludoff A. I., 2012, arXiv, 1203.2614
- Wong et al. (2013) Wong K. C., Zabludoff A. I., Ammons S. M., Keeton C. R., Hogg D. W., Gonzalez A. H., 2013, ApJ, 769, 52
- Zehavi et al. (2005) Zehavi I., et al., 2005, ApJ, 621, 22
- Zheng et al. (2012) Zheng W., et al., 2012, Nature, 489, 406
- Zitrin et al. (2009) Zitrin A., et al., 2009, MNRAS, 396, 1985
- Zitrin et al. (2011) Zitrin A., Broadhurst T., Barkana R., Rephaeli Y., Benítez N., 2011, MNRAS, 410, 1939
- Zitrin et al. (2012a) Zitrin A., Broadhurst T., Bartelmann M., Rephaeli Y., Oguri M., Benítez N., Hao J., Umetsu K., 2012a, MNRAS, 423, 2308
- Zitrin et al. (2012b) Zitrin A., et al., 2012b, ApJ, 747, L9
- Zitrin et al. (2013) Zitrin A., et al., 2013, ApJ, 762, L30
Appendix A Reference samples
| Namea | R.A. | Dec. | Rankc | Referenced | ||
|---|---|---|---|---|---|---|
| [J2000] | [J2000] | [′′] | ||||
| SA2 | 02:02:10.50 | -11:09:11.7 | 0.48 | 5.0 | KL | Mo12 |
| SA6 | 02:03:20.43 | -07:34:50.8 | 0.59 | 5.0 | KL | Mo12 |
| SA7 | 02:03:49.98 | -09:42:53.5 | 0.25 | 5.0 | KL | Mo12 |
| SA9 | 02:05:03.15 | -11:05:46.6 | 0.62 | 3.3 | KL | Mo12 |
| SA10 | 02:06:48.47 | -06:57:01.3 | 0.49 | 3.2 | KL | Mo12 |
| SA12 | 02:08:16.87 | -09:36:52.7 | 0.74 | 3.4 | KL | Mo12 |
| SA14 | 02:09:29.33 | -06:43:11.3 | 0.45 | 3.2 | KL | Mo12 |
| SA22 | 02:14:08.07 | -05:35:32.4 | 0.44 | 7.1 | KL | Mo12 |
| arc68c | 02:15:29.40 | -04:40:54.0 | 0.31 | 8.0 | KL | Ma14 |
| SA30 | 02:16:49.25 | -07:03:23.8 | 0.43 | 5.6 | KL | Mo12 |
| SA33 | 02:18:07.29 | -05:15:36.2 | 0.64 | 3.1 | KL | Mo12 |
| SA36 | 02:19:56.42 | -05:27:59.2 | 0.35 | 4.0 | KL | Mo12 |
| SA39 | 02:21:51.18 | -06:47:32.7 | 0.61 | 5.2 | KL | Mo12 |
| SW1 | 02:24:09.55 | -10:58:07.9 | 0.50 | 4.8 | KL | Mo16 |
| SW21 | 02:25:33.32 | -05:32:04.6 | 0.50 | 3.6 | KL | Mo16 |
| SA50 | 02:25:46.13 | -07:37:38.5 | 0.51 | 5.8 | KL | Mo12 |
| LSSC017 | 02:26:28.18 | -04:59:48.1 | 0.38 | 5.0 | KL | Th09 |
| SW22 | 02:27:16.45 | -10:56:02.8 | 0.40 | 4.8 | KL | Mo16 |
| XLSSC022 | 02:27:40.27 | -04:51:31.0 | 0.29 | 5.0 | KL | Th09 |
| SA55 | 02:29:17.36 | -05:54:05.5 | 0.38 | 3.2 | KL | Mo16 |
| SA63 | 08:52:07.18 | -03:43:16.3 | 0.48 | 5.0 | KL | Mo12 |
| SA66 | 08:54:46.55 | -01:21:37.1 | 0.35 | 4.8 | KL | Mo12 |
| SA71 | 08:58:48.83 | -02:39:25.8 | 0.36 | 3.7 | KL | Mo12 |
| SA72 | 08:59:14.55 | -03:45:14.9 | 0.64 | 4.5 | KL | Mo12 |
| SL2SJ0901-0158 | 09:01:39.46 | -01:58:52.2 | 0.29 | 6.8 | KL | Ca07 |
| SA87 | 13:57:25.48 | +53:17:44.0 | 0.54 | 3.5 | KL | Mo12 |
| SA90 | 14:01:10.46 | +56:54:20.5 | 0.53 | 3.7 | KL | Mo12 |
| SA96 | 14:05:54.33 | +54:45:48.7 | 0.41 | 3.9 | KL | Mo12 |
| SA97 | 14:08:13.82 | +54:29:08.1 | 0.42 | 8.0 | KL | Mo12 |
| SA100 | 14:14:47.19 | +54:47:03.6 | 0.63 | 14.7 | KL | Mo12 |
| SA102 | 14:19:12.17 | +53:26:11.4 | 0.69 | 9.9 | KL | Mo12 |
| SA103 | 14:19:17.25 | +51:17:28.6 | 0.47 | 4.1 | KL | Mo12 |
| SW3 | 14:26:03.30 | +51:14:21.7 | 0.50 | 4.4 | KL | Mo16 |
| SW4 | 14:29:34.23 | +56:25:41.1 | 0.50 | 5.9 | KL | Mo16 |
| SA112 | 14:30:00.65 | +55:46:48.0 | 0.50 | 4.3 | KL | Mo12 |
| SA113 | 14:31:39.77 | +55:33:22.8 | 0.67 | 4.0 | KL | Mo12 |
| SW5 | 14:34:54.48 | +52:28:50.9 | 0.60 | 4.4 | KL | Mo16 |
| SW7 | 22:02:56.86 | +02:34:32.9 | 0.50 | 6.8 | KL | Mo16 |
| SA121 | 22:06:42.03 | +04:11:30.8 | 0.62 | 3.7 | KL | Mo12 |
| arc20a | 22:13:06.90 | -00:18:30.0 | 0.49 | 5.0 | KL | Ma14 |
| SA122 | 22:13:06.93 | -00:30:37.1 | 0.69 | 3.1 | KL | Mo12 |
| SA123 | 22:13:31.85 | +00:48:36.1 | 1.00 | 4.8 | KL | Mo12 |
| SA125 | 22:14:18.82 | +01:10:33.8 | 0.74 | 8.0 | KL | Mo12 |
| arc54c | 22:20:51.50 | +00:58:14.0 | 0.41 | 8.0 | KL | Ma14 |
| SA8 | 02:04:54.51 | -10:24:02.5 | 0.33 | 10.8 | KC | Mo12 |
| SA11 | 02:08:15.66 | -07:24:57.8 | 0.62 | 4.3 | KC | Mo12 |
| SA13 | 02:08:41.61 | -07:01:28.1 | 0.29 | 3.5 | KC | Mo12 |
| SA15 | 02:09:57.67 | -03:54:57.1 | 0.44 | 3.9 | KC | Mo12 |
| SA19 | 02:11:18.49 | -04:27:29.2 | 1.19 | 3.5 | KC | Mo12 |
| arc1a | 02:13:17.20 | -06:25:58.0 | 0.39 | 4.0 | KC | Ma14 |
| arc67c | 02:13:28.40 | -05:11:45.0 | 0.49 | 8.5 | KC | Ma14 |
| arc26b | 02:14:26.40 | -05:39:39.0 | 0.55 | 5.0 | KC | Ma14 |
| SA24 | 02:15:23.03 | -07:36:23.6 | 1.05 | 3.7 | KC | Mo12 |
| SA26 | 02:16:04.66 | -09:35:06.6 | 0.69 | 16.4 | KC | Mo12 |
| SA31 | 02:17:23.76 | -10:15:50.3 | 0.27 | 3.2 | KC | Mo12 |
| SA35 | 02:19:09.86 | -04:01:43.3 | 0.45 | 4.3 | KC | Mo12 |
| SA41 | 02:23:18.33 | -10:58:48.5 | 0.52 | 6.1 | KC | Mo12 |
| SW32 | 02:23:59.89 | -08:36:51.8 | 0.50 | 3.1 | KC | Mo16 |
| SA43 | 02:24:05.01 | -04:47:07.0 | 0.36 | 4.3 | KC | Mo12 |
| SA45 | 02:24:35.26 | -04:01:57.9 | 1.13 | 3.5 | KC | Mo12 |
| SA46 | 02:24:39.06 | -04:00:45.2 | 0.43 | 3.2 | KC | Mo12 |
| SA49 | 02:25:38.74 | -04:03:20.4 | 0.62 | 4.3 | KC | Mo12 |
| SA51 | 02:26:07.15 | -04:27:26.3 | 0.17 | 3.7 | KC | Mo12 |
| SA53 | 02:27:59.21 | -09:07:29.9 | 0.55 | 3.9 | KC | Mo12 |
| SA54 | 02:28:32.05 | -09:49:45.4 | 0.45 | 6.3 | KC | Mo12 |
| SL2SJ0230-0550 | 02:30:11.60 | -05:50:21.0 | 0.49 | 7.0 | KC | Li09 |
| SA57 | 02:31:06.46 | -05:55:04.6 | 0.52 | 3.7 | KC | Mo12 |
| SA60 | 02:35:01.61 | -09:58:32.8 | 0.70 | 4.7 | KC | Mo12 |
| SA61 | 08:48:23.66 | -04:07:15.3 | 0.51 | 7.4 | KC | Mo12 |
| SA62 | 08:50:07.72 | -01:23:53.3 | 0.37 | 3.5 | KC | Mo12 |
| SA70 | 08:57:49.10 | -01:13:00.7 | 0.29 | 3.9 | KC | Mo12 |
| SA73 | 08:59:54.54 | -01:32:13.4 | 0.66 | 4.3 | KC | Mo12 |
| SA74 | 09:00:50.10 | -02:30:54.1 | 0.36 | 3.2 | KC | Mo12 |
| SA86 | 13:56:49.33 | +55:27:07.0 | 0.46 | 3.7 | KC | Mo12 |
| SA89 | 14:00:40.17 | +56:07:49.4 | 0.42 | 3.7 | KC | Mo12 |
| arc81c | 14:02:06.40 | +52:57:07.0 | 0.51 | 5.0 | KC | Mo12 |
| SA93 | 14:02:47.90 | +57:08:52.0 | 1.22 | 3.2 | KC | Mo12 |
| SA98 | 14:11:20.53 | +52:12:09.9 | 0.52 | 18.4 | KC | Mo12 |
| SL2SJ1415+5239 | 14:15:58.18 | +52:39:55.9 | 0.75 | 4.6 | KC | Li09 |
| SA101 | 14:16:44.52 | +56:42:16.2 | 1.29 | 3.5 | KC | Mo12 |
| SA104 | 14:21:02.56 | +52:29:42.5 | 0.18 | 11.7 | KC | Mo12 |
| SL2SJ1422+5246 | 14:22:09.27 | +52:46:52.4 | 0.18 | 3.5 | KC | Li09 |
| SA108 | 14:25:44.27 | +57:07:24.5 | 0.86 | 4.5 | KC | Mo12 |
| SA109 | 14:26:08.04 | +57:45:23.9 | 0.39 | 3.2 | KC | Mo12 |
| SA110 | 14:28:10.54 | +56:39:48.4 | 0.80 | 4.1 | KC | Mo12 |
| SA111 | 14:28:34.82 | +52:13:06.4 | 0.52 | 5.0 | KC | Mo12 |
| SL2SJ1431+5131 | 14:31:41.83 | +51:31:43.7 | 0.85 | 3.9 | KC | Li09 |
| SA114 | 14:31:52.67 | +57:28:36.7 | 0.83 | 3.5 | KC | Mo12 |
| SA116 | 14:34:34.69 | +56:59:20.2 | 0.57 | 4.1 | KC | Mo12 |
| SW58 | 14:36:51.61 | +53:07:06.0 | 0.60 | 3.1 | KC | Mo16 |
| SA117 | 22:01:51.79 | +04:10:08.4 | 0.43 | 7.3 | KC | Mo12 |
| SA118 | 22:02:01.66 | +01:47:09.6 | 0.30 | 5.0 | KC | Mo12 |
| SW39 | 22:02:15.23 | +01:21:24.0 | 0.30 | 4.6 | KC | Mo16 |
| arc84c | 22:09:35.50 | +00:31:26.0 | 0.32 | 3.3 | KC | Ma14 |
| arc53c | 22:10:33.10 | +00:23:51.0 | 0.58 | 4.0 | KC | Ma14 |
| arc23a | 22:15:13.40 | +01:02:41.0 | 0.69 | 7.0 | KC | Ma14 |
| SA127 | 22:21:43.74 | -00:53:02.9 | 0.33 | 4.7 | KC | Mo12 |
| arc55c | 22:21:58.50 | +00:59:02.0 | 0.33 | 3.5 | KC | Mo14 |
a IDs given to the previously known lenses in their corresponding references.
b Corresponds to the distance from the BCG of the lens system till the average location of the arc.
c Ranking from previous studies. KL stands for known lenses, while KC stands for known candidates.
d Ca07 stands for Cabanac et al. (2007); Li09 stands for Limousin et al. (2009); Th09 stands for Thanjavur (2009); Mo12 stands for More et al. (2012); Ma14 stands for Maturi et al. (2014); and Mo16 stands for More et al. (2016).
Appendix B New SL candidates
In this appendix we present the 9 of the new systems found in our visual inspection analysis, after processing the survey with EasyCritics. These systems are classified with a final , given the scale defined in More et al. (2016).
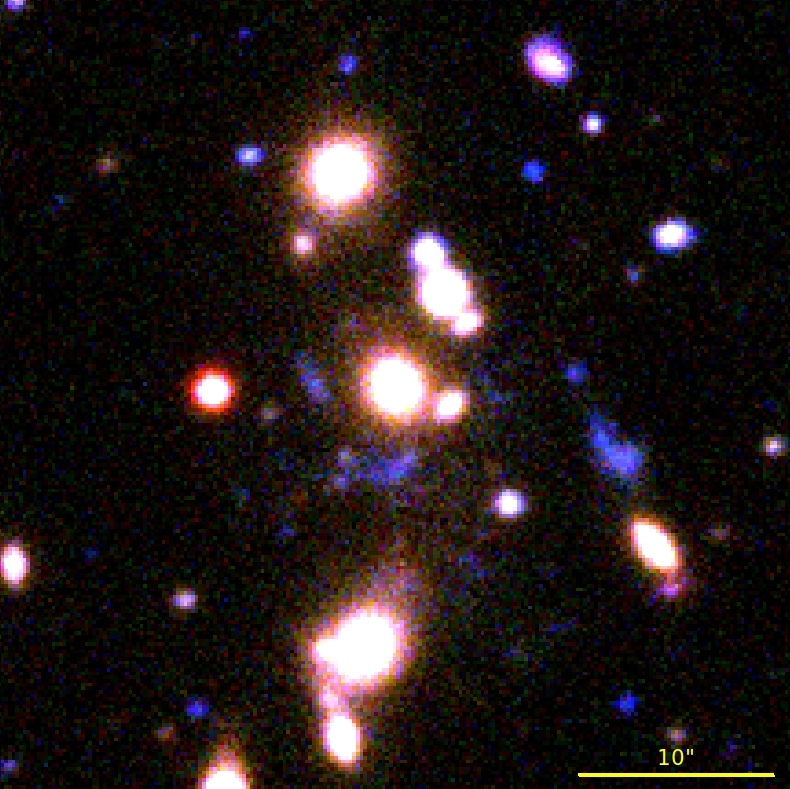 |
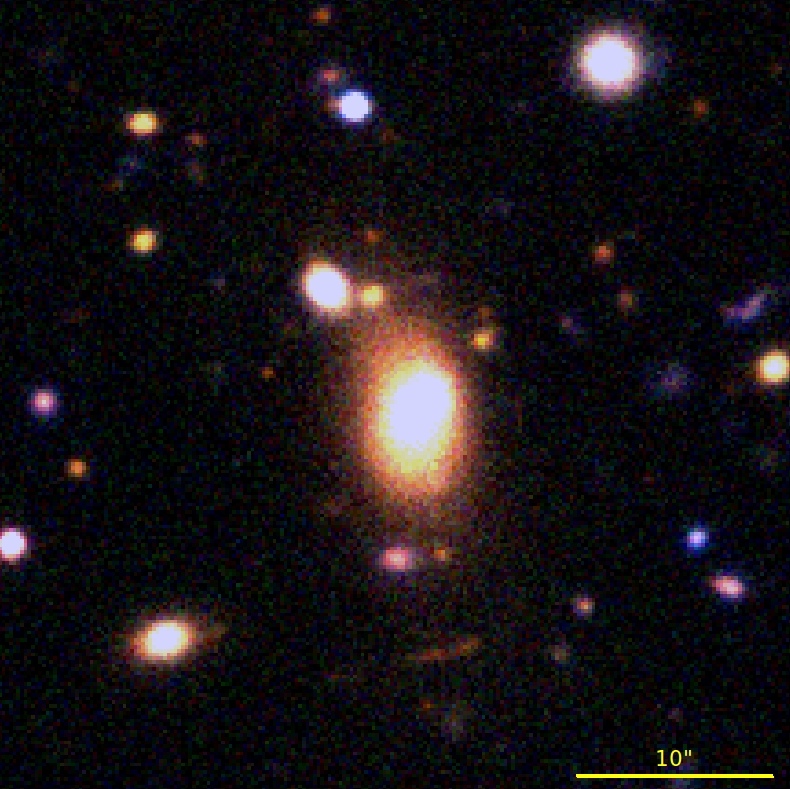 |
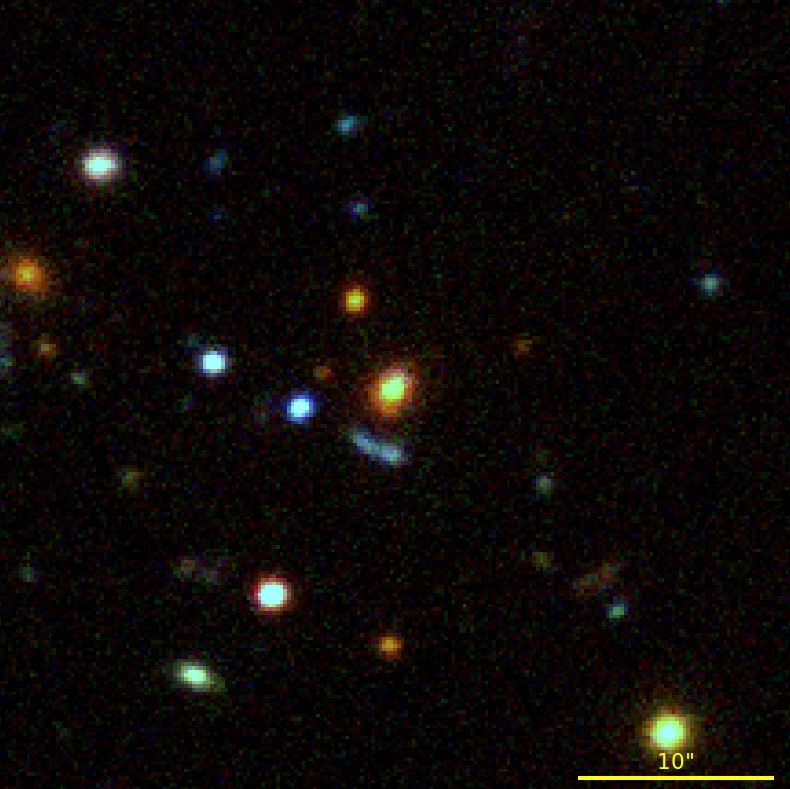 |
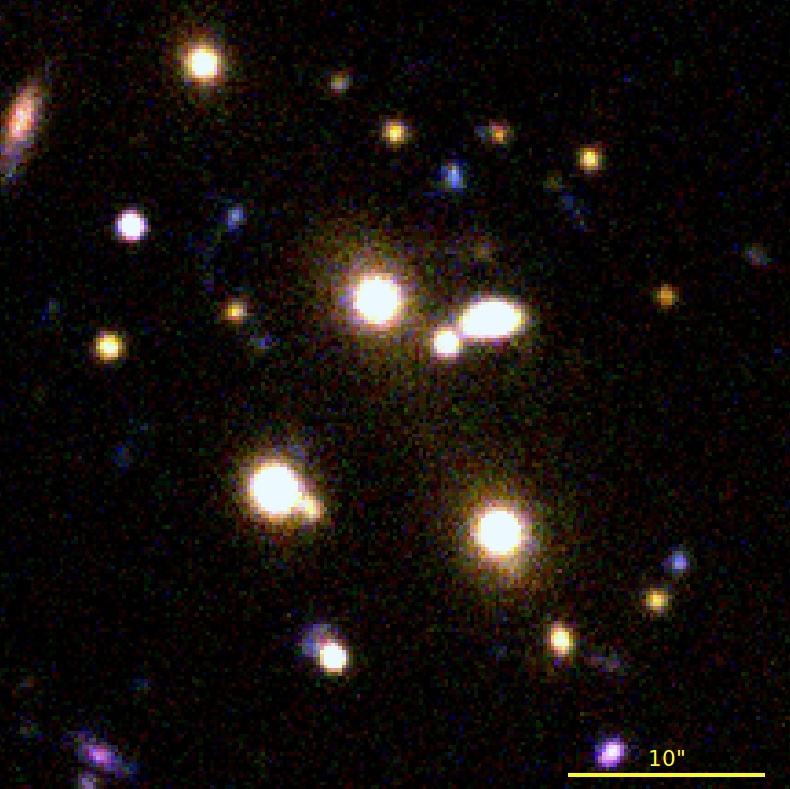 |
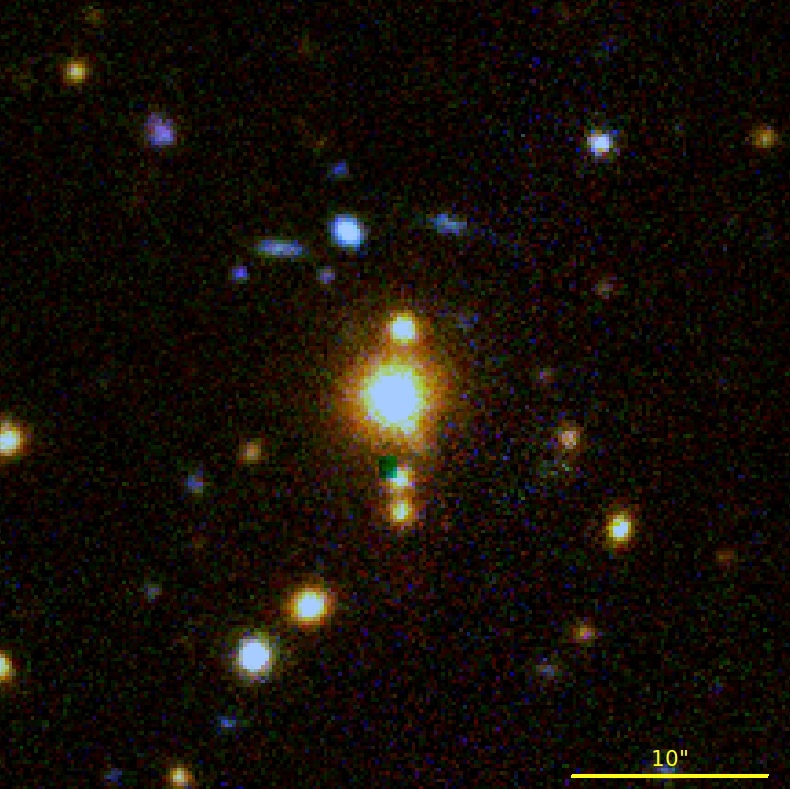 |
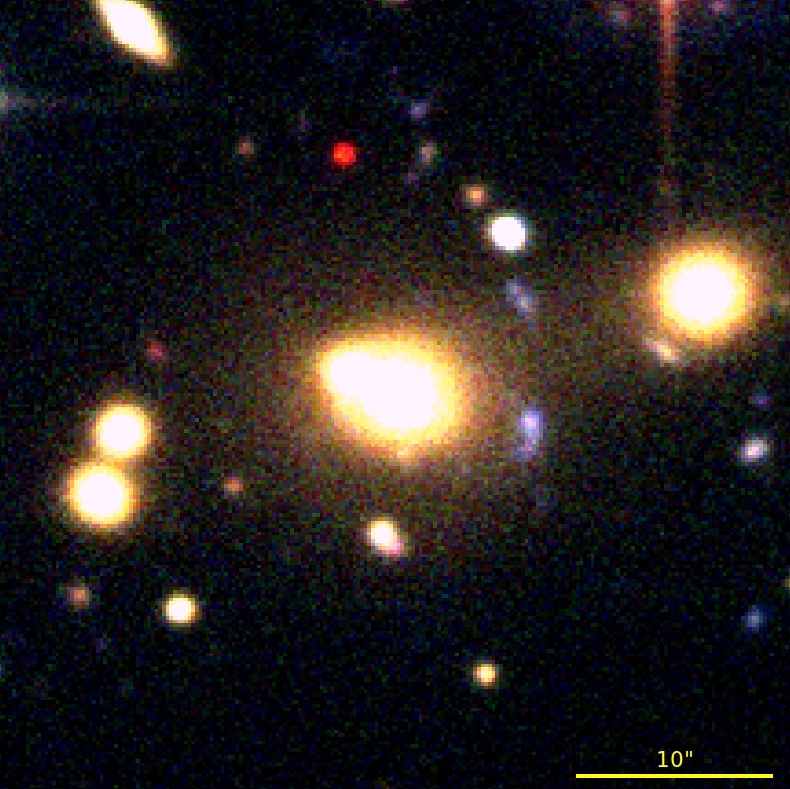 |
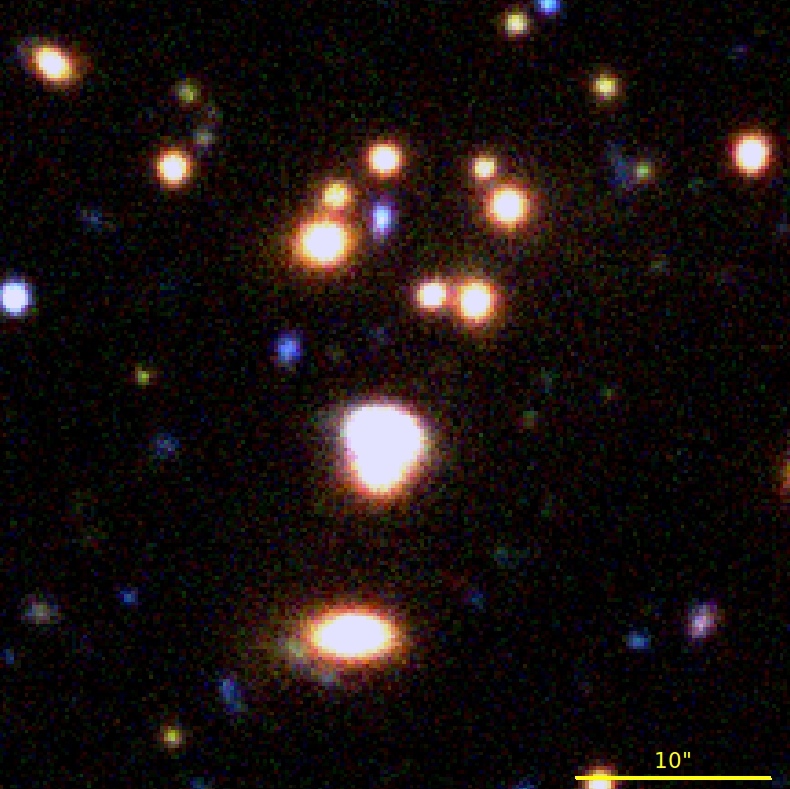 |
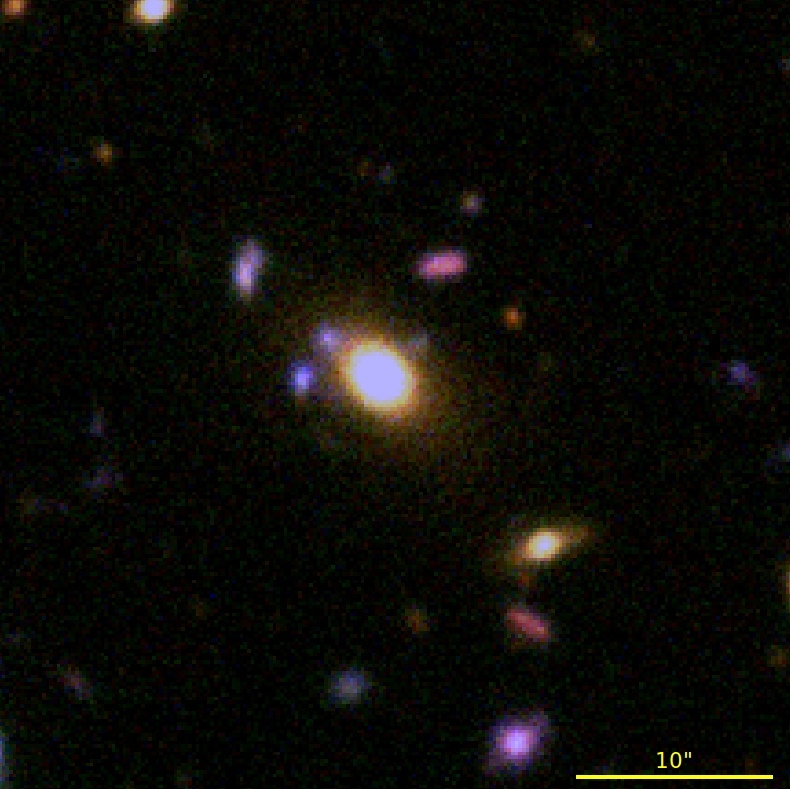 |
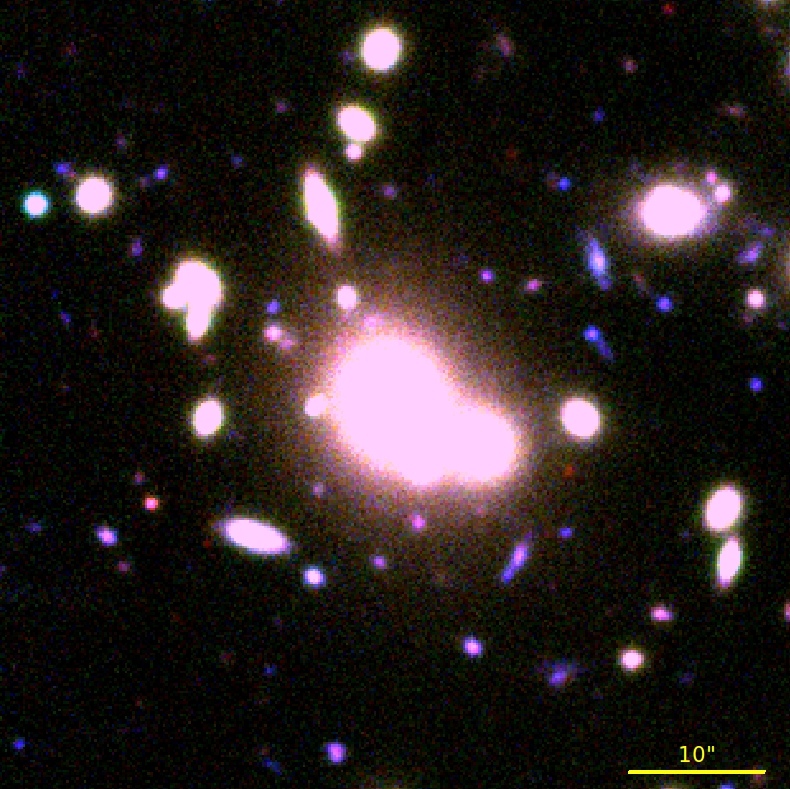 |