Magnetic anisotropy in HoIr2Si2 ()
Abstract
Single crystals of HoIr2Si2 with the body-centered ThCr2Si2-type structure () were grown by Bridgman method from indium flux. Single crystal structure determination yielded a Si-z position of 0.378(1) in the structure. We excluded the presence of the high temperature phase with the primitive CaBe2Ge2-type structure () by powder X-ray diffraction. Magnetic measurements on the single crystals yield a Néel temperature of . In the inverse magnetic susceptibility a strong anisotropy with Weiss temperatures and occurs above . The effective magnetic moment and is close to the expected value for a free Ho3+ ion, . The field dependent magnetization shows a step-like behaviour due to crystalline electric field effects.
pacs:
75.20.Hr, 75.30.Gw, 75.47.Np, 75.50.Ee1 Introduction
Polymorphism in LnIr2Si2 (Ln = lanthanide) is well documented for a large number of compounds, among them for instance CeIr2Si2, YbIr2Si2, LaIr2Si2, GdIr2Si2 and HoIr2Si2 [1, 2, 3]. In the case of HoIr2Si2, besides the existence of polymorphism in the body-centered ThCr2Si2-type structure () which is the low temperature phase (LTP) and the primitive CaBe2Ge2-type structure () which is the high temperature phase (HTP) [4], no characterization of its physical properties was reported in the past. We therefore characterized the magnetic ground state of the LTP of this material. In contrast to LnIr2Si2 compounds with the Ln ions Pr [5], Nd [6], Tb [7], Dy [8] or Er [9] (Tab. 1), the study of Ho compounds by neutron scattering experiments is hindered due to its high absorption-cross section for neutrons. We therefore obtained information on the magnetic properties through bulk magnetization measurements. No successful single crystal growth of HoIr2Si2 had been reported in the literature so far. We have grown HoIr2Si2 single crystals from indium flux and present their characterization in this manuscript. The relative position of the Si atoms was found to have a strong impact on the band structure and the Fermi surface topology in the ThCr2Si2-type structure [10]. We determined the single crystal structure and the Si-z position in HoIr2Si2 to give reliable input for band structure calculations.
2 Experiment
2.1 Crystal growth
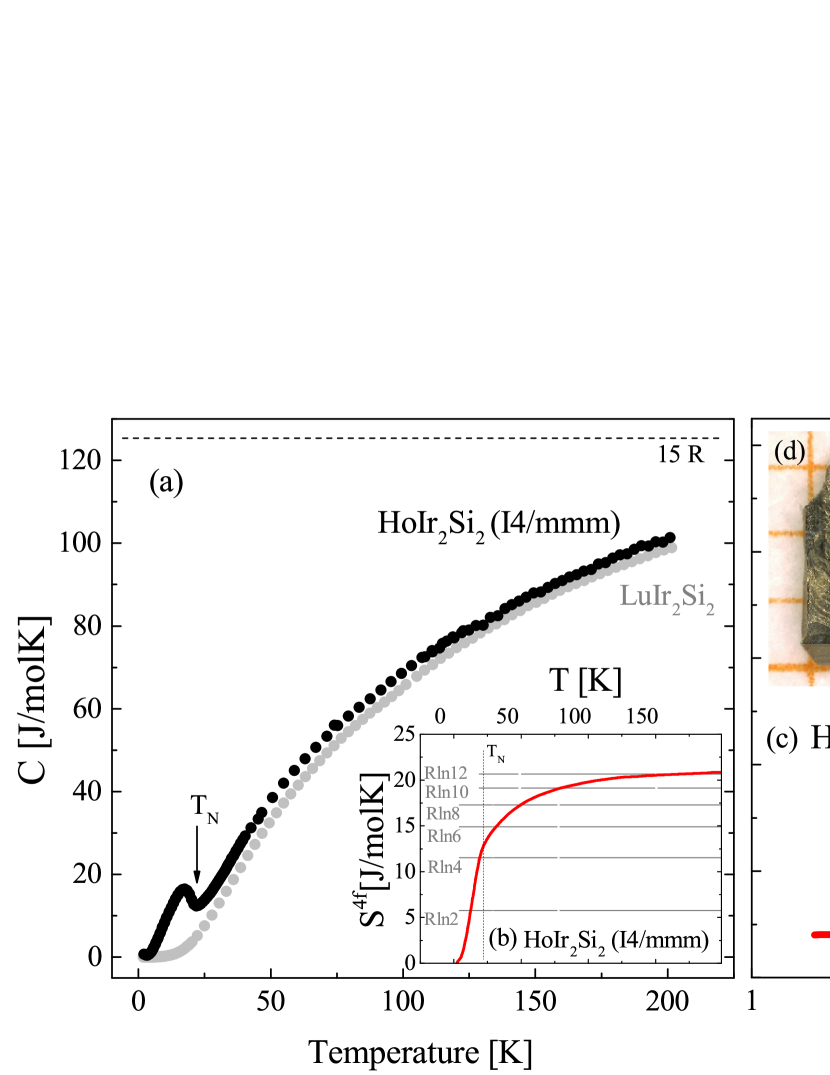
Single crystals of HoIr2Si2 were grown in indium flux following the route described earlier for the related compounds YbRh2Si2 [11] and GdRh2Si2 [12]. The high purity starting materials Ho (99.9%, Strem Chemicals), Ir (99.96%, Heraeus), Si (99.9999%, Wacker) and In (99.9995%, Schuckard) were weighed in a graphite crucible and sealed in a niobium crucible under argon atmosphere (99.999%). The initial weight of Ho, Ir and Si was chosen to be stoichiometric and an elements-flux ratio of (Ho,Ir,Si) : In = (4 : 96) at% was used. All experiments have been performed in a movable high-temperature Bridgman furnace (GERO HTRV 70-250/18) where the temperature was measured at the bottom of the niobium crucible using a thermocouple type B. The furnace was heated up to the maximum temperature of C with a rate of . After a homogenization period of the furnace was moved upwards applying a fast-move period () in the first and a slow-move period () in the second step. The first step was done to lower the temperature quickly to after the homogenization of the melt. This avoids the long exposure at a high temperature which might lead to an enhanced pollution of the melt by the crucible material graphite. During the slow-move period, the crystal growth took place. This step was terminated at . Afterwards, the furnace was slowly cooled down with to room temperature. The slow cooling rate was chosen to include an annealing period and to obtain crystals in the low-temperature ThCr2Si2-type crystal structure . Subsequently, the indium flux was removed from the single crystals by etching using 32 hydrochloric acid. This growth procedure yielded single crystal platelets of 23 mm2 and a thickness of up to with masses up to . Fig. 3 (d), shows a typical single crystal.
2.2 Characterization
Powder X-ray diffraction (PXRD) data were collected with a Bruker D8 diffractometer with CuKα radiation ( Å) at room temperature. PXRD on crushed single crystals of HoIr2Si2 confirmed the tetragonal structure and yielded lattice constants which are summarized in Tab. 2. For the single crystal structure determination the data were collected at on a STOE IPDS II two-circle diffractometer with a Genix Microfocus tube with mirror optics using MoKα radiation ( Å) and were scaled using the frame scaling procedure in the X-AREA program system [13]. The structure was solved by direct methods using the program SHELXS [14] and refined against with full-matrix least-squares techniques using the program SHELXL [14]. The atomic coordinates determined by single crystal analysis are summarized in Tab. 3. Energy dispersive X-ray spectroscopy (EDX) measurements have been performed with an AMETEK EDAX Quanta400 Detector in a Zeiss scanning electron microscope (SEM) DSM 940A. The chemical analysis by EDX microprobe analysis confirmed the presence of Ho, Ir and Si in the single crystals. A quantitative analysis was not possible due to the overlap of the Si-K line and the M lines of Ho and Ir. The orientation of the single crystals was determined using a Laue device with tungsten anode. The analysis of 15 samples yielded that the dimension perpendicular to the surface is the direction of the tetragonal lattice. The largest naturally grown edges point towards the direction in HoIr2Si2 as shown in Fig. 3 (d). Four-point resistivity, heat capacity and magnetization measurements were performed between and using a Quantum Design Physical Property Measurement System (PPMS).
| a | c | sample | ref. |
| Å | Å | ||
| 4.042 | 9.707 | PC | [4] |
| 4.0371 | 9.8769 | PC | this work |
| 4.0476(6) | 9.884(2) | SC | this work |
| atom | Wyckoff position | x | y | z | U(eq) Å |
|---|---|---|---|---|---|
| Ho | 2a | 0 | 0 | 0 | 0.0283(10) |
| Ir | 4d | 0 | 0.5 | 0.25 | 0.0276(10) |
| Si | 4e | 0 | 0 | 0.378(1) | 0.029(2) |
3 Results and discussion
3.1 Temperature and field dependence of the magnetization
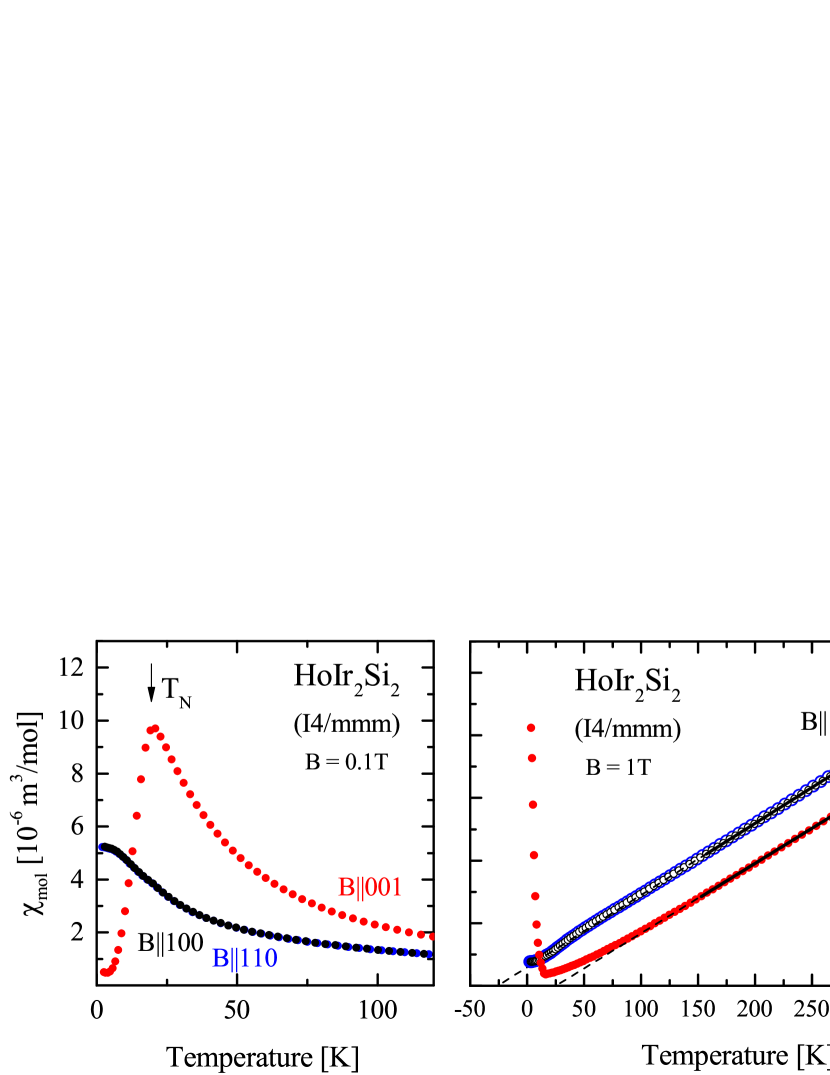
Temperature dependent magnetic measurements on the single crystals, Fig. 1, left panel, show the ordering of the Ho3+ moments at . Upon increasing the temperature up to the Néel temperature, the moments fluctuate between the up and the down state which leads to an increase of the susceptibility. We determined the effective magnetic moments and Weiss temperatures from a linear fit between and to the inverse magnetic susceptibility as demonstrated in Fig. 1, right panel. The effective magnetic moments , and agree well with the predicted value of for the free Ho3+. The Weiss temperatures for field in the plane and are isotropic. With a strong anisotropy occurs for field parallel and perpendicular to the -direction. While hints to the presence of ferromagnetic fluctuations for field along the direction, antiferromagnetic fluctuations are present for field perpendicular to this direction.
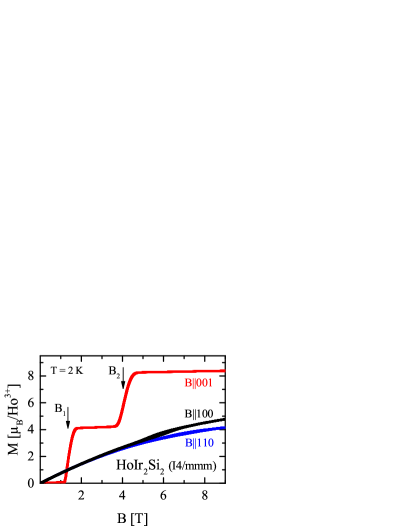
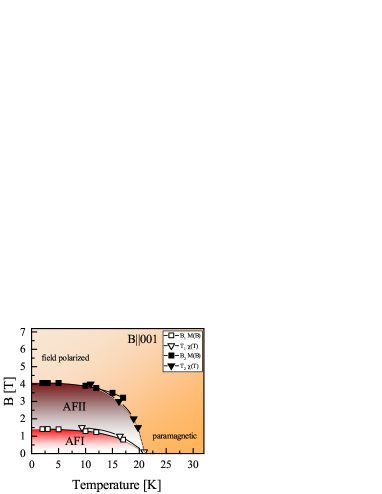
The field dependent magnetization within the ordered phase, Fig. 2, left panel, shows a strong anisotropy for and . While for both in-plane directions, the magnetization increases nearly linearly, the susceptibility is nearly zero for in low fields. At , a metamagnetic transition occurs at and a second one at for . This step-like behaviour is caused by the CEF anisotropy. For , the magnetization reaches which is slightly smaller than the saturation magnetization . For a step-like magnetization occurs while for and no indications for field-induced phases were found. The magnetic phase diagram for shown in Fig. 2, right panel, was constructed from the field and temperature dependence of the magnetization. We found two field induced phases AFI at low fields and AFII at high fields. The magnetization and susceptibility data, Figs. 1 and 2, strongly suggest that the magnetic moments order along the direction.
3.2 Heat capacity and entropy
The heat capacity of HoIr2Si2, shown in Fig. 3 (a), exhibits a pronounced anomaly at , establishing a second order phase transition into the AFM ordered phase. The magnetic part of the heat capacity was determined by subtraction of the data of the non-magnetic reference compound from the HoIr2Si2 data according to (HoIr2Si2)(LuIr2Si2). The magnetic part of the entropy, , shown in Fig. 3 (b), was determined by integration of . It reaches at which is much smaller than the expected for the Ho3+ ion indicating that the overall splitting of the crystal electric field (CEF) levels is much larger than . The increase from to above the Néel temperature to about can be attributed to the population of excited CEF levels. The entropy saturates at about which is far below . This discrepancy is probably caused by the large uncertainty in the measured heat capacity data for .
3.3 Electrical transport
Electrical transport data, Fig. 3 (c), show the magnetic transition at and a slight anisotropy for current flow parallel and perpendicular to the -direction. With for and for the residual resistivity ratio is also anisotropic. Upon cooling below the Néel temperature, a drop of the resistivity is observed for both current directions.
4 Summary
In this work, single crystals of HoIr2Si2 have been grown by a modified Bridgman method from indium flux. After an optimization of the temperature-time profile of the growth experiment, we obtained millimetre-sized single crystals. They have a platelet habitus, with the -axis perpendicular to this platelet and formed in the tetragonal structure, which is the low-temperature phase. Powder X-ray diffraction (PXRD) on crushed single crystals confirmed this tetragonal structure with lattice parameters which are in agreement with the data published for polycrystalline samples. The PXRD pattern did not show any additional reflections belonging to the structure. We additionally performed a single crystal structure analysis and determined the Si position to in HoIr2Si2 to give reliable input for the band structure calculations. We present a detailed study of the bulk properties, namely heat capacity, magnetization and electrical transport of HoIr2Si2 single crystals. Our heat capacity measurements confirm the occurence of a second order phase transition at the Néel temperature . The temperature and field dependence of the magnetization hints to the ordering of the magnetic moments along the direction. In the inverse magnetic susceptibility a strong anisotropy with Weiss temperatures and occurs for field parallel and perpendicular to the direction. The effective magnetic moment and is close to the expected value for a free Ho3+ ion (). The residual resistivity ratio for and for is anisotropic. Furthermore, it is important to determine the magnetic ground state of this material, as it has been shown, that the LnT2Si2 compounds bear intriguing surface states, which are strongly influenced by the magnetic properties of the 4 electrons [16, 17]. An angle resolved photoemission (ARPES) study on HoRh2Si2 revealed that the temperature can be used as a tuning parameter for the surface magnetism since the temperature dependent changes in the moment orientation in the bulk reflect in the surface properties [17]. The comparison of the magnetic interactions occuring in the Rh and the Ir compounds will be a task for future work. Further studies of HoIr2Si2 to investigate its magnetic structure using resonant inelastic X-ray scattering (RIXS) [18] or electron spin resonance (ESR) [19, 20] are in progress.
5 Acknowledgments
We acknowledge discussions with C.Geibel, D.V.Vyalikh and J.Sichelschmidt, as well as funding by the DFG through grant KR3831/5-1.
References
References
- [1] Niepmann D and Pöttgen R 2001 Intermetallics 9 313
- [2] Villars P and Calvert L D 1991 Pearson‘s handbook of crystallographic data for intermetallic compounds vol 2nd ed. (Material Park (OH): American Society for Metals)
- [3] Parthé E and Chabot B 1984 Handbook on the chemistry and physics of rare earths (Amsterdam: Elsevier Science Publishers)
- [4] Zhong W X, Lloret B, Ng W L, Chevalier B, Etourneau J and Hagenmuller P 1985 Rev.Chim.Miner. 22 711
- [5] Mihalik M, Divis M and Sechovský V 2010 Phys.Rev.B 81 174431
- [6] Welter R, Halich K and Malaman B 2003 J.Alloy.Compd. 353 48
- [7] Slaski M, Leciejewicz J and Szytuła A 1983 J.Magn.Magn.Mater. 39 268
- [8] Melamud M, Pinto H, Felner I and Shaked H 1984 J.Appl.Phys. 55 2034
- [9] Sanchez J P, Blaise A, Ressouche E, Malaman B, Venturini G, Tomala K and Kmieć R 1993 J.Magn.Magn.Mater. 128 295
- [10] Reiss P, Rourke P M C, Zwicknagl G, Grosche F M and Friedemann S 2013 Phys. Status Solidi B 250 498
- [11] Krellner C, Taube S, Westerkamp T, Hossain Z and Geibel C 2012 Philos.Mag. 92 2508
- [12] Kliemt K and Krellner C 2015 J. Cryst. Growth 419 37
- [13] Stoe and GmbH C 2002 X-AREA, Diffractometer control program system
- [14] Sheldrick G M 2008 Acta Crystallogr.Sect. A 64 112
- [15] Krellner C 2009 Ferromagnetische Korrelationen in Kondo-Gittern: YbT2Si2 und CeTPO (T = Übergangsmetall) (PhD thesis, TU Dresden)
- [16] Güttler M, Generalov A, Otrokov M M, Kummer K, Kliemt K, Fedorov A, Chikina A, Danzenbächer S, Schulz S, Chulkov E V, Koroteev Y M, Caroca-Canales N, Shi M, Radovic M, Geibel C, Laubschat C, Dudin P, Kim T K, Hoesch M, Krellner C and Vyalikh D V 2016 Sci.Rep. 6 24254
- [17] Generalov A, Otrokov M M, Chikina A, Kliemt K, Kummer K, Höppner M, Güttler M, Seiro S, Fedorov A, Schulz S, Danzenbächer S, Chulkov E V, Geibel C, Laubschat C, Dudin P, Hoesch M, Kim T, Radovic M, Shi M, Plumb N C, Krellner C and Vyalikh D V 2017 Nano Letters 17 811
- [18] Kliemt K, Hofmann-Kliemt M, Kummer K, Yakhou-Harris F, Krellner C and Geibel C 2017 Phys.Rev.B 95 134403
- [19] Sichelschmidt J, Kliemt K, Krellner C and Geibel C 2017 J.Phys.Conf.Ser. 807 012007
- [20] Sichelschmidt J, Kliemt K, Hofmann-Kliemt M and Krellner C 2018 Phys.Rev.B 97 214424