Energetics of the coupled electronic-structural transition in the rare-earth nickelates
Abstract
Rare-earth nickelates exhibit a metal-insulator transition accompanied by a structural distortion that breaks the symmetry between formerly equivalent Ni sites. The quantitative theoretical description of this coupled electronic-structural instability is extremely challenging. Here, we address this issue by simultaneously taking into account both structural and electronic degrees of freedom using a charge self-consistent combination of density functional theory and dynamical mean-field theory, together with screened interaction parameters obtained from the constrained random phase approximation. Our total energy calculations show that the coupling to an electronic instability towards a charge disproportionated insulating state is crucial to stabilize the structural distortion, leading to a clear first order character of the coupled transition. The decreasing octahedral rotations across the series suppress this electronic instability and simultaneously increase the screening of the effective Coulomb interaction, thus weakening the correlation effects responsible for the metal-insulator transition. Our approach allows to obtain accurate values for the structural distortion and thus facilitates a comprehensive understanding, both qualitatively and quantitatively, of the complex interplay between structural properties and electronic correlation effects across the nickelate series.
Complex transition metal oxides exhibit a variety of phenomena, such as, e.g., multiferroicity Khomskii (2009), non-Fermi liquid behavior Stewart (2001), high-temperature superconductivity Dagotto (1994), or metal-insulator transitions Imada et al. (1998), which are not only very intriguing, but are also of high interest for future technological applications Heber (2009); Takagi and Hwang (2010); Z. and R. (2013). However, the quantitative predictive description of these materials and their properties represents a major challenge for modern computational materials science, due to the importance of electronic correlation effects as well as due to the intimate coupling between electronic, magnetic, and structural degrees of freedom. Imada et al. (1998); Dagotto and Tokura (2008)
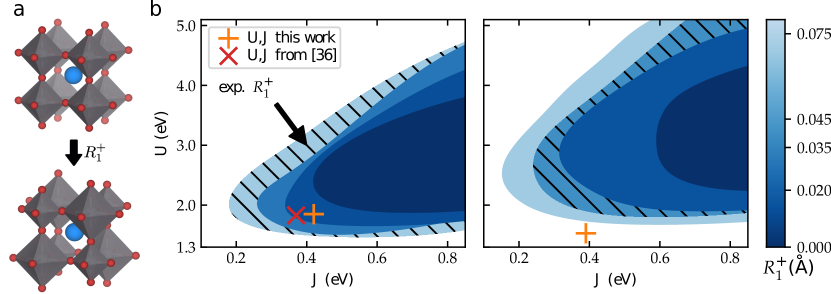
An example, which has received considerable attention recently, is the family of rare-earth nickelates, RNiO3, with =La-Lu and Y, which exhibit a rich phase diagram that is highly tunable by strain, doping, and electromagnetic fields Medarde (1997); Catalan (2008); Catalano et al. (2018); He and Millis (2015); Scherwitzl et al. (2010); Middey et al. (2016). All members of the nickelate series (except LaNiO3) exhibit a metal-insulator transition (MIT) as a function of temperature, which is accompanied by a structural distortion that lowers the space group symmetry from orthorhombic , where all Ni sites are symmetry-equivalent, to monoclinic , with two inequivalent types of Ni sites Alonso et al. (1999a, b, 2000, 2001). The structural distortion results in a three-dimensional checkerboard-like arrangement of long bond (LB) and short bond (SB) oxygen octahedra surrounding the two inequivalent Ni sites (see Fig. 2a), and corresponds to a zone-boundary breathing mode of the octahedral network with symmetry label Balachandran and Rondinelli (2013). In addition, all systems exhibit antiferromagnetic (AFM) order at low temperatures. García-Muñoz et al. (1992); Medarde (1997); Guo et al. (2018) For from Lu to Sm, the AFM transition occurs at lower temperatures than the MIT, whereas for =Nd and Pr, the magnetic transition coincides with the MIT. AFM order in LaNiO3 was only reported recently Guo et al. (2018) and is still under discussion Subedi (2017). Due to challenges in synthesis, experimental data on the bulk materials is relatively sparse, and quantitative predictive calculations are therefore highly valuable to gain a better understanding of the underlying mechanisms.
Different theoretical and computational approaches have highlighted different aspects of the coupled structural-electronic transition in the nickelates, thereby focusing either on structural or electronic aspects Park et al. (2012, 2014a, 2014b); Subedi et al. (2015); Haule and Pascut (2017); Mercy et al. (2017); Varignon et al. (2017); Hampel and Ederer (2017). Density functional theory plus Hubbard (DFT+) calculations have recently emphasized the coupling between the breathing mode and other structural distortions such as octahedral rotations, as well as the effect of magnetic order. Mercy et al. (2017); Hampel and Ederer (2017); Varignon et al. (2017) However, these calculations cannot properly describe the transition from the paramagnetic metal to the paramagnetic insulator observed in all nickelates with cations smaller than Nd, and thus cannot correctly capture the important electronic instability. Using DFT plus dynamical mean field theory (DFT+DMFT) Lechermann et al. (2006), the MIT has been classified as site-selective Mott transition Park et al. (2012), where an electronic instability drives the system towards a charge- (or bond-) disproportionated insulator. Subedi et al. (2015) However, the capability of DFT+DMFT to address structural properties is currently not well established, even though promising results have been achieved in previous work Park et al. (2014a, b); Haule and Pascut (2017), employing either simplified interpolation procedures between different structures, fixing lattice parameters to experimental data, or using ad hoc values for the interaction parameters.
Here, we combine a systematic analysis of the structural energetics, with an accurate DFT+DMFT-based description of the electronic structure, using screened interaction parameters obtained within the constrained random phase approximation (cRPA). Aryasetiawan et al. (2004) Our analysis thus incorporates both structural and electronic effects, and leads to a transparent and physically sound picture of the MIT in the nickelates, which also allows to obtain accurate structural parameters across the whole series. We find that the electronic instability is crucial to stabilize the breathing mode distortion by essentially “renormalizing” the corresponding total energy surface, resulting in a coupled structural-electronic first order transition. Trends across the series are driven by the degree of octahedral rotations, Mercy et al. (2017) which control both the strength of the electronic instability as well as the magnitude of the screened interaction parameters.
Results
Relaxation of structures and definition of correlated subspace
All systems are fully relaxed within the high-temperature space group using non-spinpolarized DFT calculations. We then use symmetry-based mode decomposition Perez-Mato et al. (2010) to analyze the relaxed structures and quantify the amplitudes of the various distortion modes. The mode decomposition allows for a clear conceptional distinction between different structural degrees of freedom, which enables us to obtain those structural degrees of freedom for which correlation effects are not crucial from standard DFT calculations, while the important breathing mode distortion is then obtained from DFT+DMFT total energy calculations. For further details on the DFT results and our distortion mode analysis we refer to our previous work Hampel and Ederer (2017).
Next, we construct a suitable low energy electronic subspace, for which the electron-electron interaction is treated within DMFT. Here, we follow the ideas of Subedi et al. Subedi et al. (2015), and construct Wannier functions only for a minimal set of bands with predominant Ni- character around the Fermi level, which in all cases (except LaNiO3) is well separated from other bands at lower and higher energies. The Wannier functions are then used as localized basis orbitals to construct the effective impurity problems for our fully charge self-consistent (CSC) DFT+DMFT calculations, Pourovskii et al. (2007) where the LB and SB Ni sites are treated as two separate impurity problems (even for zero amplitude) coupled through the DFT+DMFT self-consistency loop, and the system is constrained to remain paramagnetic. More details on the construction of the Wannier functions and the technical aspects of our CSC DFT+DMFT calculations can be found in the “Methods” section.
Phase diagrams
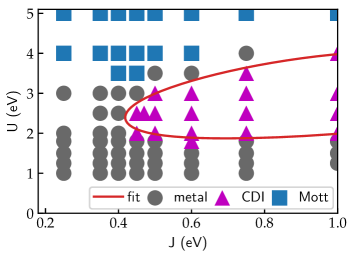
We first establish the main overall effect of the interaction parameters and on the electronic properties of LuNiO3 within the high symmetry structure, i.e. Å. The resulting phase diagram is presented in Fig. 1. Analogously to Ref. Subedi et al., 2015, we can identify three distinct phases: First, a standard Mott-insulating phase for large values, with vanishing spectral weight around the Fermi level, , and equal occupation of all Ni sites. Second, another insulating phase for moderate values of around 2 eV to 3.5 eV and relatively large ( eV), which is characterized by a strong difference in total occupation of the Wannier functions centered on LB and SB Ni sites, respectively ( and ). We denote this phase as charge disproportionated insulating (CDI) phase Mazin et al. (2007). Third, a metallic phase for small values in between the two insulating regions, with equal occupation on all Ni sites, , and non-vanishing spectral weight at the Fermi level, .
The CDI phase has been identified as the insulating low-temperature phase of nickelates in Ref. Subedi et al., 2015, where it has also been shown that the strong charge disproportionation is linked to the MIT (in Ref. Subedi et al., 2015 this phase has been termed “bond disproportionated insulating”). We note that the Wannier basis within our low energy subspace, while being centered on the Ni sites with strong character, also exhibits strong tails on the O ligands, and thus the corresponding charge is distributed over the central Ni atom and the surrounding O atoms. The strong charge disproportionation found within our chosen basis set is thus fully consistent with the observation that the integrated charge around the two different Ni atoms differs only marginally Park et al. (2012). Alternatively, within a negative charge transfer picture, the MIT can also be described, using a more atomic-like basis, as , where denotes a ligand hole (c.f. Refs. Park et al., 2012; Johnston et al., 2014; Varignon et al., 2017; Mandal et al., 2017).
One should also note that the CDI phase appears even though all Ni sites are structurally equivalent ( in Fig. 1), which indicates an electronic instability towards spontaneous charge disproportionation. This has already been found in Ref. Subedi et al., 2015, and indicates that a purely lattice-based description is incomplete. Moreover, within our CSC DFT+DMFT calculations, the CDI phase appears at significantly lower and a more confined range compared to the non-CSC calculations of Ref. Subedi et al., 2015. A similar reduction of values necessary to stabilize the CDI phase has also been achieved in the non-CSC DFT+DMFT calculations of Ref. Seth et al., 2017, through the introduction of an (effective) inter-site Hartree interaction.This suggests that the latter can indeed mimic the main effect of a CSC calculation, where the charge density, and thus the local occupations, are updated and the Hartree energy is recalculated in each CSC step.
Next, we investigate how the electronic instability corresponding to the CDI phase couples to the structural breathing mode distortion. For this, we vary only the amplitude, while keeping all other structural parameters fixed to the fully relaxed (within nonmagnetic DFT) structures, and calculate phase diagrams for different values of the amplitude. We do this for both LuNiO3 and PrNiO3, i.e., for the two compounds with the smallest and largest rare earth cations within the series that exhibit the MIT. The range of the CDI phase for a given amplitude is then extracted by interpolating the convex hull of the phase boundary (similar to the red line in Fig. 1). The results are summarized in Fig. 2b.
In both cases, =Lu and =Pr, the amplitude couples strongly to the CDI state, and increases the corresponding area within the phase diagam. In particular, the minimal required to stabilize the CDI phase is significantly lowered. Furthermore, also for =Pr, there is a spontaneous instability towards the formation of a CDI state, but the corresponding range is noticeably smaller than for =Lu. In addition, the minimal required to stabilize the CDI phase for a given amplitude is slighty higher for =Pr than for =Lu. We note that, since the ions do not contribute noticeably to any electronic states close to the Fermi level, the differences between the two materials are mainly due to the different underlying structures, specifically the weaker octahedral tilts in PrNiO3 compared to LuNiO3. This increases the electronic bandwidth, which opposes the tendency towards charge disproportionation.
Calculation of interaction parameters
So far we have varied and in order to obtain the general structure of the phase diagram. Next, we calculate and corresponding to our correlated subspace for all systems across the series to see where in these phase diagrams the real materials are located. We use cRPA Aryasetiawan et al. (2004) to extract the partially screened interaction parameters within the Hubbard-Kanamori parameterization, by separating off the screening channels related to electronic transitions within the correlated subspace from all other transitions (see also Methods section).
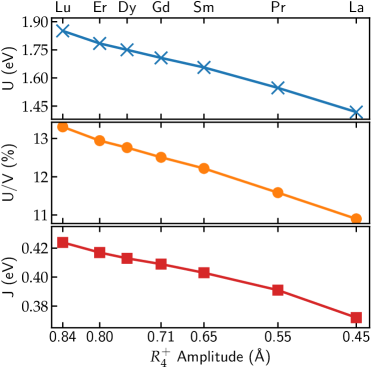
The results of these cRPA calculations are shown in Fig. 3 as a function of the cation and the corresponding amplitude, i.e., the main octahedral tilt mode in the structure. The effective interaction parameters corresponding to our correlated subspace are strongly screened compared to the bare interaction parameters . For LuNiO3, we obtain eV and eV, while eV with a corresponding bare value of 0.65 eV. This is in good agreement with Ref. Seth et al., 2017, which obtained eV and eV using the experimental structure. Furthermore, both and decrease monotonically across the series (for decreasing amplitude), leading to an additional reduction of by 25% in LaNiO3 compared to LuNiO3. This decrease is also observed in the ratio , indicating that it is due to an even stronger screening for =La compared to =Lu.
Our calculated parameters for =Lu and =Pr are also marked in the corresponding phase diagrams in Fig. 2. It is apparent, that for =Lu the calculated cRPA values are well within the stability region of the CDI phase, even for a relatively small amplitude of Å. In contrast, for =Pr, the values are outside the CDI phase even for amplitudes larger than the one experimentally observed. Thus, at their respective experimental breathing mode amplitudes, our calculations predict a paramagnetic CDI state for LuNiO3 but not for PrNiO3.
Lattice energetics
Up to now, we have been addressing the stability of the CDI phase for a given (fixed) amplitude. Now, we will address the stability of the mode itself and calculate its amplitude across the series using total energy calculations within CSC DFT+DMFT. The symmetry-based mode decomposition allows us to systematically vary only the mode, while keeping all other structural parameters fixed to the values obtained from the nonmagnetic DFT calculations. Thus, in contrast to interpolation procedures as in Refs. Park et al., 2014b or Haule and Pascut, 2017, our approach excludes any additional energy contributions related to simultaneous changes in other structural distortions, in particular the octahedral tilt modes.
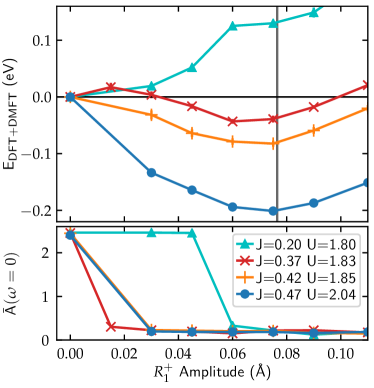
Fig. 4 shows the total energy and the spectral weight around the Fermi level, , as a function of the amplitude for LuNiO3, calculated using different values for . First, we focus on the results obtained using our cRPA calculated values ( eV, eV, orange crosses). It can be seen, that the energy indeed exhibits a minimum for an amplitude very close to the experimental value. Furthermore, as seen from , the system undergoes a MIT for increasing amplitude and is clearly insulating in the region around the energy minimum. Thus, our CSC DFT+DMFT calculations together with the calculated cRPA interaction parameters correctly predict the CDI ground state for LuNiO3, and furthermore result in a breathing mode amplitude that is in excellent agreement with experimental data.
To see how subtle changes in influence the energetics of the system, we also perform calculations using the cRPA values obtained in Ref. Seth et al., 2017 ( eV, eV, red diagonal crosses). In this case, we obtain a more shallow energy minimum at a slightly reduced amplitude of Å. This reduction is mainly caused by the slightly smaller . Moving the values of even closer to the boundary of the stability region of the CDI phase for the experimental amplitude, cf. Fig. 2 (e.g., eV, eV, cyan triangles), results in a loss of the energy minimum for finite amplitude. Nevertheless, a kink in the total energy is clearly visible at the amplitude for which the system becomes insulating, indicating the strong coupling between the structural distortion and the MIT. A similar kink can also be recognized (for rather small amplitude) in the total energy obtained for eV and 1.83 eV, resulting in an additional local energy minimum at , a typical hallmark of a first order structural transition. In addition, we also perform calculations where are increased by 10 % compared to our cRPA values ( eV, eV, red circles), which leads to a deeper energy minimum and an amplitude in near perfect agreement with experiment.
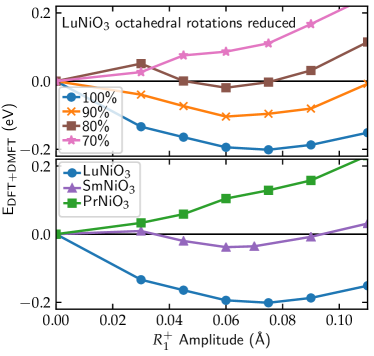
Next, we investigate the influence of the octahedral rotations on the energetics of the mode, where we perform a series of calculations for LuNiO3 with artificially decreased octahedral rotations (see methods section), fixed , and fixed volume. As can be seen from the data shown in the top panel of Fig. 5, decreasing the amplitude of the octahedral rotations to 70 %, which corresponds roughly to the amplitudes found for PrNiO3, leads to a vanishing of the minimum at non-zero amplitude. This confirms that the reduction of the octahedral rotation amplitudes plays a crucial role in the energetics of the breathing mode distortion and in determining the trend across the nickelate series.
Finally, we examine how the energetics of the mode varies across the series, by comparing the two end members LuNiO3 and PrNiO3, as well as SmNiO3, which is the compound with the largest cation in the series that still exhibits a paramagnetic CDI state. In each case we use values that are increased by 10 % relative to the corresponding cRPA values. The use of such slightly increased interaction parameters is motivated by the observation that the values obtained from the static limit of the (frequency-dependent) screened cRPA interaction are often too small to reproduce experimental data for various materials Casula et al. (2012); Lechermann et al. (2006); Anisimov et al. (2009); van Roekeghem et al. (2014). The results are depicted in Fig. 5.
As discussed above, for LuNiO3 (blue circles), we obtain an energy minimum exactly at the experimentally observed amplitude. For SmNiO3 (purple triangles), we obtain a much more shallow minimum at Å, which corresponds to a reduction by % compared to LuNiO3. Unfortunately, structural refinements for SmNiO3 are only available within the space group, and thus no information on the amplitude exists Rodríguez-Carvajal et al. (1998). However, the reduction of the amplitude from =Lu to =Sm is much more pronounced compared to previous DFT+ calculations with AFM order Hampel and Ederer (2017), where the reduction is only about %.
For PrNiO3 (green squares), no stable amplitude is obtained within our paramagnetic DFT+DMFT calculations, but a kink marking the MIT is still visible at Å. This is also in agreement with the experimental observation that no paramagnetic CDI phase occurs in PrNiO3 Medarde (1997). Furthermore, it was recently demonstrated using DFT+DMFT calculations that for NdNiO3 the CDI state becomes only favorable in the antiferromagnetically ordered state Haule and Pascut (2017). Our results indicate that this also holds for PrNiO3, while in SmNiO3 a stable amplitude can be found even in the paramagnetic case. Thus, the phase boundaries across the series are correctly described within the DFT+DMFT approach. We further note that, considering the phase diagrams for PrNiO3 in Fig. 2, a of up to 2.5 or even 3 eV would be required to put PrNiO3 well within the CDI phase region at its experimental amplitude, which appears necessary to obtain a stable amplitude. However, such a large seems highly unrealistic considering the calculated cRPA values.
Discussion
In summary, the successful application of CSC DFT+DMFT and symmetry-based mode analysis, without ad hoc assumptions regarding the strength of the Hubbard interaction or fixing structural parameters to experimental data, allows to elucidate the nature of the coupled electronic-structural transition across the nickelate series. Our analysis reveals that the MIT, which is related to an electronic instability towards spontaneous charge disproportionation, leads to a significant restructuring of the energy landscape, indicated by a kink in the calculated total energy. This creates a minimum at a finite amplitude (for appropriate and ), and suggests a first order character of the coupled structural and electronic transition in the PM case, in agreement with experimental observations Catalano et al. (2018) for both SmNiO3 Pérez-Cacho et al. (1999) and YNiO3. Alonso et al. (1999a) We note that, since a certain critical value of is necessary to induce the MIT (see, e.g., Fig. 4), a second order structural transition would imply the existence of an intermediate structurally distorted metallic phase, inconsistent with experimental observations.
The strength of the electronic instability towards spontaneous charge disproportionation and thus the stability range of the CDI phase, is strongly affected by the amplitude of the octahedral rotations, varying across the series. This is in agreement with Ref. Mercy et al., 2017, but in addition we show that to arrive at a fully coherent picture, with correct phase boundaries, it is crucial to treat both electronic and structural degrees of freedom on equal footing. For example, even though a CDI state can be obtained for PrNiO3 for fixed amplitude Å, our calculations show that this is indeed energetically unstable. In addition, the octahedral rotations also influence the screening of the effective interaction parameters, disfavoring the CDI state for larger cations. As a result, magnetic order appears to be crucial to stabilize the breathing mode distortion for both =Nd and Pr.
Moreover, our calculations not only lead to a coherent picture of the MIT, but also allow to obtain accurate structural parameters across the nickelate series. Furthermore, this is achieved using only a minimal correlated subspace. We note that the use of such a reduced correlated subspace can be advantageous, since it not only allows to reduce the computational effort (due to less degrees of freedom), but also because the double counting problem is typically less severe if the O- dominated bands are not included in the energy window of the correlated subspace. Janson and Held (2018); Karolak et al. (2010) In the present case, the resulting more extended Wannier functions, which also incorporate the hybridization with the surrounding ligands, also provide a rather intuitive picture of the underlying charge disproportionation.
Finally, our study represents the successful application of a combination of several state-of-the-art methods that allows to tackle other open issues related to the entanglement of structural and electronic properties in correlated materials, such as Jahn-Teller and Peierls instabilities, charge density wave, or polarons.
Methods
DFT calculations
All DFT calculations are performed using the projector augmented wave (PAW) method Blöchl (1994) implemented in the “Vienna Ab initio Simulation Package”(VASP) Kresse and Hafner (1993); Kresse and Furthmüller (1996); Kresse and Joubert (1999) and the exchange correlation functional according to Perdew, Burke, and Ernzerhof Perdew et al. (1996). For Ni, the 3 semi-core states are included as valence electrons in the PAW potential. For the rare-earth atoms, we use PAW potentials corresponding to a valence state with -electrons frozen into the core and, depending on the rare-earth cation, the corresponding and states are also included as valence electrons. A -point mesh with grid points along the three reciprocal lattice directions is used and a plane wave energy cut-off of 550 eV is chosen for the 20 atom unit cell. All structures are fully relaxed, both internal parameters and lattice parameters, until the forces acting on all atoms are smaller than eV/Å. As in Ref. Hampel and Ederer, 2017, we perform calculations for LaNiO3 within the and space groups, to allow for a more consistent comparison with the rest of the series, even though LaNiO3 is experimentally found in a different space group (). See also the discussion in Ref. Subedi, 2017.
Distortion mode analysis
For the symmetry-based mode decomposition Perez-Mato et al. (2010) we use the software ISODISTORT Campbell et al. (2006). Thereby, the atomic positions within a distorted low-symmetry crystal structure, , are written in terms of the positions in a corresponding non-distorted high-symmetry reference structure, , plus a certain number of independent distortion modes, described by orthonormal displacement vectors, , and corresponding amplitudes, :
| (1) |
The distortion modes of main interest here are the out-of-phase and in-phase tilts of the oxygen octahedra, and , for characterization of the high-temperature structure, and the breathing mode distortion within the low-temperature structure. A more detailed description for nickelates can be found, e.g., in Refs. Balachandran and Rondinelli, 2013; Hampel and Ederer, 2017. For the calculations with reduced octahedral rotation amplitudes shown in Fig. 5, both and modes, as well as the mode intimately coupled to these two modes, have been reduced by a common factor.
DMFT calculations
The Wannier functions for our CSC DFT+DMFT calculations are constructed via projections on local Ni orbitals as described in Ref. Schüler et al., 2018; Amadon et al., 2008, using the TRIQS/DFTTools software package. Aichhorn et al. (2016); Parcollet et al. (2015) The effective impurity problems within the DMFT loop are solved with the TRIQS/cthyb continuous-time hybridization-expansion solver Seth et al. (2016), including all off-diagonal spin-flip and pair-hopping terms of the interacting Hubbard-Kanamori Hamiltonian. Vaugier et al. (2012) The LB and SB Ni sites are treated as two separate impurity problems (even for zero amplitude), where the number of electrons per two Ni sites is fixed to 2, but the occupation of each individual Ni site can vary during the calculation (while the solution is constrained to remain paramagnetic).
The fully-localized limit Anisimov et al. (1997) is used to correct for the double-counting (DC) in the parametrization given in Ref. Held, 2007:
| (2) |
where is the occupation of Ni site , obtained in the DMFT loop, and the averaged Coulomb interaction is defined as . Note, that in our Wannier basis the occupations change quite drastically from the original DFT occupations and the choice of the DC flavor can therefore influence the outcome. However, with respect to the lattice energetics we found no difference in the physics of the system when changing the DC scheme or using fixed DFT occupation numbers for the calculation of the DC correction. If the DFT occupations are used instead of the DMFT occupations, larger interaction parameters are required to obtain the same predicted amplitude. However, we note that the DFT occupations have no clear physical meaning within CSC DFT+DMFT.
The spectral weight around the Fermi level, , is obtained from the imaginary time Green’s function: Fuchs et al. (2011)
| (3) |
For (), is identical to the spectral function at . For finite temperatures, it represents a weighted average around with a width of Fuchs et al. (2011).
The total energy is calculated as described in Ref. Lechermann et al., 2006:
| (4) | ||||
The first term is the DFT total energy, the second term subtracts the band energy of the Ni dominated bands (index ), the third term evaluates the kinetic energy within the correlated subspace via the lattice Green’s function, the fourth term adds the interaction energy, where we use the Galitskii-Migdal formula Abrikosov et al. (2012); Galitskii and Migdal (1958), and the last term subtracts the DC energy. To ensure good accuracy of the total energy, we represent both and in the Legendre basis Boehnke et al. (2011) and obtain thus smooth high-frequency tails and consistent Hartree shifts. Moreover, we sample the total energy over a minimum of additional 60 converged DMFT iterations after the CSC DFT+DMFT loop is converged. Convergence is reached when the standard error of the Ni site occupation of the last 10 DFT+DMFT loops is smaller than . That way we achieve an accuracy in the total energy of meV. All DMFT calculation are performed for eV-1, which corresponds to a temperature of 290 K.
cRPA calculations
We use the cRPA method as implemented in the VASP code Kaltak (2015) to extract interaction parameters for our correlated subspace. These calculations are done for the relaxed structures Hampel and Ederer (2017). We follow the ideas given in the paper of Ref. Subedi et al., 2015 and construct maximally localized Wannier functions (MLWFs) for the Ni- dominated bands around the Fermi level using the wannier90 package Mostofi et al. (2008). Since the corresponding bands are isolated from other bands at higher and lower energies, no disentanglement procedure is needed, except for LaNiO3, for which we ensured that the resulting Wannier functions are well converged and have a very similar spread as for all other compounds of the series.
We divide the total polarization, , into a contribution involving only transitions within the effective “” correlated subspace and the rest, . The constrained polarization, , and the static limit of the screened interaction matrix, , where is the bare interaction, are then calculated using a -point mesh, a plane wave energy cut-off of eV, and 576 bands. Effective values for the Hubbard-Kanamori interaction parameters are extracted from as described in Ref. Vaugier et al., 2012. Our procedure is analogous to the calculation of effective interaction parameters for LuNiO3 in Ref. Seth et al., 2017.
It should be noted that the MLWFs used for the cRPA calculations are not completely identical to the projected Wannier functions used as basis for the correlated subspace within our DMFT calculations. However, test calculations for the case of LuNiO3 showed only minor differences between the hopping parameters corresponding to the MLWFs and the ones corresponding to the Wannier functions generated by the projection scheme implemented in VASP. Furthermore, we did not find a noticeable difference between the screened values calculated for the MLWFs and the ones calculated for the initial guesses for these Wannier functions, i.e., before the spread minimization, which are also defined from orthogonalized projections on atomic-like orbitals. We thus conclude that the two sets of Wannier functions are indeed very similar, and that the cRPA values of obtained for the MLWFs are also representative for the Wannier basis used in our DMFT calculations.
Additionally, we point out that, in contrast to what was found in Ref. Seth et al., 2017, we observe only negligible differences in the interaction parameters obtained for the relaxed structure and the ones obtained for the experimental low-temperature structure for LuNiO3 (1.827 eV and 1.876 eV compared to 1.849 eV within ). In particular, the difference of the interaction parameters on the two inequivalent Ni sites in the structure (0.03 eV) are very small compared to the changes stemming from different degrees of octahedral rotations (i.e., different cations), justifying the use of constant interaction parameters for different amplitudes. Furthermore, the differences in the intra-orbital matrix elements between the and the orbitals are negligible small, eV, in our calculations. Therefore, all the values of the interaction parameters are averaged over both orbitals.
Data Availability Statement
The data that support the findings of this study are available from the corresponding author upon reasonable request.
Acknowledgements.
We are indebted to Oleg Peil and Antoine Georges for helpful discussions. This work was supported by ETH Zurich and the Swiss National Science Foundation through grant No. 200021-143265 and through NCCR-MARVEL. Calculations have been performed on the clusters “Mönch” and “Piz Daint”, both hosted by the Swiss National Supercomputing Centre, and the “Euler” cluster of ETH Zurich.Competing interests
The Authors declare no Competing Financial or Non-Financial Interests.
Author contributions
A.H. performed and analyzed all DFT and DMFT calculations. The cRPA calculations were done by A.H. with the help of P.L. and supervised by C.F. The whole project was initiated by C.E. The initial manuscript was written by A.H. and C.E. All authors discussed the results at different stages of the work and contributed to the final manuscript.
References
- Khomskii (2009) D. Khomskii, Physics 2, 20 (2009).
- Stewart (2001) G. R. Stewart, Reviews of Modern Physics 73, 797 (2001).
- Dagotto (1994) E. Dagotto, Reviews of Modern Physics 66, 763 (1994).
- Imada et al. (1998) M. Imada, A. Fujimori, and Y. Tokura, Reviews of Modern Physics 70, 1039 (1998).
- Heber (2009) J. Heber, Nature 459, 28 (2009).
- Takagi and Hwang (2010) H. Takagi and H. Y. Hwang, Science 327, 1601 (2010).
- Z. and R. (2013) Y. Z. and S. R., Critical Reviews in Solid State and Materials Sciences 38, 286 (2013).
- Dagotto and Tokura (2008) E. Dagotto and Y. Tokura, Materials Research Society Bulletin 33, 1037 (2008).
- Medarde (1997) M. L. Medarde, Journal of Physics: Condensed Matter 9, 1679 (1997).
- Catalan (2008) G. Catalan, Phase Transitions 81, 729 (2008).
- Catalano et al. (2018) S. Catalano, M. Gibert, J. Fowlie, J. Íñiguez, J.-M. Triscone, and J. Kreisel, Reports on Progress in Physics 81, 046501 (2018).
- He and Millis (2015) Z. He and A. J. Millis, Physical Review B 91, 195138 (2015).
- Scherwitzl et al. (2010) R. Scherwitzl, P. Zubko, I. G. Lezama, S. Ono, A. F. Morpurgo, G. Catalan, and J.-M. Triscone, Advanced Materials 22, 5517 (2010).
- Middey et al. (2016) S. Middey, J. Chakhalian, P. Mahadevan, J. Freeland, A. Millis, and D. Sarma, Annual Review of Materials Research 46, 305 (2016).
- Alonso et al. (1999a) J. A. Alonso, J. L. García-Muñoz, M. T. Fernández-Díaz, M. A. G. Aranda, M. J. Martínez-Lope, and M. T. Casais, Physical Review Letters 82, 3871 (1999a).
- Alonso et al. (1999b) J. A. Alonso, M. J. Martínez-Lope, M. T. Casais, M. A. G. Aranda, and M. T. Fernández-Díaz, Journal of the American Chemical Society 121, 4754 (1999b).
- Alonso et al. (2000) J. A. Alonso, M. J. Martínez-Lope, M. T. Casais, J. L. García-Muñoz, and M. T. Fernández-Díaz, Physical Review B 61, 1756 (2000).
- Alonso et al. (2001) J. A. Alonso, M. J. Martínez-Lope, M. T. Casais, J. L. García-Muñoz, M. T. Fernández-Díaz, and M. A. G. Aranda, Physical Review B 64, 094102 (2001).
- Balachandran and Rondinelli (2013) P. V. Balachandran and J. M. Rondinelli, Physical Review B 88, 054101 (2013).
- García-Muñoz et al. (1992) J. L. García-Muñoz, J. Rodríguez-Carvajal, and P. Lacorre, Europhysics Letters 20, 241 (1992).
- Guo et al. (2018) H. Guo, Z. W. Li, L. Zhao, Z. Hu, C. F. Chang, C.-Y. Kuo, W. Schmidt, A. Piovano, T. W. Pi, O. Sobolev, D. I. Khomskii, L. H. Tjeng, and A. C. Komarek, Nature Communications 9, 43 (2018).
- Subedi (2017) A. Subedi, ArXiv e-prints (2017), arXiv:1708.08899 [cond-mat.str-el] .
- Park et al. (2012) H. Park, A. J. Millis, and C. A. Marianetti, Physical Review Letters 109, 156402 (2012).
- Park et al. (2014a) H. Park, A. J. Millis, and C. A. Marianetti, Physical Review B 89, 245133 (2014a).
- Park et al. (2014b) H. Park, A. J. Millis, and C. A. Marianetti, Physical Review B 90, 235103 (2014b).
- Subedi et al. (2015) A. Subedi, O. E. Peil, and A. Georges, Physical Review B 91, 075128 (2015).
- Haule and Pascut (2017) K. Haule and G. L. Pascut, Scientific Reports 7, 10375 (2017).
- Mercy et al. (2017) A. Mercy, J. Bieder, J. Íñiguez, and P. Ghosez, Nature Communications 8, 1677 (2017).
- Varignon et al. (2017) J. Varignon, M. N. Grisolia, J. Íñiguez, A. Barthélémy, and M. Bibes, Nature Partner Journals Quantum Materials , 1 (2017).
- Hampel and Ederer (2017) A. Hampel and C. Ederer, Physical Review B 96, 165130 (2017).
- Lechermann et al. (2006) F. Lechermann, A. Georges, A. Poteryaev, S. Biermann, M. Posternak, A. Yamasaki, and O. K. Andersen, Physical Review B 74, 125120 (2006).
- Aryasetiawan et al. (2004) F. Aryasetiawan, M. Imada, A. Georges, G. Kotliar, S. Biermann, and A. I. Lichtenstein, Physical Review B 70, 195104 (2004).
- Perez-Mato et al. (2010) J. M. Perez-Mato, D. Orobengoa, and M. I. Aroyo, Acta Crystallographica A 66, 558 (2010).
- Pourovskii et al. (2007) L. V. Pourovskii, B. Amadon, S. Biermann, and A. Georges, Physical Review B 76, 235101 (2007).
- Medarde et al. (2008) M. L. Medarde, M. T. Fernández-Díaz, and P. Lacorre, Physical Review B 78, 212101 (2008).
- Seth et al. (2017) P. Seth, O. E. Peil, L. Pourovskii, M. Betzinger, C. Friedrich, O. Parcollet, S. Biermann, F. Aryasetiawan, and A. Georges, Physical Review B 96, 205139 (2017).
- Mazin et al. (2007) I. I. Mazin, D. I. Khomskii, R. Lengsdorf, J. A. Alonso, W. G. Marshall, R. M. Ibberson, A. Podlesnyak, M. J. Martínez-Lope, and M. M. Abd-Elmeguid, Physical Review Letters 98, 176406 (2007).
- Johnston et al. (2014) S. Johnston, A. Mukherjee, I. Elfimov, M. Berciu, and G. A. Sawatzky, Physical Review Letters 112, 106404 (2014).
- Mandal et al. (2017) B. Mandal, S. Sarkar, S. K. Pandey, P. Mahadevan, C. Franchini, A. J. Millis, and D. D. Sarma, ArXiv e-prints (2017), arXiv:1701.06819 [cond-mat.str-el] .
- Casula et al. (2012) M. Casula, P. Werner, L. Vaugier, F. Aryasetiawan, T. Miyake, A. J. Millis, and S. Biermann, Physical Review Letters 109, 126408 (2012).
- Anisimov et al. (2009) V. I. Anisimov, D. M. Korotin, M. A. Korotin, A. V. Kozhevnikov, J. Kunes, A. O. Shorikov, S. L. Skornyakov, and S. V. Streltsov, Journal of Physics: Condensed Matter 21, 075602 (2009).
- van Roekeghem et al. (2014) A. van Roekeghem, T. Ayral, J. M. Tomczak, M. Casula, N. Xu, H. Ding, M. Ferrero, O. Parcollet, H. Jiang, and S. Biermann, Physical Review Letters 113, 266403 (2014).
- Rodríguez-Carvajal et al. (1998) J. Rodríguez-Carvajal, S. Rosenkranz, M. Medarde, P. Lacorre, M. T. Fernandez-Díaz, F. Fauth, and V. Trounov, Physical Review B 57, 456 (1998).
- Pérez-Cacho et al. (1999) J. Pérez-Cacho, J. Blasco, J. García, M. Castro, and J. Stankiewicz, Journal of Physics: Condensed Matter 11, 405 (1999).
- Janson and Held (2018) O. Janson and K. Held, Physical Review B 98, 115118 (2018).
- Karolak et al. (2010) M. Karolak, G. Ulm, T. Wehling, V. Mazurenko, A. Poteryaev, and A. Lichtenstein, Journal of Electron Spectroscopy and Related Phenomena 181, 11 (2010), proceedings of International Workshop on Strong Correlations and Angle-Resolved Photoemission Spectroscopy 2009.
- Blöchl (1994) P. E. Blöchl, Physical Review B 50, 17953 (1994).
- Kresse and Hafner (1993) G. Kresse and J. Hafner, Physical Review B 47, 558 (1993).
- Kresse and Furthmüller (1996) G. Kresse and J. Furthmüller, Physical Review B 54, 11169 (1996).
- Kresse and Joubert (1999) G. Kresse and D. Joubert, Physical Review B 59, 1758 (1999).
- Perdew et al. (1996) J. P. Perdew, K. Burke, and M. Ernzerhof, Physical Review Letters 77, 3865 (1996).
- Campbell et al. (2006) B. J. Campbell, H. T. Stokes, D. E. Tanner, and D. M. Hatch, Journal of Applied Crystallography 39, 607 (2006).
- Schüler et al. (2018) M. Schüler, O. E. Peil, G. J. Kraberger, R. Pordzik, M. Marsman, G. Kresse, T. O. Wehling, and M. Aichhorn, Journal of Physics: Condensed Matter 30, 475901 (2018).
- Amadon et al. (2008) B. Amadon, F. Lechermann, A. Georges, F. Jollet, T. O. Wehling, and A. I. Lichtenstein, Physical Review B 77, 205112 (2008).
- Aichhorn et al. (2016) M. Aichhorn, L. Pourovskii, P. Seth, V. Vildosola, M. Zingl, O. E. Peil, X. Deng, J. Mravlje, G. J. Kraberger, C. Martins, M. Ferrero, and P. O., Computer Physics Communications 204, 200 (2016).
- Parcollet et al. (2015) O. Parcollet, M. Ferrero, T. Ayral, H. Hafermann, I. Krivenko, L. Messio, and P. Seth, Computer Physics Communications 196, 398 (2015).
- Seth et al. (2016) P. Seth, I. Krivenko, M. Ferrero, and O. Parcollet, Computer Physics Communications 200, 274 (2016).
- Vaugier et al. (2012) L. Vaugier, H. Jiang, and S. Biermann, Physical Review B 86, 165105 (2012).
- Anisimov et al. (1997) V. I. Anisimov, F. Aryasetiawan, and A. I. Lichtenstein, Journal of Physics: Condensed Matter 9, 767 (1997).
- Held (2007) K. Held, Advances in Physics 56, 829 (2007).
- Fuchs et al. (2011) S. Fuchs, E. Gull, M. Troyer, M. Jarrell, and T. Pruschke, Physical Review B 83, 235113 (2011).
- Abrikosov et al. (2012) A. A. Abrikosov, L. P. Gorkov, I. E. Dzyaloshinski, and R. A. Silverman, Methods of Quantum Field Theory in Statistical Physics, Dover Books on Physics (Dover Publications, 2012).
- Galitskii and Migdal (1958) V. M. Galitskii and A. B. Migdal, Soviet Physics Journal of Experimental and Theoretical Physics 7 (1958).
- Boehnke et al. (2011) L. Boehnke, H. Hafermann, M. Ferrero, F. Lechermann, and O. Parcollet, Physical Review B 84, 075145 (2011).
- Kaltak (2015) M. Kaltak, Merging GW with DMFT, Ph.D. thesis, University of Vienna http://othes.univie.ac.at/38099/ (2015).
- Mostofi et al. (2008) A. A. Mostofi, J. R. Yates, Y.-S. Lee, I. Souza, D. Vanderbilt, and N. Marzari, Computer Physics Communications 178, 685 (2008).