Extreme AGN variability: evidence of magnetically elevated accretion?
Abstract
Rapid, large amplitude variability at optical to X-ray wavelengths is now seen in an increasing number of Seyfert galaxies and luminous quasars. The variations imply a global change in accretion power, but are too rapid to be communicated by inflow through a standard thin accretion disc. Such discs are long known to have difficulty explaining the observed optical/UV emission from active galactic nuclei. Here we show that alternative models developed to explain these observations have larger scale heights and shorter inflow times. Accretion discs supported by magnetic pressure in particular are geometrically thick at all luminosities, with inflow times as short as the observed few year timescales in extreme variability events to date. Future time-resolved, multi-wavelength observations can distinguish between inflow through a geometrically thick disc as proposed here, and alternative scenarios of extreme reprocessing of a central source or instability-driven limit cycles.
keywords:
black holes — galaxies: active — variability1 Introduction
The standard “thin disc” theory (Shakura & Sunyaev, 1973; Novikov & Thorne, 1973) explains the high radiative efficiency, luminosity, and spectral peak locations seen from black holes accreting at the Eddington rate. However, it is difficult to reconcile the theory with optical/UV observations of active galactic nuclei (AGN):
- •
- •
-
•
AGN accretion disc spectra are broader than expected (Zheng et al., 1997; Davis et al., 2007), typically peak around Å (Shull et al., 2012), and do not show the expected dependence (Davis et al., 2007; Laor & Davis, 2014), where is the black hole mass and is the dimensionless accretion rate, equivalent to the Eddington ratio for a radiative efficiency .
- •
AGN optical/UV variability has typical rms amplitudes of . Wide field surveys find that up to of quasars undergo “extreme” variability, where the optical luminosity changes by a factor (Rumbaugh et al., 2018). In “changing look” AGN, the broad emission lines appear or disappear, causing transitions between Types 1 and 2 (or 1.8/1.9). Known previously in a few nearby Seyferts (Tohline & Osterbrock, 1976; Cohen et al., 1986; Storchi-Bergmann et al., 1995), such events are now also found from luminous quasars in wide-field surveys (MacLeod et al., 2016; Ruan et al., 2016; Yang et al., 2017; Wang et al., 2018) increasing the sample to total. The changes in broad line flux correspond to factor changes in continuum luminosity, which occur on timescales of a few years (e.g., LaMassa et al., 2015; Gezari et al., 2017). The timescale does not seem to depend on the type of object or whether the luminosity is increasing or decreasing.
Variable obscuration is disfavored for changing look AGN. The obscuring medium would need to have a large size and high speed to cover both the broad line and continuum emission regions. In one case the mid-infrared flux decreases, so that obscuring material would have to block the torus (Stern et al., 2018), while in another there is no linear polarization signature (Hutsemékers et al., 2017) as seen in Type 2 AGN. In addition, in the Seyfert galaxy Mrk 1018 a full optical to X-ray SED shows no sign of variable obscuration, but is rather fully consistent with a drop in intrinsic accretion power by a factor (McElroy et al., 2016; Husemann et al., 2016) over a few years. The timescales seen in the small sample of changing look events are similar to those of normal (Kelly et al., 2009; MacLeod et al., 2010) and extreme AGN variability, and the extreme objects do not stand out from the overall population except for their large variability amplitudes (Rumbaugh et al., 2018). Therefore, changing look objects may simply be the high amplitude tail of normal AGN variability and not the result of discrete events (e.g., mergers or state transitions, Kim et al., 2018; Noda & Done, 2018; Ross et al., 2018). Apparently many or even most AGN can undergo rapid, large amplitude, coordinated luminosity variations, implying a much faster propagation timescale through the accretion disc than predicted: a “viscosity crisis" (Lawrence, 2018).
The crisis comes from the fact that in standard theory the disc is expected to be “razor thin," but that theory is clearly problematic for AGN. Here we estimate inflow times for three alternative disc models (§2) introduced in the literature in order to explain one or more of these tensions between theory and observation. Generically, discs in these scenarios are thicker, leading to shorter inflow times that could help explain extreme AGN variability (§2.4). We show that accretion discs supported vertically by strong magnetic fields (“magnetically elevated discs") provide a particularly promising explanation, and discuss how time-resolved photometry of changing look events can constrain their physical origin (§3).
2 Geometrically thick AGN accretion discs
In the standard thin disc model (Shakura & Sunyaev, 1973; Novikov & Thorne, 1973), radiation pressure provides the vertical support against gravity at small radius (Krolik, 1999),
| (1) |
where (Hawley et al., 2011) is the dimensionless viscosity parameter, is the opacity scaled to the value for Thomson scattering, and is the gravitational radius. Both the predicted and measured (Dai et al., 2010; Blackburne et al., 2014; McHardy et al., 2014) sizes of the X-ray and optical emission regions for are in the radiation-dominated regions of the disc.
When radiation pressure dominates, the disc is thin, with a constant height for radii far from the inner edge:
| (2) |
where and are relativistic correction factors (Novikov & Thorne, 1973; Krolik, 1999) approaching unity at large and at where is the disc inner radius assumed to be the marginally stable orbit.
The inflow time is given as , where is the disc viscosity. In the thin disc framework, this is
| (3) | ||||
where the second estimate is for the thin disc model in the radiation pressure supported regime far from the inner edge, and we fix the black hole mass throughout.
This timescale is long at large radii and/or low luminosity, so that changes in the outer optical emission region should be much slower and separated in time from those in the inner UV and X-ray region. Neither should operate on timescales of a few years as seen in changing look AGN. Equally problematic, the inflow time should scale strongly with luminosity, in conflict with observations where “turn on" and “turn off" events occur equally rapidly (LaMassa et al., 2015; Gezari et al., 2017).
Proposed alternative accretion disc models remove inconsistencies in standard theory and help reconcile it with optical/UV observations. The disc structure is generically thicker in these models, leading to shorter inflow times. Here we estimate inflow times of a few such scenarios which hold promise for explaining extreme AGN variability.
2.1 Extra dissipation near the inner edge
Shakura & Sunyaev (1973) and Novikov & Thorne (1973) assumed that the stress vanishes at the disc inner edge. This is convenient for calculating disc structure, but leads to singularities in the surface density and scale height which disappear in a more careful treatment of the boundary conditions (Abramowicz et al., 1988). Gammie (1999) and Agol & Krolik (2000) further examined the effects of magnetic torques, which do not vanish at the inner edge.
In Agol & Krolik (2000), the effect is parameterized as an extra radiative efficiency which contributes to :
| (4) |
where is another relativistic correction factor (Agol & Krolik, 2000) of order unity and is evaluated at . The disc scale height increases significantly when or for . For a non-spinning black hole, the disc thickness significantly increases for , for , . The effects are strongly concentrated near since the extra dissipation term scales as instead of for a thin disc.
2.2 UV line opacity
The thin disc solution includes free-free and electron scattering opacity. The temperatures of inner AGN discs are similar to those of massive stars, and so line opacity from heavy elements is expected to play an important role. When including lines (ignored in the thin disc model), the mean opacity at temperatures K is a factor higher than for solar metallicity (Jiang et al., 2015). This can alter the thermal stability of the disc (Jiang et al., 2016), and clearly including it will increase the scale height at least over the range of radii with temperatures near this value.
As in massive stars, line driving could also produce powerful winds (Murray & Chiang, 1995; Proga et al., 2000; Proga, 2005). Laor & Davis (2014) showed that if the mass loss rate per unit area scaling derived in O stars holds for AGN, the total mass loss rate exceeds the accretion rate inside the radius
| (5) |
In their model, the disc truncates at . At smaller radii the disc becomes geometrically thick and optically thin, greatly decreasing the inflow time for .
A proper calculation of the scale height from this model would require self-consistently solving for accretion and outflow, whereas currently simulations including the frequency-dependent line opacity treat the thin disc as a boundary condition and ignore its vertical structure (e.g., Proga et al., 2000). Radiation MHD simulations including line opacity are now possible (Jiang et al., 2017), but use a gray opacity. Here we instead use a schematic picture of such a disc to estimate the inflow time. We assume for . The effects of mass loss are highly concentrated near (Laor & Davis, 2014), so we adopt a power law scaling of and find by matching onto the thin disc value of at .
2.3 Magnetically elevated discs
The thin disc model includes gas and radiation pressure but ignores magnetic fields. MHD simulations of small patches of accretion discs (shearing box simulations) generically find that magnetic pressure declines more slowly with height than radiation or gas pressure, and so dominates in the upper atmosphere of the disc (Miller & Stone, 2000). Those simulations usually adopt an initial condition with weak or no vertical magnetic field. If it can be efficiently brought to the black hole, the magnetic flux available in the inner parts of galaxies could instead be large. In that case, the toroidal field amplified by the MRI (Balbus & Hawley, 1991) can become strong enough to support the disc vertically (Bai & Stone, 2013; Salvesen et al., 2016).
The vertical structure of such magnetically elevated discs remains uncertain. In an early one-zone model, Begelman & Pringle (2007) assumed that the toroidal field grows to a limiting field strength beyond which the MRI shuts off (Pessah & Psaltis, 2005): , where , , and are the Alfvén, orbital, and sound speeds. The gas to magnetic pressure ratio is , which is for a gas pressure supported thin disc and so is small.
Begelman et al. (2015) took into account the competition between the generation of toroidal field by MRI and shear — assumed to occur at all heights — and its buoyant escape. Their vertically stratified models agree better with shearing-box simulations (Bai & Stone, 2013; Salvesen et al., 2016) and yield a much larger characteristic scale height, even if the Pessah–Psaltis criterion is imposed:
| (6) |
where we have used their height for the elevated MRI-active layer. More recent studies of MRI in the presence of a strong toroidal field, however, show that MRI never completely stabilizes, even for very strong toroidal fields, although it passes through a range of small values (Das et al., 2018). Moreover, shearing-box simulations, which lack toroidal field-line curvature and should be more stable than global simulations with a strong toroidal field (Blaes & Balbus, 1994), show no evidence of MRI suppression in the nonlinear state. It seems reasonable to guess that magnetically elevated discs can thicken to (Begelman & Silk, 2017). In the following we will adopt the result of equation 6, as well as constant for comparison. The MRI stress also grows with magnetic flux, and in the magnetically elevated case we assume . However, is independent of when the height is given by equation 6.
2.4 Inflow times and extreme AGN variability
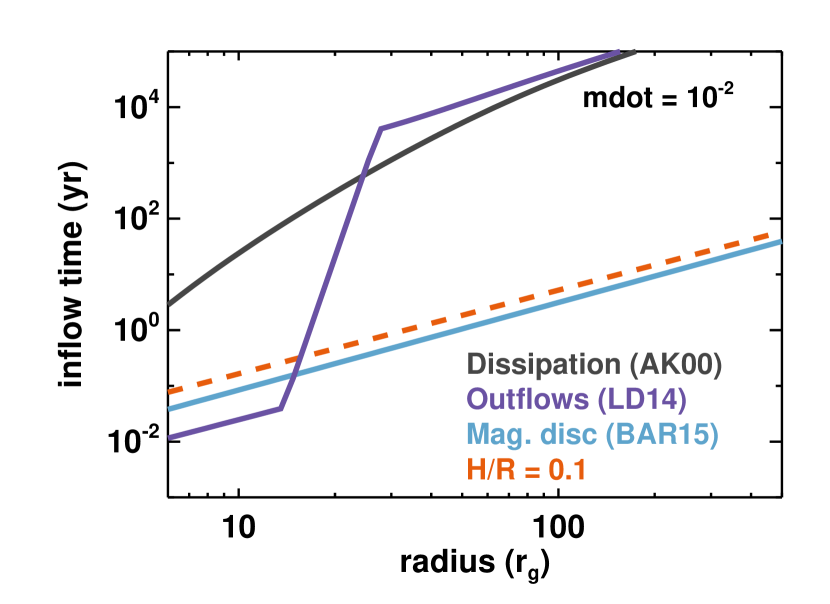
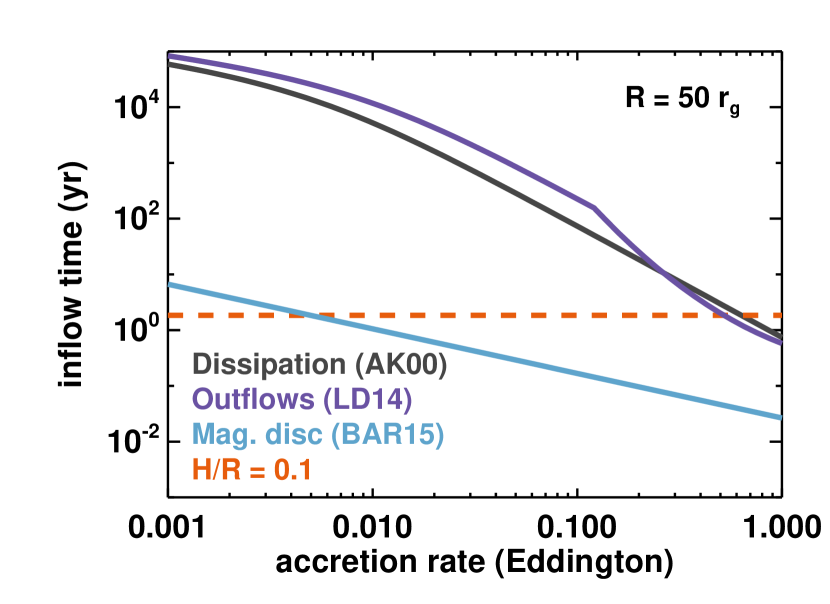
Figure 1 shows estimated inflow times (equation LABEL:eq:inflowtime) for each of these scenarios as a function of and for (). For low accretion rates and large radii, the thin disc inflow time is very long ( years) even when including extra dissipation or possible effects of line-driven outflows (dark gray and purple curves). In both scenarios the inflow time becomes short for or where the added effects become important ( or ). For intrinsic disc emission at the measured size (Dai et al., 2010; Blackburne et al., 2014; McHardy et al., 2014), changing look AGN in relatively low-luminosity Seyfert galaxies () are difficult to explain in these scenarios.
Magnetically elevated discs are geometrically thick over the entire parameter space, leading to very short inflow times (blue). When magnetic pressure supports the disc vertically against gravity, its thermal content (luminosity, temperature) is decoupled from the structure. The scale height and inflow time are not only short, but also relatively insensitive to . This provides a natural explanation for the few year timescales seen in changing look AGN at both low and high luminosity.
3 Discussion
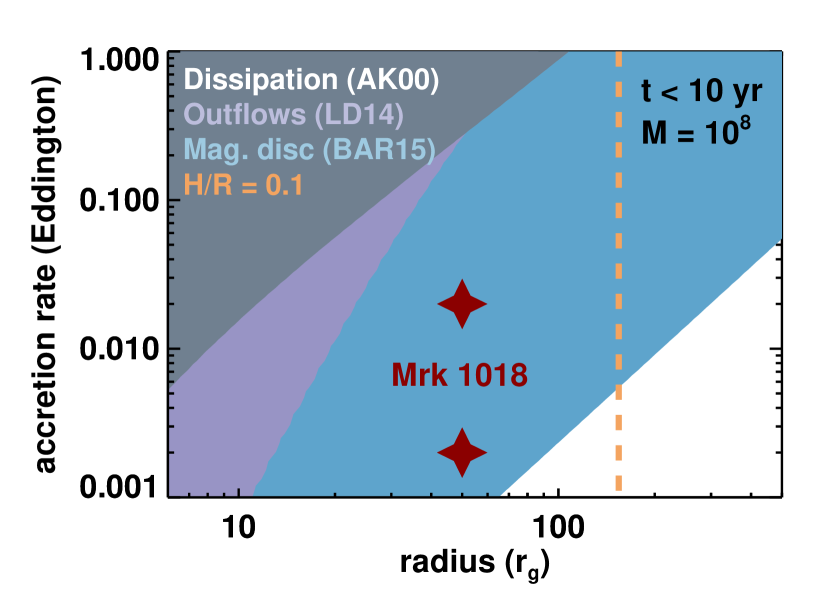
Extreme AGN variability with factor optical/UV/X-ray luminosity changes on year timescales places stringent constraints on accretion theory. In the standard picture of fluctuations propagating through the disc, the propagation timescale must be much shorter than expected: the disc must be geometrically thick. We have shown that three alternative AGN accretion disc models from the literature predict larger scale heights and shorter inflow times than in standard theory. Figure 2 summarizes the results, showing regions in the () and parameter space where our estimated years in each case, as implied (Pringle, 1981) by the yr timescale for the most rapid large amplitude variations seen so far (Gezari et al., 2017). The red stars schematically show the changing look AGN Mrk 1018, assuming that the variations are sourced at the optical emission radius . Adding extra dissipation only leads to short inflow times at small radius and/or high luminosity. The result is similar for the effects of UV opacity (Laor & Davis, 2014). Magnetically elevated discs are a particularly appealing option for reconciling extreme AGN variability with disc theory. The disc is geometrically thick leading to short inflow times with a weak dependence on luminosity, consistent with the observed few year timescales in both Seyfert galaxies and quasars.
Our estimates are heuristic, either taken from past semi-analytic work (Agol & Krolik, 2000; Begelman et al., 2015) or estimated in toy models based on that work (Laor & Davis, 2014). In the case of UV opacity, we have not calculated the vertical structure, and have ignored the bulk increase in the total opacity coming from lines (e.g., Jiang et al., 2015). A calculation of the disc structure and emergent spectrum are needed to determine whether a magnetically elevated disc can produce the observed AGN SED, especially at high where the absorption and effective optical depths may be small. These improvements are left to future work.
Geometrically thick accretion discs help explain how large amplitude AGN variability can occur on timescales year, but the physical origin of the events remain uncertain. Scenarios proposed for changing look AGN include instability driven limit cycles (Ross et al., 2018) or state transitions (Noda & Done, 2018), both of which are seen in X-ray binaries. These scenarios invoke radiation pressure effects, which we disfavor. Radiation pressure is strongest at high luminosity and small radius, whereas extreme variability prefers low luminosity (Rumbaugh et al., 2018) and the optical emission comes from large radius (Morgan et al., 2010; McHardy et al., 2014). The short observed timescales can be explained if the variability is driven entirely by reprocessed UV/X-ray radiation from the inner disc (Shappee et al., 2014; LaMassa et al., 2015; Lawrence, 2018) and radiation pressure and outflow will increase the irradiation by thickening the inner disc (Agol & Krolik, 2000). However, this seems disfavored by energetics in Mrk 1018 due to the low X-ray/UV luminosity (Husemann et al., 2016). In addition, in all of these scenarios the variability timescale should strongly depend on luminosity (eq. LABEL:eq:inflowtime), which has not been seen.
We propose instead that AGN accretion discs are supported by strong toroidal magnetic fields. Magnetic pressure support leads to a geometrically thick disc whose scale height is decoupled from its thermal properties. This suppresses the thermal instability and leads to a short inflow time at all observed luminosities. In this scenario, the variability mechanism is the same for normal and extreme AGN, with the latter the high amplitude tail of a continuous distribution. Rumbaugh et al. (2018) find that extreme AGN make up of the population, and are only distinct in their variability amplitudes (and slightly lower ). The variability mechanism is likely to either be mass accretion rate or thermal fluctuations (Kelly et al., 2009; Ruan et al., 2014; Hung et al., 2016) which then propagate through the disc to produce changes over a wide spectral range. Magnetically elevated accretion shows large density inhomogeneities (Salvesen et al., 2016) and could support large temperature fluctuations. The same features may produce the observed flat spectra and large sizes in the optical/UV (Dexter & Agol, 2011; Hall et al., 2018). For the observed year timescales, this scenario predicts for the origin of the variability (figure 2), in the outer disc but within the broad emission line region. The broad line luminosity and width should therefore trace the continuum variations.
A sharp change in mass accretion rate should be seen first in the optical and finally in the UV as it propagates inwards. In the case of extreme reprocessing, the propagation should proceed with high energies leading, while instability-driven heating and cooling fronts can travel in both directions. In this way time-resolved, multi-band photometry during extreme variability events can provide a direct probe of AGN accretion physics.
Acknowledgements
JD thanks S. W. Davis and the participants of the 2017 meeting “Unveiling the Physics Behind Extreme AGN Variability" for stimulating discussions. This work was supported by a Sofja Kovalevskaja award from the Alexander von Humboldt foundation. MB acknowledges support from NASA Astrophysics Theory Program grant NNX17AK55G.
References
- Abramowicz et al. (1988) Abramowicz M. A., Czerny B., Lasota J. P., Szuszkiewicz E., 1988, ApJ, 332, 646
- Agol & Krolik (2000) Agol E., Krolik J. H., 2000, ApJ, 528, 161
- Bai & Stone (2013) Bai X.-N., Stone J. M., 2013, ApJ, 767, 30
- Balbus & Hawley (1991) Balbus S. A., Hawley J. F., 1991, ApJ, 376, 214
- Begelman & Pringle (2007) Begelman M. C., Pringle J. E., 2007, MNRAS, 375, 1070
- Begelman & Silk (2017) Begelman M. C., Silk J., 2017, MNRAS, 464, 2311
- Begelman et al. (2015) Begelman M. C., Armitage P. J., Reynolds C. S., 2015, ApJ, 809, 118
- Blackburne et al. (2014) Blackburne J. A., Kochanek C. S., Chen B., Dai X., Chartas G., 2014, ApJ, 789, 125
- Blaes & Balbus (1994) Blaes O. M., Balbus S. A., 1994, ApJ, 421, 163
- Clavel et al. (1991) Clavel J., et al., 1991, ApJ, 366, 64
- Cohen et al. (1986) Cohen R. D., Rudy R. J., Puetter R. C., Ake T. B., Foltz C. B., 1986, ApJ, 311, 135
- Dai et al. (2010) Dai X., Kochanek C. S., Chartas G., Kozłowski S., Morgan C. W., Garmire G., Agol E., 2010, ApJ, 709, 278
- Das et al. (2018) Das U., Begelman M. C., Lesur G., 2018, MNRAS, 473, 2791
- Davis et al. (2007) Davis S. W., Woo J., Blaes O. M., 2007, ApJ, 668, 682
- Dexter & Agol (2011) Dexter J., Agol E., 2011, ApJ, 727, L24
- Gammie (1999) Gammie C. F., 1999, ApJ, 522, L57
- Gezari et al. (2017) Gezari S., et al., 2017, ApJ, 835, 144
- Goodman (2003) Goodman J., 2003, MNRAS, 339, 937
- Hall et al. (2018) Hall P. B., Sarrouh G. T., Horne K., 2018, ApJ, 854, 93
- Hawley et al. (2011) Hawley J. F., Guan X., Krolik J. H., 2011, ApJ, 738, 84
- Hung et al. (2016) Hung T., et al., 2016, ApJ, 833, 226
- Husemann et al. (2016) Husemann B., et al., 2016, A&A, 593, L9
- Hutsemékers et al. (2017) Hutsemékers D., Agís González B., Sluse D., Ramos Almeida C., Acosta Pulido J.-A., 2017, A&A, 604, L3
- Jiang et al. (2015) Jiang Y.-F., Cantiello M., Bildsten L., Quataert E., Blaes O., 2015, ApJ, 813, 74
- Jiang et al. (2016) Jiang Y.-F., Davis S. W., Stone J. M., 2016, ApJ, 827, 10
- Jiang et al. (2017) Jiang Y.-F., Stone J., Davis S. W., 2017, preprint, (arXiv:1709.02845)
- Kelly et al. (2009) Kelly B. C., Bechtold J., Siemiginowska A., 2009, ApJ, 698, 895
- Kim et al. (2018) Kim D.-C., Yoon I., Evans A., 2018, preprint, (arXiv:1805.05251)
- Krolik (1999) Krolik J. H., 1999, Active galactic nuclei : from the central black hole to the galactic environment. Princeton University Press
- Krolik et al. (1991) Krolik J. H., Horne K., Kallman T. R., Malkan M. A., Edelson R. A., Kriss G. A., 1991, ApJ, 371, 541
- LaMassa et al. (2015) LaMassa S. M., et al., 2015, ApJ, 800, 144
- Laor & Davis (2014) Laor A., Davis S. W., 2014, MNRAS, 438, 3024
- Lawrence (2018) Lawrence A., 2018, Nature Astronomy, 2, 102
- Lightman & Eardley (1974) Lightman A. P., Eardley D. M., 1974, ApJ, 187, L1
- MacLeod et al. (2010) MacLeod C. L., et al., 2010, ApJ, 721, 1014
- MacLeod et al. (2016) MacLeod C. L., et al., 2016, MNRAS, 457, 389
- McElroy et al. (2016) McElroy R. E., et al., 2016, A&A, 593, L8
- McHardy et al. (2014) McHardy I. M., et al., 2014, MNRAS, 444, 1469
- Miller & Stone (2000) Miller K. A., Stone J. M., 2000, ApJ, 534, 398
- Morgan et al. (2010) Morgan C. W., Kochanek C. S., Morgan N. D., Falco E. E., 2010, ApJ, 712, 1129
- Murray & Chiang (1995) Murray N., Chiang J., 1995, ApJ, 454, L105
- Noda & Done (2018) Noda H., Done C., 2018, preprint, (arXiv:1805.07873)
- Novikov & Thorne (1973) Novikov I. D., Thorne K. S., 1973, in Black Holes (Les Astres Occlus). New York: Gordon and Breach
- Pessah & Psaltis (2005) Pessah M. E., Psaltis D., 2005, ApJ, 628, 879
- Pringle (1981) Pringle J. E., 1981, ARA&A, 19, 137
- Proga (2005) Proga D., 2005, ApJ, 630, L9
- Proga et al. (2000) Proga D., Stone J. M., Kallman T. R., 2000, ApJ, 543, 686
- Ross et al. (2018) Ross N. P., et al., 2018, preprint, (arXiv:1805.06921)
- Ruan et al. (2014) Ruan J. J., Anderson S. F., Dexter J., Agol E., 2014, ApJ, 783, 105
- Ruan et al. (2016) Ruan J. J., et al., 2016, ApJ, 826, 188
- Rumbaugh et al. (2018) Rumbaugh N., et al., 2018, ApJ, 854, 160
- Salvesen et al. (2016) Salvesen G., Armitage P. J., Simon J. B., Begelman M. C., 2016, MNRAS, 460, 3488
- Shakura & Sunyaev (1973) Shakura N. I., Sunyaev R. A., 1973, A&A, 24, 337
- Shakura & Sunyaev (1976) Shakura N. I., Sunyaev R. A., 1976, MNRAS, 175, 613
- Shappee et al. (2014) Shappee B. J., et al., 2014, ApJ, 788, 48
- Shlosman & Begelman (1987) Shlosman I., Begelman M. C., 1987, Nature, 329, 810
- Shull et al. (2012) Shull J. M., Stevans M., Danforth C. W., 2012, ApJ, 752, 162
- Stern et al. (2018) Stern D., et al., 2018, preprint, (arXiv:1805.06920)
- Storchi-Bergmann et al. (1995) Storchi-Bergmann T., Eracleous M., Livio M., Wilson A. S., Filippenko A. V., Halpern J. P., 1995, ApJ, 443, 617
- Tohline & Osterbrock (1976) Tohline J. E., Osterbrock D. E., 1976, ApJ, 210, L117
- Wang et al. (2018) Wang J., Xu D. W., Wei J. Y., 2018, ApJ, 858, 49
- Yang et al. (2017) Yang Q., et al., 2017, preprint, (arXiv:1711.08122)
- Zheng et al. (1997) Zheng W., Kriss G. A., Telfer R. C., Grimes J. P., Davidsen A. F., 1997, ApJ, 475, 469