Utility in Fashion with implicit feedback
Abstract.
Fashion preference is a fuzzy concept that depends on customer taste, prevailing norms in fashion product/style, henceforth used interchangeably, and a customer’s perception of utility or fashionability, yet fashion e-retail relies on algorithmically generated search and recommendation systems that process structured data and images to best match customer preference. Retailers study tastes solely as a function of what sold vs what did not, and take it to represent customer preference. Such explicit modeling, however, belies the underlying user preference, which is a complicated interplay of preference and commercials such as brand, price point, promotions, other sale events, and competitor push/marketing. It is hard to infer a notion of utility or even customer preference by looking at sales data.
In search and recommendation systems for fashion e-retail, customer preference is implicitly derived by user-user similarity or item-item similarity. In this work, we aim to derive a metric that separates the buying preferences of users from the commercials of the merchandise (price, promotions, etc). We extend our earlier work on explicit signals to gauge sellability or preference (Garg et al., 2016) with implicit signals from user behaviour.
1. Introduction
On an e-commerce platform, user’s purchase decision is heavily influenced by price, discounts, brand, product attributes and visual representation of the product. Merchandising bias, hence, is a huge driver for user behaviour, especially in e-retail in India where sales are primarily discount led. It’s been observed (Isabella et al., 2012) that product-sells get exponentially impacted with rise in discounts. Similarly daily rate of sales of products is inversely related to price bands of the competing product. Further users cluster many brands together and see them as similar and hence these brands behave as substitute goods for users. (Isabella et al., 2012) These merchandising parameters pose challenges in understanding the true value (to a customer) in a fashion product, regardless of its commercials.
In this paper, we propose an efficient way to model user sessions to learn this value, or inherent customer preference for fashion products, free of merchandising bias. We use click-stream logs from Myntra - the biggest fashion e-retailer in India to calculate implicit user preferences. The rest of paper is organized as follows. Section 2 lists related works and prior art. In Section 3 we present methods of capturing the user behaviour and we describe the data preparations. In Section 4 we presents the experiments around the proposed approaches which showcase the effectiveness. In Section 5 we show the conclusion on the work and mention the future steps.
2. Related Work
Effective estimation of aesthetics preference of images has several applications in e-retail industry varying from what to display on the search and recommendation to assortment decisions to get the relevant products in road shows. The majority of research in preference estimation is based on labelled data (Murray et al., 2012; Lu et al., 2015) and using image embeddings generated by popular deep learning models (Russakovsky et al., 2015; He et al., 2016; Szegedy et al., 2015; Russakovsky et al., 2015). Research has been done by indirectly inferencing the aesthetics preference of the images from the various other labels from standard datasets such as AVA, CUHK, CUHKPQ, MIRFLICKR (Lu et al., 2014; Murray et al., 2012; Ke et al., 2006; Luo et al., 2011; Müller et al., 2010). Few of them also focus on handcrafted cues such as color space (Nishiyama et al., 2011; O’Donovan et al., 2011), image texture (Datta et al., 2006; Ke et al., 2006), content information (Luo et al., 2011; Dhar et al., 2011) and few have worked using generic image features such as SIFT and Fisher Vector (Marchesotti et al., 2013, 2011). (Zhang et al., 2015) has done work on time aware recommender system using items affinity. (He and McAuley, 2016) models a mixture of time aware and visual aware recommender. All the above methods relies on the labelled data (explicit feedback) or transaction data (implicit feedback) to model the visual aesthetics. labelled data (explicit feedback) is subjective and time dependent. The transaction data (implicit feedback) in an e-retail/commerce setting is generally biased because customer transactions are not only influenced by visual aesthetics of the product but also (to a large extent) due to various merchandising bias such as discounts, brand value, inorganic push on list views etc. (Garg et al., 2016) learns normalized sales numbers using image similarity constraint. Present work look at the problem from a different point of view by modelling the implicit feedback from user behaviour rather than transaction data.
3. Modeling User Behavior
Typically an ecommerce platform monitors and logs all user events such as user searches, clicks, add to cart, filters, orders etc along with the timestamps of such activities. Aggregation of such user logs are called user session. For the purpose of this work a user session in our platform begins when a user arrives on the website or mobile application and ends when we observe a 30 minutes of inactivity. We gather this data from our platform, Myntra, for about 30 million users every month.
3.1. Click based method
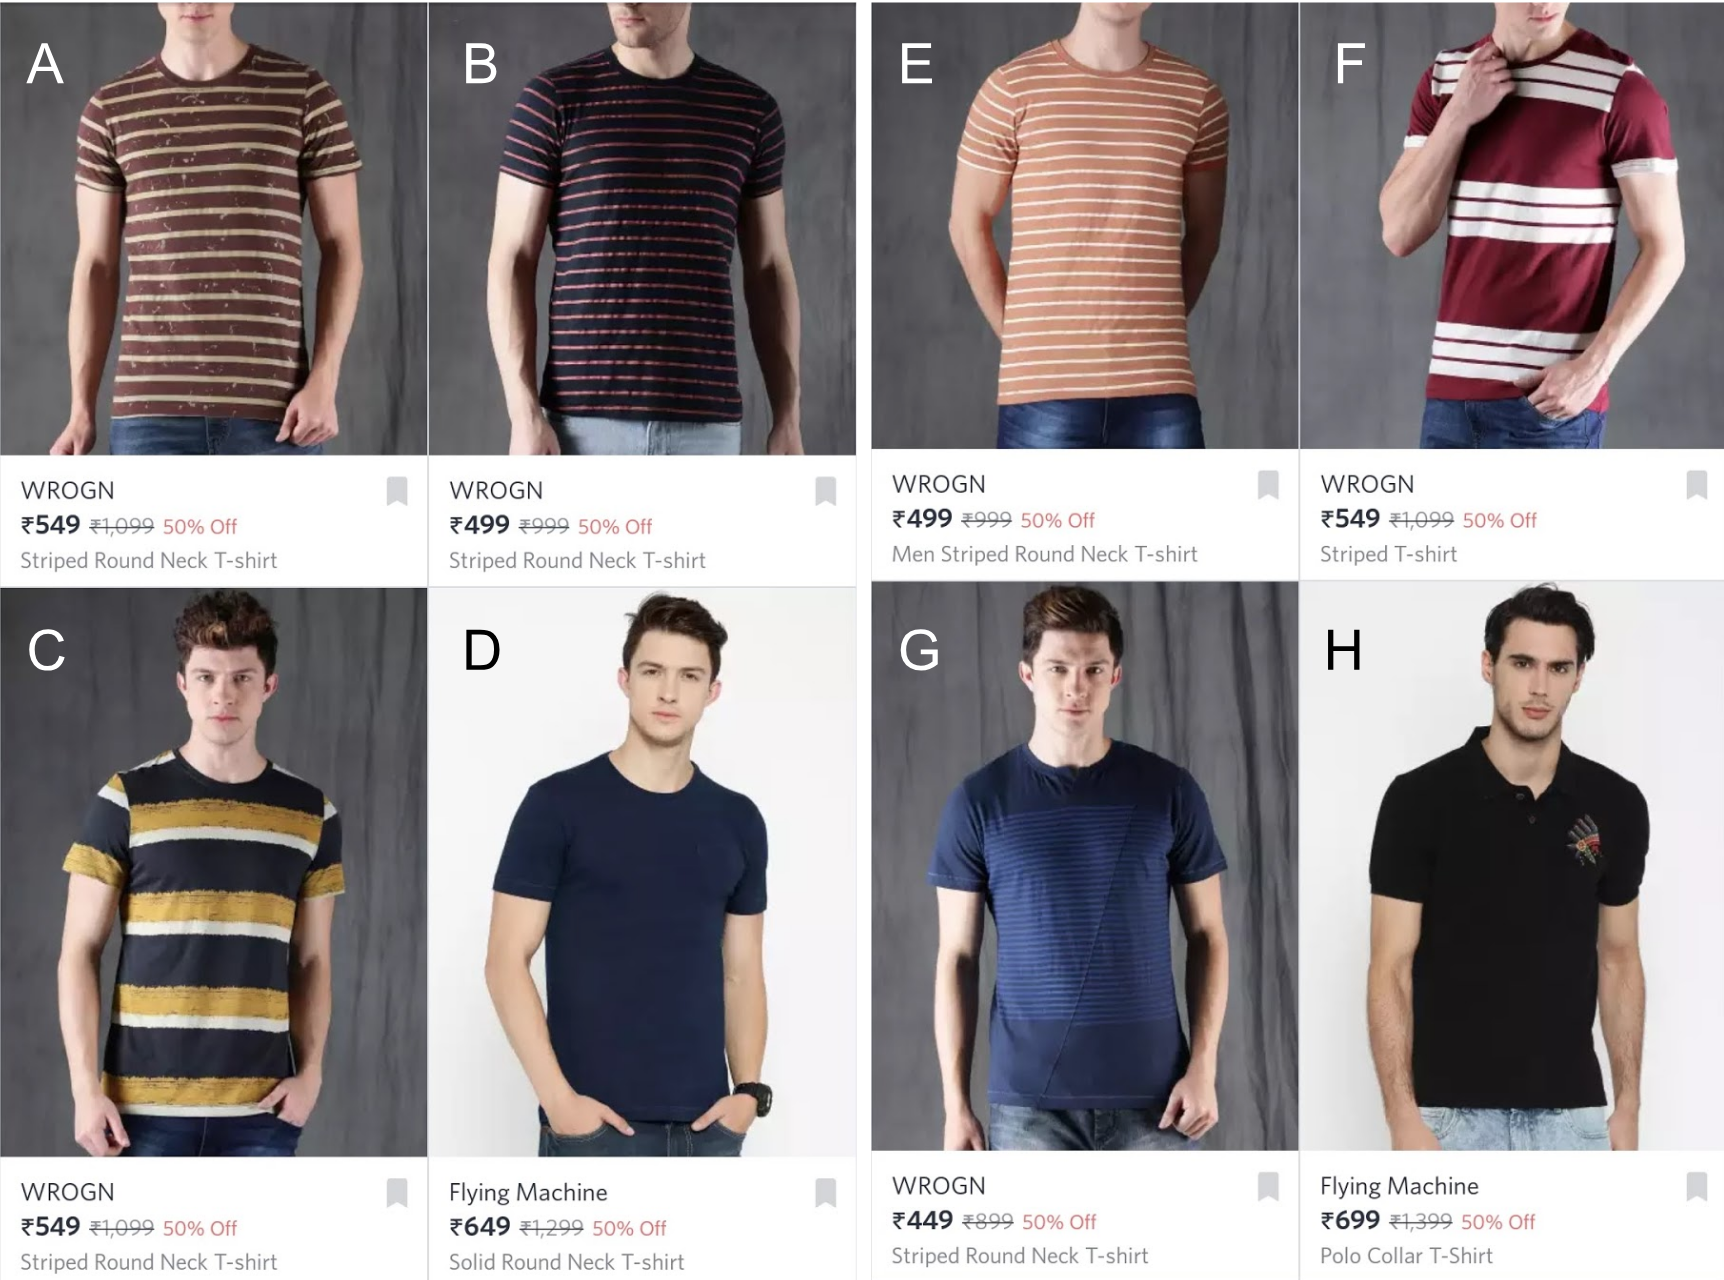
Figure 1 shows a search session where user searched for particular type of product. Let’s see an example where he/she is looking for round neck men t-shirts. Let’s say in this particular search session users ends up clicking product G. Since our mobile application show 4x4 products per panel on screen, this means that user has skipped products from A to F. In other words given that all the products in this search session belong to very similar merchandising parameters user shows a preference towards product G over products from A to F. Since merchandising parameters remains similar the aesthetics preference of product G is the only factor that guides a user to click on it. We categorized all such preferred products as s1 and all skipped products as s2. Products shown after the selected product G are not taken into consideration (products H and onwards in this example). Thus this user-session generates a list (L) containing tuples/pair (s1, s2): [(G, A), (G, B), (G, C) …(G, F)]. Before finalizing these tuples/pair, we explicitly apply an additional layer of filtering that ensures that all the products belong to very similar brands, similar average selling prices, and similar discounts. This essentially ensures the implicit normalization for the merchandising. E.g. product D was selling at about 44% higher price than that of product G. Our additional layer of filter remove (G, D) pair form list L.
3.2. Data preparation
We scanned through the user session as described above for a given time range and for men tshirts. We get approximately 4 millions such (s1, s2) pairs from all our unsigned or signed in users. We sum the number of times (s1, s2) occurred together and get a list of style pairs in the format where
for all where i is limited by number of user sessions , i = 1…N.
if is negative then it signifies that was preferred by larger number of users rather than and we simply switch the tuple values as
About half of the pairs occurred only once ( is 1) and about 98% of them occurred less than 40 times ( ¡ 40). This leads us to about 200k tuples with counts more than 40 containing about 11k unique styles. We also got the styles independent transaction numbers.
We compared these (s1, s2) tuples in terms of their independent transaction on our platform. We found that if the product s1 was preferred over s2 in terms of clicks in a given search session then that product approximately 70% of times was more sold on than . We observed similar correlations for AddToCart of these products. AddToCart is a strong signal from user because it signifies that users are interested in these products but have not purchased them so far. It’s important to note that tuple gets generated if they both occur in same search session. But and ś purchase number are independent of the fact that they appear in same user session or not.
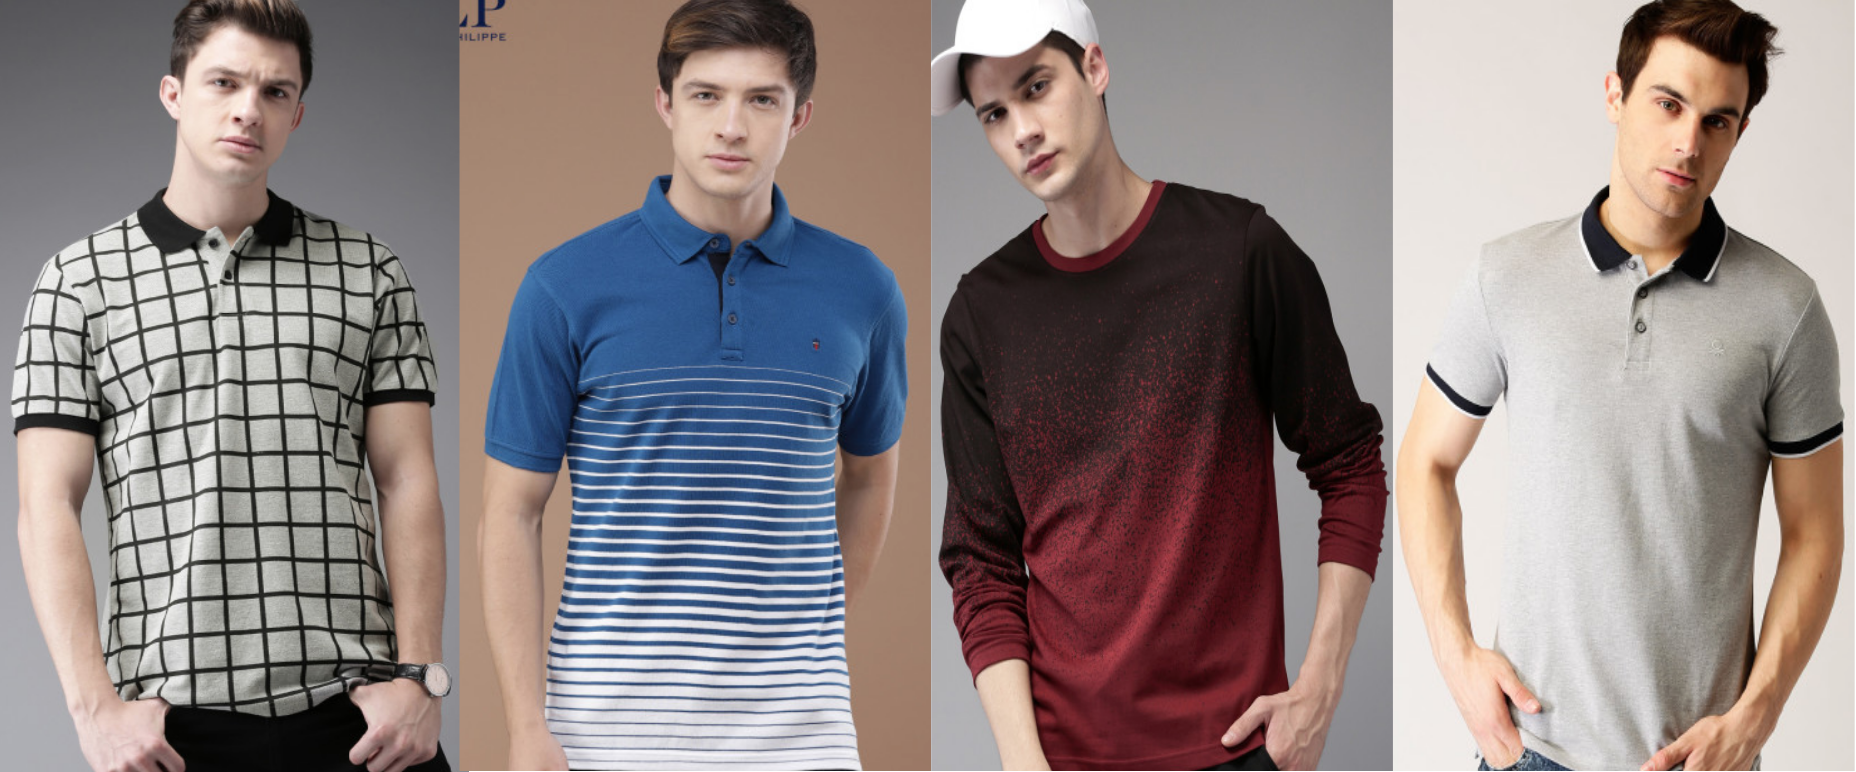
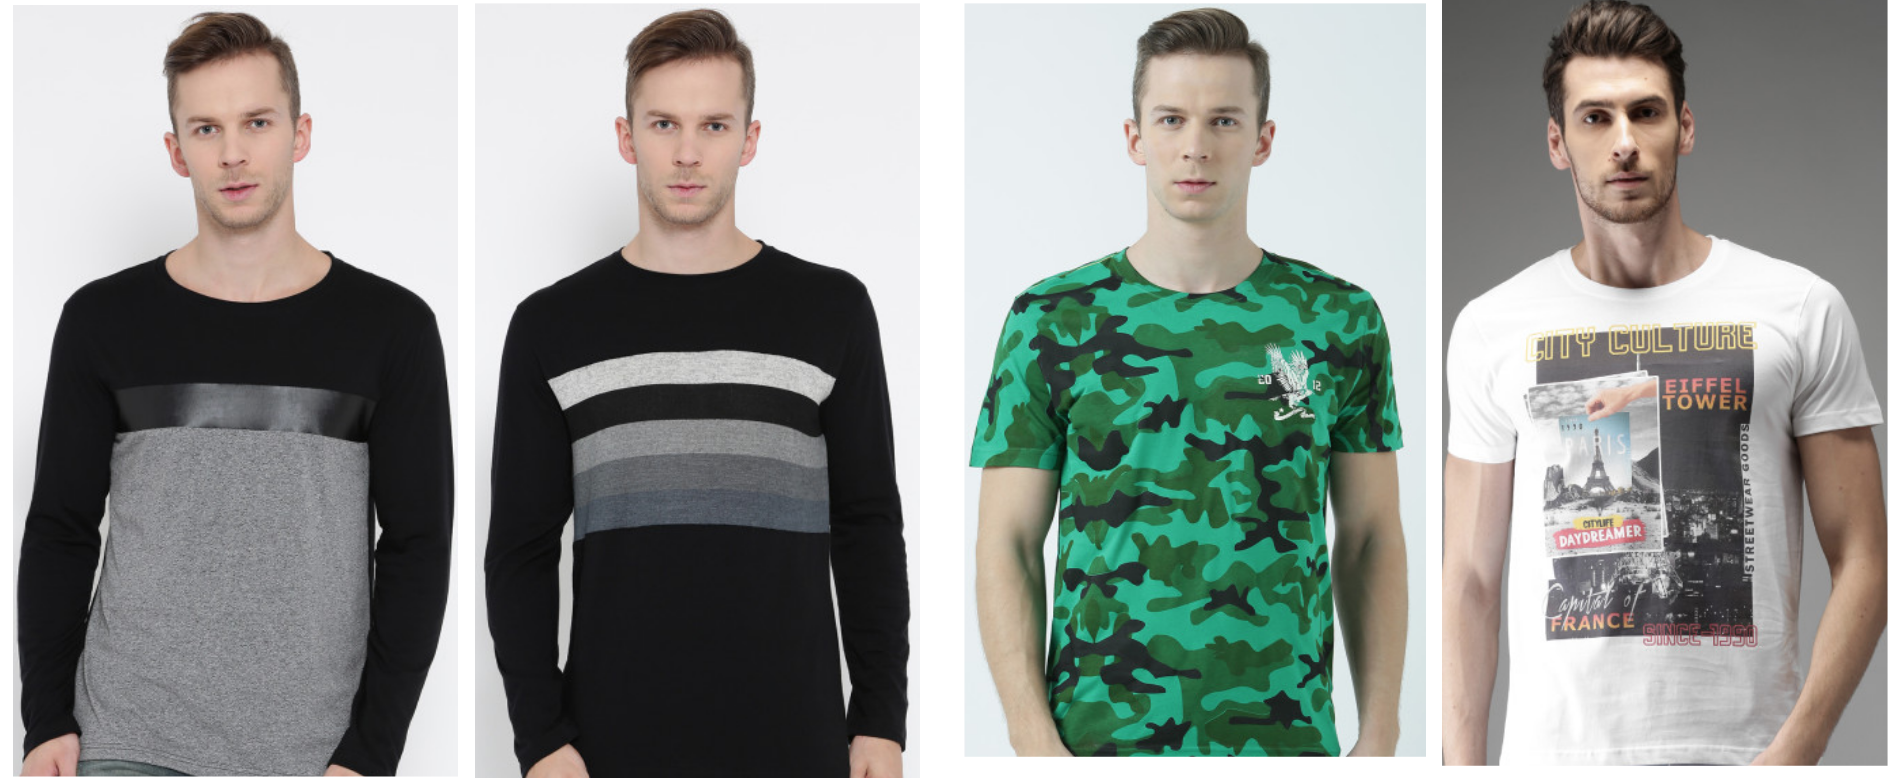
Figure 2 shows examples of preferred (row 1) and ignored items (row 2) generated using click data. These examples corroborate customer preference for polo necks over round necks.
We also collected user session for a given time range and for women kurtas (an upper garment traditionally worn in Indian subcontinent) and found similar correlations with their independent transaction on our platform.
4. Experiments
From pairwise item we generated ranked list of items in the above data sets. We take top 20% of those product and assign a positive class label and similarly bottom 20% gets a label of negative class.
Tables 1 shows that user-session based modelling of customer clicks which on styles which belong to similar merchandise clearly correlates with business metrics. For both classes of products (preferred and not) While the average number of impressions remains very close (approx 1% difference), the Click-through-rate (CTR) nearly doubles in the preferred (positive) class of products. Similarly rate of sales (Quantity sold per unit of time) and revenue per unit impressions show a very substantial differences. The further support our claim on the method of user preference modelling. Next we describe few experiments which suggest that this type of modelling can be learned for inference purposes.
| Metric | Positive labelled | Negative labelled |
|---|---|---|
| Impressions | 410493 | 390113 |
| CTR | 3.9% | 2.1% |
| 1K-revenue/Impressions | 0.412 | 0.211 |
| rate of sale | 5.88 | 1.61 |
4.1. Deep Neural Network Model based image embeddings in fashion
For the purpose of the work presented here we have used an Image-net DNN architecture on our catalogue images (fashion catalogue at Myntra): Vgg16 (Simonyan and Zisserman, 2014) containing about 47 million trainable parameters, reaching an ILSVRC top-5 error rate of 6.8%. We use a pre-trained VGG16 model implemented in caffe(Jia et al., 2014) and tap in the penultimate layer to get 4096 features vector representation of each product image after running a proprietary (vis, [n. d.]) bounding algorithm on it. We then use PCA to get 300 dimensional feature vector representation of the product. These 300 dimensional features capture approximately 88% of total variance.
As mentioned in the (Fu et al., 2016) features based on a pre-trained CNN (such as VGG16) are able to capture most discriminating content of a catalog images. A more complex Deep-CNNs or fine tuning on above architectures are left for future work.
4.2. Classifiers
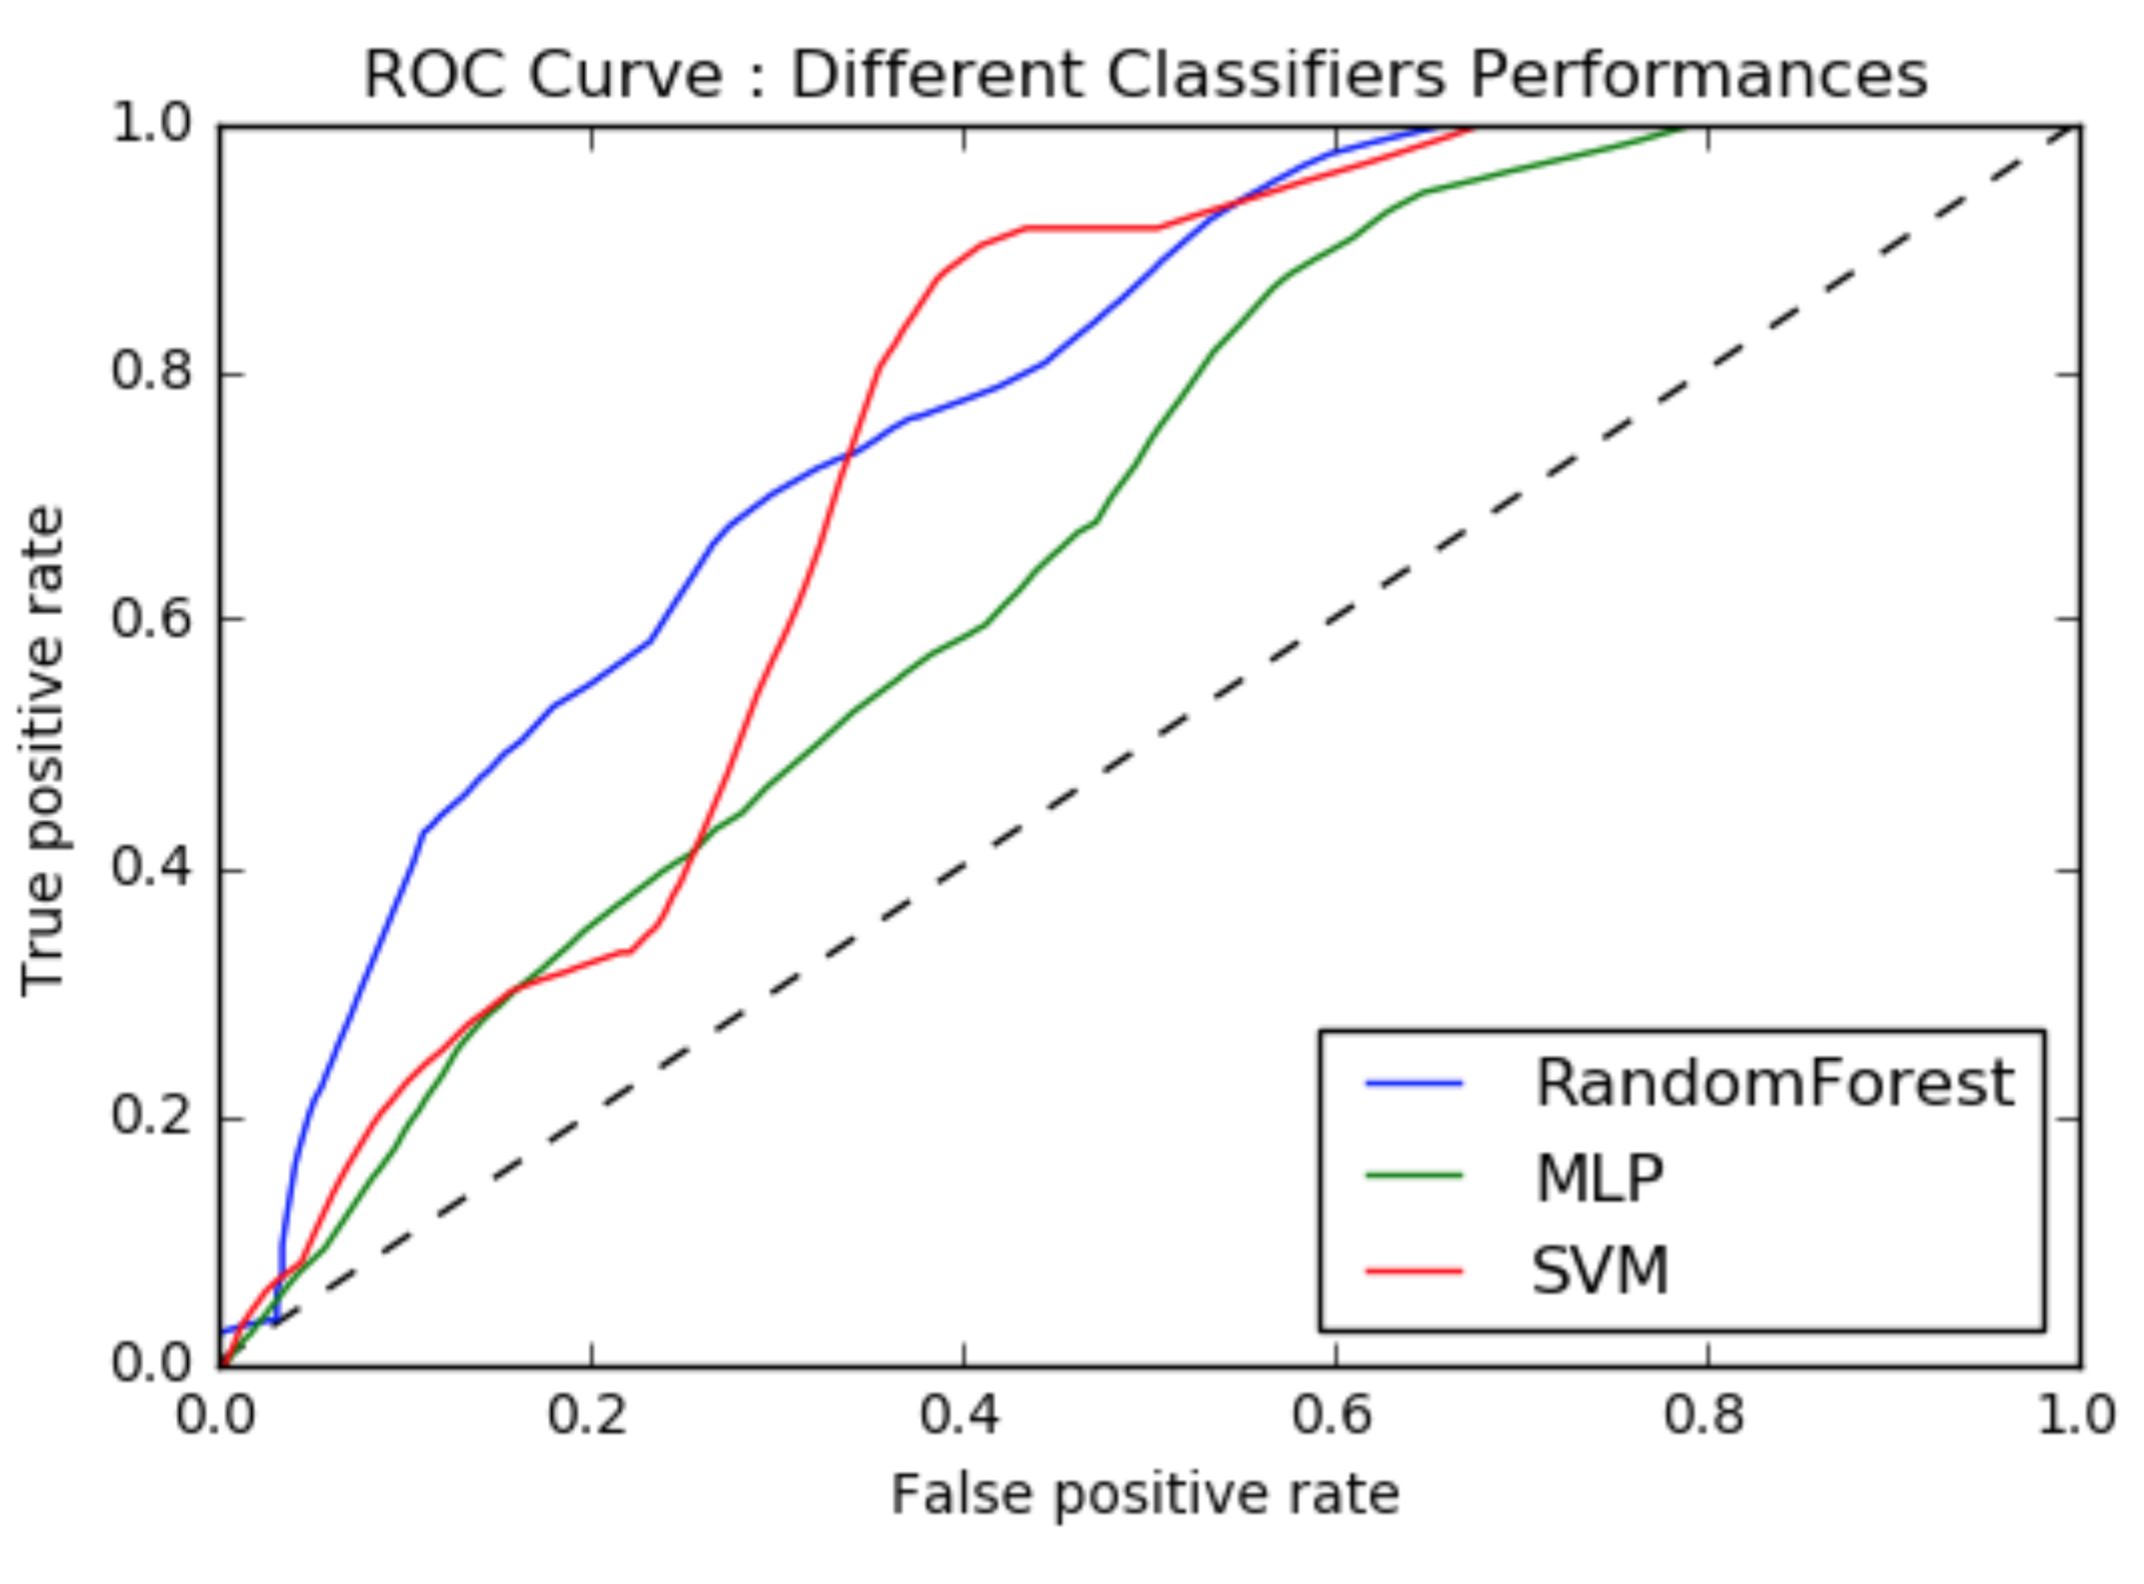
We trained multiple binary (Multilayer Perceptron (MLP), RandomForestClassifier and SVM) classifiers on features described above to discriminate between articles in both buckets (preferred vs non-preferred).
Figures 3 shows performance of various classifiers. Using these characteristic curves along with the accuracy and precision numbers we concluded that for the given feature representation it makes more sense to use ensemble model (Random Forest) as a classifier.
As described in the data preparation step we have 201666 pairs of t-shirts styles and 52082 pairs of kurtas for the classification. We divide each of the two data sets in 75% training and 12.5% each in test and validation sets. Table 2 shows the total exact number of data points for Training, Testing and Validation sets.
| Article Type | train size | validation size | test size |
|---|---|---|---|
| T-shirts | 151250 | 25208 | 25208 |
| Kurtas | 41666 | 5208 | 5208 |
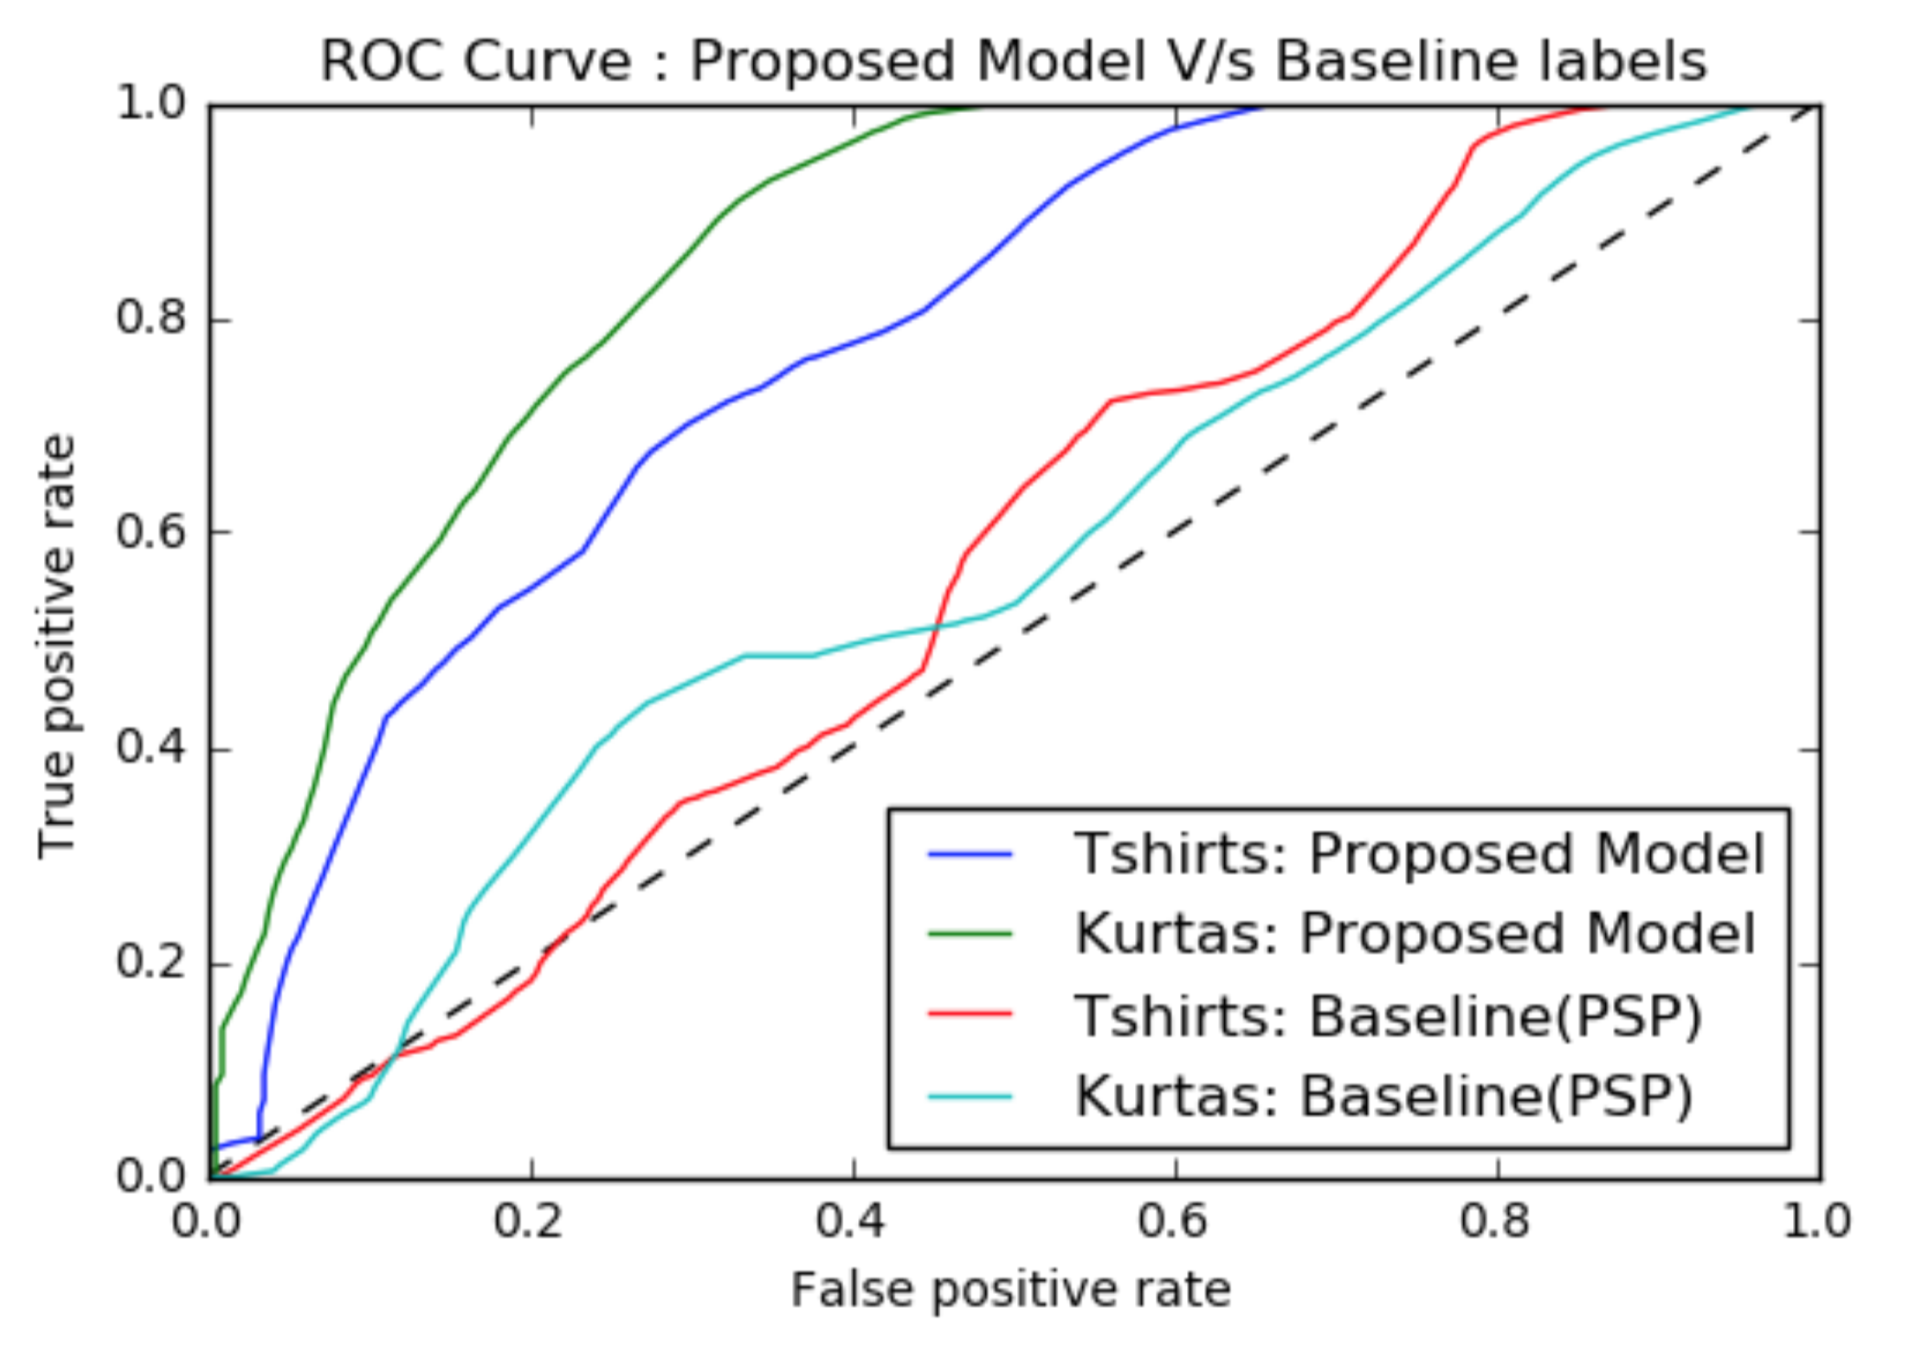
Table 3 and Figures 4 shows implicit user behaviour modelling as compared to the baseline PSP modelling. (Garg et al., 2016) for Men tshirts and Women Kurtas. Table 3 show significant jump in precision number from 56% to about 64%.
| Article | Model | Acc | AUC | Prec | Rec |
|---|---|---|---|---|---|
| T-shirts | Implicit Feedback | 65% | 0.66 | 64% | 47% |
| Explicit feedback((Garg et al., 2016)) | 62% | 0.61 | 56% | 47% | |
| Kurtas | Implicit Feedback | 66% | 0.68 | 63% | 48% |
| Explicit feedback((Garg et al., 2016)) | 63% | 0.64 | 56% | 44% |
4.3. Conclusion
In this paper, We present an approach to model user sessions using
user clicks to learn user preferences for fashion product. Our approach implicitly normalizes for merchandising factors such as brand value, price, discounts, etc, to isolate the significance of fashion content or utility . We show that implicit data correlates well with business metrics such as CTR and product sales. We extract image features from pre-trained VGGnet to discriminate between highly clicked vs non clicked (non preferred) products. With experiments, we show that this method is able to clearly determine sellability with a significant overlap, and is therefore a good way to determine fashion preferences.
References
- (1)
- vis ([n. d.]) [n. d.]. In https://www.visenze.com/.
- Datta et al. (2006) Ritendra Datta, Dhiraj Joshi, Jia Li, and James Z Wang. 2006. Studying aesthetics in photographic images using a computational approach. In European Conference on Computer Vision. Springer, 288–301.
- Dhar et al. (2011) Sagnik Dhar, Vicente Ordonez, and Tamara L Berg. 2011. High level describable attributes for predicting aesthetics and interestingness. In Computer Vision and Pattern Recognition (CVPR), 2011 IEEE Conference on. IEEE, 1657–1664.
- Fu et al. (2016) Ruigang Fu, Biao Li, Yinghui Gao, and Ping Wang. 2016. Content-based image retrieval based on CNN and SVM. In Computer and Communications (ICCC), 2016 2nd IEEE International Conference on. IEEE, 638–642.
- Garg et al. (2016) Vikram Garg, Rajdeep H Banerjee, KR Anoop, T Sreenivas, and Deepak Warrier. 2016. Sales Potential: Modelling Sellability of Visual Aesthetics of a Fashion Product. (2016).
- He et al. (2016) Kaiming He, Xiangyu Zhang, Shaoqing Ren, and Jian Sun. 2016. Deep residual learning for image recognition. In Proceedings of the IEEE conference on computer vision and pattern recognition. 770–778.
- He and McAuley (2016) Ruining He and Julian McAuley. 2016. Ups and downs: Modeling the visual evolution of fashion trends with one-class collaborative filtering. In proceedings of the 25th international conference on world wide web. International World Wide Web Conferences Steering Committee, 507–517.
- Isabella et al. (2012) Giuliana Isabella, Alexandre Ierulo Pozzani, Vinicios Anlee Chen, and Murillo Buissa Perfi Gomes. 2012. Influence of discount price announcements on consumer’s behavior. Revista de Administração de Empresas 52, 6 (2012), 657–671.
- Jia et al. (2014) Yangqing Jia, Evan Shelhamer, Jeff Donahue, Sergey Karayev, Jonathan Long, Ross Girshick, Sergio Guadarrama, and Trevor Darrell. 2014. Caffe: Convolutional architecture for fast feature embedding. In Proceedings of the 22nd ACM international conference on Multimedia. ACM, 675–678.
- Ke et al. (2006) Yan Ke, Xiaoou Tang, and Feng Jing. 2006. The design of high-level features for photo quality assessment. In Computer Vision and Pattern Recognition, 2006 IEEE Computer Society Conference on, Vol. 1. IEEE, 419–426.
- Lu et al. (2014) Xin Lu, Zhe Lin, Hailin Jin, Jianchao Yang, and James Z Wang. 2014. Rapid: Rating pictorial aesthetics using deep learning. In Proceedings of the 22nd ACM international conference on Multimedia. ACM, 457–466.
- Lu et al. (2015) Xin Lu, Zhe Lin, Xiaohui Shen, Radomir Mech, and James Z Wang. 2015. Deep multi-patch aggregation network for image style, aesthetics, and quality estimation. In Proceedings of the IEEE International Conference on Computer Vision. 990–998.
- Luo et al. (2011) Wei Luo, Xiaogang Wang, and Xiaoou Tang. 2011. Content-based photo quality assessment. In Computer Vision (ICCV), 2011 IEEE International Conference on. IEEE, 2206–2213.
- Marchesotti et al. (2011) Luca Marchesotti, Florent Perronnin, Diane Larlus, and Gabriela Csurka. 2011. Assessing the aesthetic quality of photographs using generic image descriptors. In Computer Vision (ICCV), 2011 IEEE International Conference on. IEEE, 1784–1791.
- Marchesotti et al. (2013) Luca Marchesotti, Florent Perronnin, and France Meylan. 2013. Learning beautiful (and ugly) attributes.. In BMVC, Vol. 7. 1–11.
- Müller et al. (2010) Henning Müller, Paul Clough, Thomas Deselaers, Barbara Caputo, and Image CLEF. 2010. Experimental evaluation in visual information retrieval. The Information Retrieval Series 32 (2010), 1–554.
- Murray et al. (2012) Naila Murray, Luca Marchesotti, and Florent Perronnin. 2012. AVA: A large-scale database for aesthetic visual analysis. In Computer Vision and Pattern Recognition (CVPR), 2012 IEEE Conference on. IEEE, 2408–2415.
- Nishiyama et al. (2011) Masashi Nishiyama, Takahiro Okabe, Imari Sato, and Yoichi Sato. 2011. Aesthetic quality classification of photographs based on color harmony. In Computer Vision and Pattern Recognition (CVPR), 2011 IEEE Conference on. IEEE, 33–40.
- O’Donovan et al. (2011) Peter O’Donovan, Aseem Agarwala, and Aaron Hertzmann. 2011. Color compatibility from large datasets. In ACM Transactions on Graphics (TOG), Vol. 30. ACM, 63.
- Russakovsky et al. (2015) Olga Russakovsky, Jia Deng, Hao Su, Jonathan Krause, Sanjeev Satheesh, Sean Ma, Zhiheng Huang, Andrej Karpathy, Aditya Khosla, Michael Bernstein, et al. 2015. Imagenet large scale visual recognition challenge. International Journal of Computer Vision 115, 3 (2015), 211–252.
- Simonyan and Zisserman (2014) Karen Simonyan and Andrew Zisserman. 2014. Very deep convolutional networks for large-scale image recognition. arXiv preprint arXiv:1409.1556 (2014).
- Szegedy et al. (2015) Christian Szegedy, Wei Liu, Yangqing Jia, Pierre Sermanet, Scott Reed, Dragomir Anguelov, Dumitru Erhan, Vincent Vanhoucke, Andrew Rabinovich, et al. 2015. Going deeper with convolutions. Cvpr.
- Zhang et al. (2015) Yongfeng Zhang, Min Zhang, Yi Zhang, Guokun Lai, Yiqun Liu, Honghui Zhang, and Shaoping Ma. 2015. Daily-aware personalized recommendation based on feature-level time series analysis. In Proceedings of the 24th international conference on world wide web. International World Wide Web Conferences Steering Committee, 1373–1383.