Mass modelling of a superthin galaxy, FGC1540
Abstract
We present high resolution Hi 21cm Giant Meterwave Radio Telescope (GMRT) observations of the superthin galaxy FGC1540 with a spatial resolution of 10′′ 8′′ and a spectral resolution of 1.73 kms-1 and an rms noise of 0.9 mJy per beam. We obtain its rotation curve as well as deprojected radial Hi surface density profile by fitting a 3-dimensional tilted ring model directly to the Hi data cubes by using the publicly-available software, Fully Automated Tirrific (FAT). We also present the rotation curve of FGC1540 derived from its optical spectroscopy study using the 6-m BTA telescope of the Special Astrophysical Observatory of the Russian Academy of Sciences. We use the rotation curve, the Hi surface density profile together with Spitzer 3.6 m and the SDSS –band data to construct the mass models for FGC1540. We find that both the Pseudo-isothermal (PIS), as well as Navarro-Frenk-White (NFW) dark matter (DM) halos, fit the observed rotation curve equally well. The PIS model indicates a compact dark matter halo ( < 2), with the best-fitting core radius () approximately half the exponential stellar disc scale length (), which is in agreement with the mass models of superthin galaxies studied earlier in the literature. Since the vertical thickness of the galactic stellar disc is determined by a balance between the net gravitational field and the velocity dispersion in the vertical direction, the compact dark matter halo may be primarily responsible in regulating the superthin vertical structure of the stellar disc in FGC1540 as was found in case of the superthin galaxy UGC7321.
keywords:
galaxies: individual: FGC1540– galaxies: kinematics and dynamics– galaxies: spiral– galaxies: structure.1 Introduction
Superthin galaxies are galaxies which when viewed edge-on exhibit highly flattened stellar discs with large disc axial ratios (/ 10) (Goad & Roberts, 1981; Karachentsev et al., 1993, 1999). These galaxies are late-type and gas-rich low surface brightness (LSB) galaxies with little or no bulge component (see Kautsch, 2009a, for a review). These features suggest that these galaxies are some of the least-evolved galaxies and are, therefore, the ideal test-beds to study the early stages of quiescent disk galaxy evolution, and to constrain models of galaxy formation evolution.
Superthin galaxies are mostly found in the group and isolated environments (Kautsch et al., 2009). It is now well-known that galaxy mergers are common in groups, and should trigger the formation of central spheroids or bulges in galactic discs; therefore theoretical models predict that not many simple discs should survive the cosmological evolution of galaxies (Naab & Burkert, 2003; D’Onghia et al., 2006; Khochfar, 2009). Despite this, pure discs do exist and, in fact, constitute a significant fraction ( 15-18 percent) of the observed disc galaxy population (Kautsch, 2009b; Kautsch et al., 2006), a fact not well-understood within the framework of the current cosmological paradigm of hierarchical galaxy formation (Kautsch, 2009a). The survival of a superthin vertical structure in some of these pure stellar discs despite the expected heating by stellar bars and spiral arms and other mechanisms relevant for galactic secular evolution is puzzling.
A viable explanation for the existence of superthin discs could be that their discs are exceptionally stable. Theoretical models predict that superthin galaxies must be hosted in massive dark matter haloes to stabilize their discs against perturbations (Zasov et al., 1991; Gerritsen & de Blok, 1999) and, in fact, a recent study revealed a correlation between the thickness of stellar discs and the relative mass of the dark matter halo. (Zasov et al., 2002; Kregel et al., 2005; Mosenkov et al., 2010). Banerjee et al. (2010) found that UGC7321, a prototypical superthin galaxy, (see e.g., Matthews et al., 1999; Matthews, 2000; Matthews & Wood, 2001; Uson & Matthews, 2003) has a dense and compact dark matter halo with / < 2, where is the core radius of the Pseudo Isothermal (PIS) dark matter halo and is the exponential stellar disc scale length (See also O’Brien et al., 2010). This is in contrast to the high surface brightness (HSB) galaxies, for which the core radius is 3-4 times the exponential stellar disc scale length (Gentile et al., 2004; Narayan et al., 2005; Banerjee & Jog, 2008). Banerjee & Jog (2013) dynamically modelled the vertical thickness of the stellar disc of UGC7321. The vertical thickness of the stellar disc is determined by the balance between the vertical gravitational force and the pressure. They found that while the vertical force field due to the gas self-gravity does constrain the stellar disc thickness, it is the compact dark matter halo which strongly regulates the mean distribution of stars in the vertical direction in low-luminosity bulgeless galaxies, and is primarily responsible for the stellar disc to be superthin. In addition, Ghosh & Jog (2014) also found that gravitational instabilities in UGC7321 are suppressed by its dark matter halo. In fact, using linear disc stability analysis studies, Garg & Banerjee (2017) indicated that the dark matter halo is crucial for stabilizing the disc in low surface brightness galaxies in general. Thus, the compact nature of the dark matter halo predominantly determines the disc vertical structure, which may have important implications for the early evolution of galaxies.
Besides UGC7321, only two other superthin galaxies have been studied in detail: IC5249 (van der Kruit et al., 2001; Banerjee & Bapat, 2017) and IC2233 (Banerjee & Bapat, 2017). In this paper, we study FGC1540, a proto-typical superthin galaxy in detail. We present the results of Hi 21cm radio-synthesis observations from the Giant Meterwave Radio Telescope (GMRT) of FGC1540; we also model its rotation curve and de-projected Hi surface density and finally construct the mass models using photometrically calibrated , , and band images from the SDSS Data Access Server and Spitzer 3.6 m data in conjunction with the Hi data.
2 Hi Observations Data analysis
The galaxy FGC1540 was observed with the GMRT over multiple sessions. The observations were carried out on 25, 26 April, 29 August, 09 September, 06 and 08 April in 2013 and a total of 32 hours were spent on the source. The parameters of the GMRT observations are summarized in Table 1. The data was processed using the standard tasks in AIPS package. Bad visibility points for each scan were flagged out to begin with, following which the data was calibrated. The task CVEL was performed on all the calibrated data sets in order to correct for the Doppler shift due to earth’s motion and then the data sets on all runs were combined using the task DBCON . The task UVSUB was then used to subtract the continuum emission by interpolating from the line free channels in the uv plane. After the continuum subtraction, the data cubes were made at various resolutions using the task IMAGR. The integrated Hi flux was measured from the data cube by using the Source Finding Application (SoFiA; Serra et al. (2015)).
| Parameters | Value |
|---|---|
| RA(2000) | 13h02m08.1s |
| Declination(2000) | +58∘42′05′′ |
| Date of observations | 25 and 26 Apr, 29 Aug, 09 Sep, 06 and 08 Nov, 2013 |
| Flux calibrator | 3C147, 3C286 |
| Phase calibrator | 1400+621 |
| Central velocity(heliocentric) | 670 km s-1 |
| Time on source | 32h |
| Total bandwidth | 4.0 MHz |
| Number of channels | 512 |
| Velocity resolution | 1.73 km s-1 |
| FWHM of synthesized beam | |
| RMS noise per channel | 0.9 mJy |
3 Optical IR Photometry
3.1 SDSS Data
| SDSS Band | ||
| (mag) | (mag arcsec-2) | |
| Notes: The total magnitude, , and the central surface brightness, , are not corrected for the foreground extinction. | ||
The photometrically calibrated Sloan Digital Sky Survey (SDSS) frames for the galaxy FGC 1540 in the , , and bands were taken from the SDSS Data Access Server (Ahn et al., 2012). Background subtraction was performed in all the , , and frames. For this purpose, all the stars and other objects (including FGC 1540) and their surroundings were masked. The regions for masking were chosen based on 3 deviation from the median value of the frame. Regions around the galaxy were masked manually. For every frame, the background was approximated with a second order two-dimensional polynomial and was subtracted.
Elliptical apertures are not the ideal fits to the galaxy isophotes as the galaxy FGC 1540 is a nearly edge-on galaxy. Hence, the total magnitude was estimated by integrating the light in a rectangular box, the size of the box being chosen in such a way that the growth curves reach its asymptotic value near the borders of the box. The measured magnitudes and the central surface brightness in , and –bands are given in Table 2. This galaxy region was also used for fitting the vertical and radial photometric profiles.
The data were found to be consistent with a model comprising a thick and a thin disc, each with a profile in the vertical and an profile in the radial direction. Besides, the disc thickness was found not to vary significantly as a function of galactocentric radius . Integrated along the line-of-sight to fit the observed intensity profiles of edge-on systems like FGC1540, the above model results in an intensity profile given by (), where is the modified Bessel function of the second kind, the galactocentric radius, the exponential disc scale length, the vertical scale height and is the intensity at =0 and =0 (van der Kruit & Searle, 1981). The commonly used sech2() model gives a worse fit than the sech() in the vertical direction. The sech() model was proposed by van der Kruit (1988) as a model intermediate between the isothermal and exponential models. The star-forming regions from the middle plane were excluded to minimize effects due to dust extinction; only regions located 12 above and below the middle plane were used to fit the radial profile. The Galactic (Milky Way) dust extinction (Schlafly & Finkbeiner, 2011) was taken into account for the derivation of model-dependent photometric parameters. In general, superthin galaxies suffer very little from dust extinction in spite of their edge-on geometry (see e.g. Matthews et al., 1999). The dust line in edge-on galaxies becomes visible if the rotation velocity of a galaxy exceeds 120 km s-1 (Dalcanton et al., 2004) and the maximum rotation velocity of FGC 1540 is 90 km s-1. Hence, the internal dust extinction in FGC1540 is expected to be low and was not corrected for.
The best-fitting parameters of our model of the stellar disc are given in Table 3. The mass-to-light ratio () was calculated using the (-) color of the discs following Zibetti et al. (2009) and was found to be 0.54 for the galaxy FGC1540. Our results show that the thin disc has a scale length of 1.29 0.01 kpc, a scale height of 0.185 0.002 kpc and a total mass of (1.1 0.07) 108 M⊙. The thick disc has a scale length of 1.29 0.01 kpc, a scale height of 0.675 0.035 kpc and a total mass of (0.87 0.15) 108 M⊙. The total stellar mass of the galaxy is 1.97 108 M⊙. The absolute B-band magnitude was calculated from the magnitudes at and –band using the Lupton’s transformation assuming a distance of 11 Mpc. The absolute B-band magnitude (), blue luminosity (), and the ratio of Hi mass to the blue luminosity (/) are shown in Table 4. The errors on absolute magnitude are dominated by distance uncertainty ( 10 ).
3.2 Spitzer IRAC 3.6 m
One of the main uncertainties in constructing mass models is the conversion from stellar luminosity profiles to stellar mass profiles, using a mass-to-light ratio () as determined from stellar population synthesis models (See e.g. Bell & de Jong, 2001). The uncertainties in the derivation of are much less in the mid-infrared compared to the optical case as the latter is dominated by young stellar population, recent star formation events and the effects of dust. Therefore, the Spitzer IRAC 3.6 m images serve as a better tracer of the underlying stellar population.
The 2-dimensional structural decomposition of the Spitzer 3.6 m intensity profiles was already available in the literature (Salo et al., 2015). FGC1540 was found to be consistent with a model consisting of a superposition of a thin disc and a thick disc, with each of the discs having an exponential radial profile and a sech2 vertical profile. The surface brightness profiles were converted to mass density profiles assuming a mass-to-light ratio of 0.35, the average value as calculated for a sample of superthin galaxies (van der Kruit et al., 2001; Banerjee & Bapat, 2017). We find that the thin disc has a central density of 8.16 M⊙ pc-2, has a scale length of 0.54 kpc and a scale height of 0.152 kpc; the thick disc has a central density of 3.24 M⊙ pc-2, has a scale length of 1.85 kpc and a scale height of 0.43 kpc. The total stellar mass obtained from the Spitzer 3.6 m intensity profiles is 0.95 108 M⊙, which is 2 times lower as compared to the estimate from the SDSS –band observations. The structural parameters derived using the SDSS –band and the Spitzer 3.6 m data are summarized in Table 3.
| Band | disc | ||||
| 3.6 m | thin disc | 21.39 | 0.54 | 0.152 | 0.15 |
| thick disc | 22.23 | 1.85 | 0.43 | 0.80 | |
| SDSS –band | thin disc | 20.60 | 1.29 | 0.185 | 1.10 |
| thick disc | 21.67 | 1.29 | 0.675 | 0.87 | |
| Notes: is face-on surface brightness in mag arcsec-2, | |||||
| is the scale length in kpc, is the scale height in kpc and | |||||
| is the stellar mass in units of 108 M⊙. | |||||
3.3 Optical spectroscopy
The spectroscopic observations of FGC 1540 were obtained on 1st August 2017 with the 6-m BTA telescope at the Special Astrophysical Observatory of the Russian Academy of Sciences with the multi-mode focal reducer SCORPIO using the VPHG1800R grism along with the CCD detector EEV CCD42-40. A 1′′-wide slit was oriented along the galaxy’s major axis. This gives the reciprocal dispersion about 0.52 Å/pix in range from 6100–7100 Å and FWHM of 2.5 Å. The total exposure time was 1200 sec and the seeing was 1.5 arcsec. The image scale is 0.357 arcsec per pixel along a slit. The standard reduction of the spectra including bias subtraction, wavelength calibration, and redshifts measurements was performed using ESO MIDAS system for image processing with the context LONG.
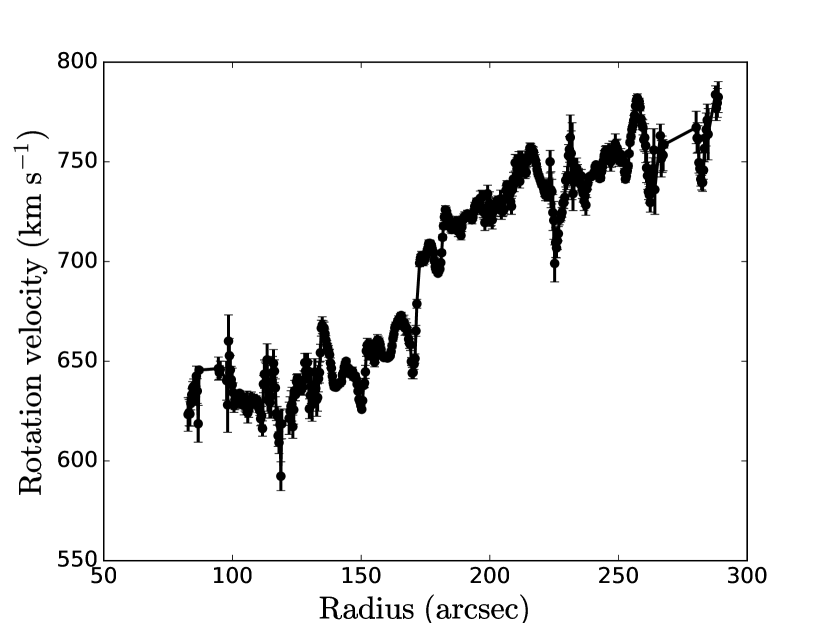
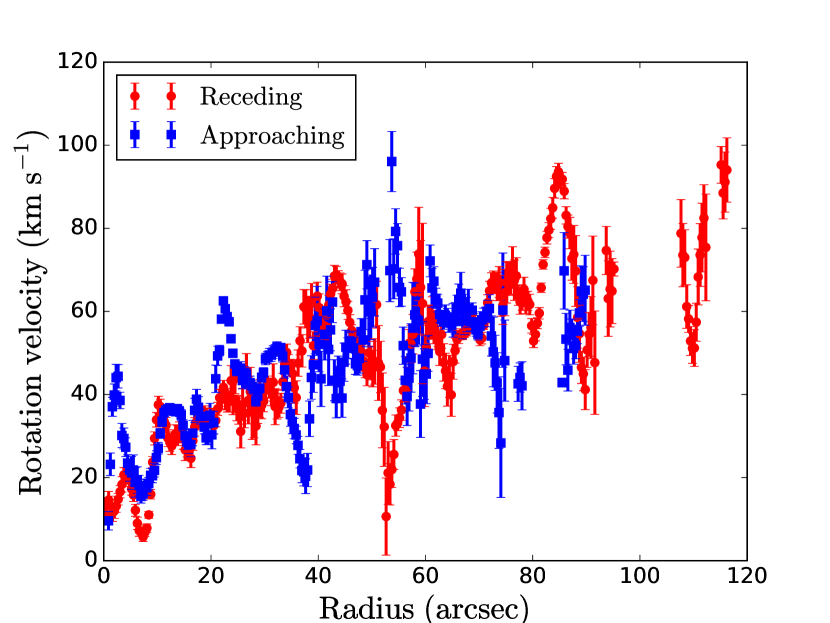
The typical error of the velocity measurement is 3.5 km s-1. Fig 1 (a) shows the rotation curve along the galaxy major axis. Fig 1 (b) shows the rotation curve derived for the approaching half (shown by filled blue squares) and for the receding half (shown by open red circles). The dynamical center of the galaxy is found by minimizing the scatter between receding and approaching wings of the rotation curve. The systemic velocity was found to be 689 km s-1. The rotation curve shows drops and rises with amplitude up to 40–50 km s-1. We interpret this as follows. The optical spectrum is dominated by emission from star forming regions, which are likely to be randomly distributed along the line of sight. Since for edge on galaxies, the mapping between the projected and true galactocentric distance is degenerate, this random distribution could lead to the observed features in the derived rotation curve. We do not expect the rotation curve to be affected by dust, both because, as discussed above, superthin galaxies generally have little dust, and also because the weak 22 m emission from FGC1540 indicates that the amount of dust (with temperature of 70–100 K) is quite small in FGC1540.
| Properties | Value |
|---|---|
| Hubble type | Sd |
| Distancea | 11 Mpc |
| Systemic velocity b | 670 km s-1 |
| c | -16.040.19 mag |
| Hi Integrated flux | 31.53.1 Jy km s-1 |
| Maximum velocity | 90 km s-1 |
| Position angleb | 31∘ 1∘ |
| Inclinationb | 87∘ 1.5∘ |
| d | 7.47 |
| (9 2) 108 M⊙ | |
| 2.23 108 L⊙ | |
| / | 4.1 |
| Notes: a Distance was calculated from the Hubble law. | |
| b Systemic velocity, Position angle, and inclination angle were | |
| estimated from Hi kinematics using FAT software. | |
| c Absolute magnitudes at -band was calculated from the | |
| brightness in bands using Lupton transformation. | |
| d Axial ratio measured at -band. | |
4 Hi distribution kinematics
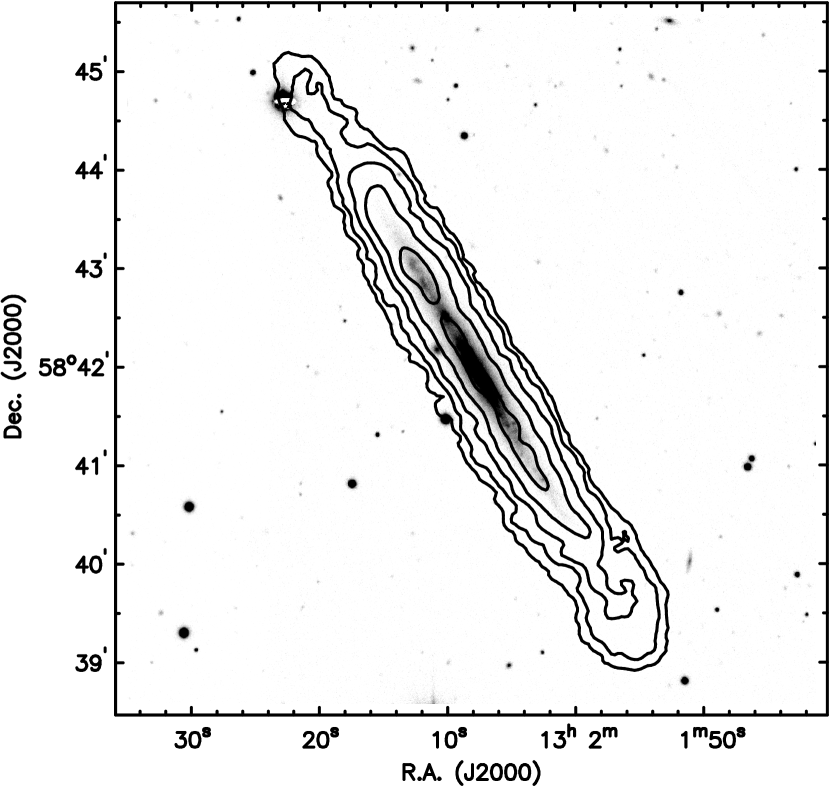
Fig 2 (a) shows the Hi contours overlayed on the g-band optical image of FGC1540. The Hi morphology of FGC1540 shows a relatively symmetric distribution extending beyond the stellar disc. We calculate the Hi mass using the standard formula, = 2.36 105 d, where is the distance in Mpc, is the flux density in Jy and d is in km s-1. We find an integrated flux of 31.5 Jy km/s, which corresponds to a Hi mass of 9 108 M⊙ by assuming a distance of 11 Mpc. The estimated Hi integrated flux density and the Hi mass for the galaxy FGC1540 are given in Table 4. The uncertainty on integrated flux density are dominated by the calibration uncertainties, which for the GMRT are typically 10 . The error on the Hi mass includes the errors on the distance measurements ( 10 ) as well as the error on flux density.
The kinematics of disc galaxies are traditionally modelled using the ‘tilted ring model’ (Rogstad et al., 1974). Derivation of rotation curves and the de-projected Hi surface densities for edge on galaxies is not possible by the usual 2D tilted ring fits which work on 2D velocity fields (e.g. ROTCUR in the GIPSY package, van der Hulst et al., 1992). These 2D tilted ring models work well for galaxies with inclinations lower than 70∘ (e.g. Begeman, 1989; Oh et al., 2018). There are now packages (e.g., TIRIFIC, Józsa et al. (2007); 3d-BAROLO Di Teodoro & Fraternali (2015))which can derive the rotation curve by directly fitting to the 3-D data cube. Since 3D fitting techniques are the most suitable for extracting kinematical information from edge-on galaxies (e.g. Kamphuis et al., 2013), we use Fully Automated TIRIFIC (FAT) software (Kamphuis et al., 2015) to derive the de-projected Hi surface brightness profile and the rotation curve of FGC1540.
4.1 FAT
We derive the rotation curve of FGC1540 by fitting a tilted ring model to the 3-D data cube using the FAT software. FAT is a wrapper around TIRIFIC (Józsa et al., 2007). FAT also uses SOFIA (Serra et al., 2015) to obtain estimates of the initial parameters for the rings. The FAT pipeline fits a 3D tilted ring model directly to the 3-D data cube and determines the rotation curve. FAT errors are empirical errors that are determined by taking the maximum of the difference between the unsmoothed and the smoothed profile, the variation of the smoothed profiles in the Monte Carlo fitting process and a minimum default value. In case of the rotation curve, this minimum value is set as the maximum of 5 km s-1 or 0.5 d/ , where d is the velocity resolution and the inclination (see Kamphuis et al. (2015) for more details on error determination).
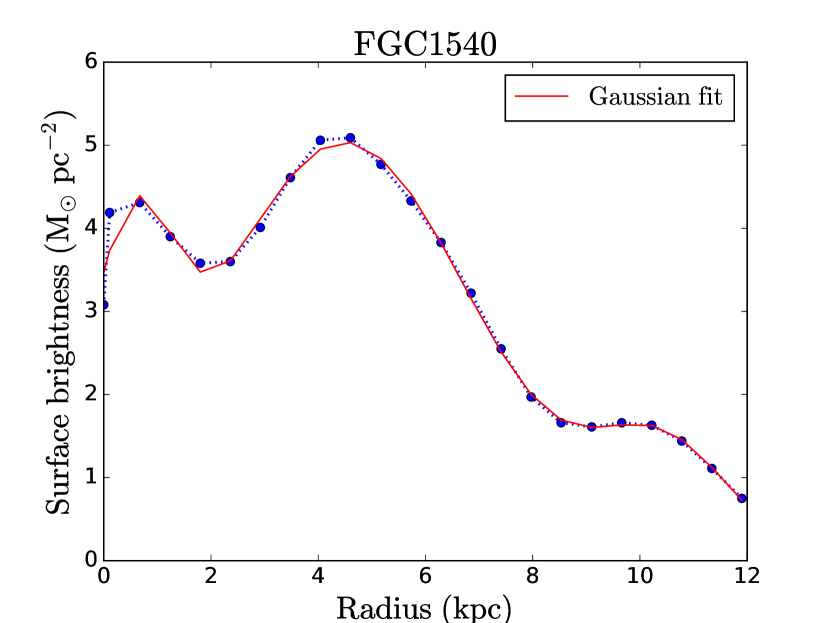
The de-projected Hi radial surface brightness profile for the galaxy FGC1540 is shown in Fig. 2 (b) by the blue dotted line. We fit a triple Gaussian profile to the radial surface density distribution which is shown by the red solid line. The Hi parameters for the galaxy FGC1540 are listed in Table 4.
4.2 Correction for pressure support
The observed rotation velocities under-estimate the dynamical mass when the support due to the radial gas pressure gradient is not insignificant. Hence, in order to construct the mass models, the observed rotation velocities have to be corrected for the pressure support (e.g. Meurer et al., 1996; Begum & Chengalur, 2004). This correction is given by:
| (1) |
where, is the corrected velocity, is the observed rotation velocity, is the Hi surface density, is the velocity dispersion and is the scale height of the disc. We assume that the scale height does not vary with radius and that the velocity dispersion is constant across the galaxy, which gives:
| (2) |
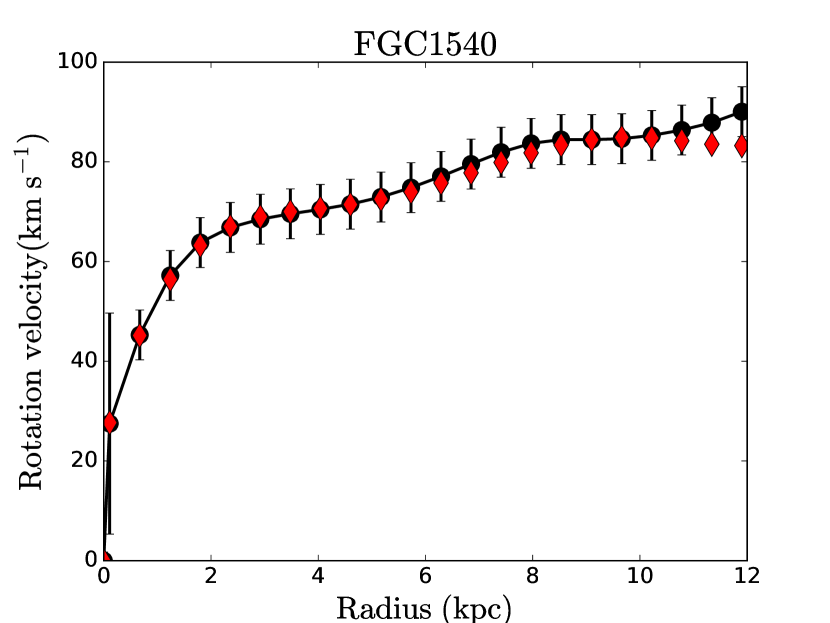
We fit a triple Gaussian profile to the radial surface density distribution and use a velocity dispersion, 10 km s-1 (as derived from the FAT) and substitute them in Equation 2 to calculate the corrected rotation velocities. Fig 3 shows the rotation curves before (red diamonds) and after (black circles) the correction for pressure support. In the inner regions, we find that the correction is small (less than 2.5 km s-1) compared to the error bars on the rotation curve. Even in the outer region, the correction is only 1. We also note that the optical rotation curve matches broadly with the rotation curve derived from Hi distribution.
5 Mass Models
The net gravitational potential of the galaxy is equal to the superposition of the respective gravitational potentials due to the density distributions of the stars, gas and the dark matter halo. The density profiles of the stars and the gas can be modelled from observations; these, in conjunction with the observed rotation curve, may be used to constrain the density profile of the dark matter halo as discussed below.
5.1 Stars
The rotational velocities due to the gravitational potentials of the thin and thick stellar discs (§3.1, §3.2) were determined separately using the GIPSY task ‘ROTMOD’ (van der Hulst et al., 1992), and were added in quadrature in order to obtain the net contribution of the stellar disc, , to the total rotational velocity. We determine the gravitational potential of the stellar disc for two different cases: SDSS –band data and Spitzer IRAC 3.6 m.
5.2 Gas
Similarly, the rotational velocity due to the gravitational potential of the gas, , was obtained with ‘ROTMOD’ using the de-projected Hi radial surface density profile as derived from FAT, assuming an exponential disc vertical structure. The Hi surface density values were scaled by a factor of 1.35 to account for the contribution of Helium. The contribution of molecular gas was neglected as the fraction of H2 to Hi mass in late-type LSB galaxies is generally very small (10-3) (Matthews et al., 2005).
5.3 Dark Matter Halo
We model the dark matter halo first as (i) the observationally-motivated pseudo-isothermal (PIS) dark matter profile with a constant density core, and (ii) the cosmologically-motivated Navarro-Frenk-White (NFW) profile with a cusp central density (Navarro et al., 1996) below.
The PIS dark matter density profile is given by
| (3) |
where is the core density and the core radius of the halo. The circular velocity due to the PIS halo is
| (4) |

The NFW halo has a density profile given by
| (5) |
where is a characteristic radius and is related to the density of the universe at the time of collapse. The circular velocity due to the NFW halo is:
| (6) |
where and ; being the radius at which the mean density of the halo is equal to 200 times the critical density and the rotational velocity at .
Finally, mass models for FGC1540 were constructed using the observed rotation curve corrected for pressure
support derived in the last section. Theoretically, the observed rotational velocity () can be shown to be equal to the quadrature sum of rotational velocities due to the
respective gravitational potentials of the stars (), gas () and dark matter halo ():
As discussed above, and can be determined from the stellar (§3) and gas profiles (§4) using the ‘ROTMOD’ task in GIPSY.
is however not known, and is parametrized by 2 free parameters: , for the PIS halo, , for the NFW halo.
The least square fit to the observed rotation curve using the task
‘ROTMAS’ in GIPSY (van der Hulst et al., 1992) was done in order to determine the best-fitting parameters of the dark matter halo.
| Model | Band | (10-3 M⊙ pc-3) | (kpc) | / | ||
|---|---|---|---|---|---|---|
| Constant | Spitzer 3.6 m | 319 59 | 0.63 0.06 | 0.34 0.10 | 0.35 | 0.47 |
| SDSS –band | 308 60 | 0.64 0.07 | 0.49 0.11 | 0.54 | 0.51 | |
| Minimum disc | 337 61 | 0.61 0.06 | 0.47 0.10 | 0 | 0.45 | |
| Minimum disc with gas | 280 55 | 0.70 0.07 | 0.54 0.10 | 0 | 0.64 | |
| Maximum disc | Spitzer 3.6 m | 3.1 0.3 | 13.9 3.1 | 7.51 0.22 | 18.0 | 0.17 |
| SDSS –band | 3.3 0.5 | 13.3 4.7 | 10.3 0.35 | 12.4 | 0.52 |
6 Results Discussion
The mass-to-light ratio () is one of the major uncertainties while constructing mass models. We, therefore, construct mass models for the four different cases with (1) a fixed mass-to-light ratio as dictated by the stellar population synthesis (SPS) models (2) a maximum disc (3) a minimum disc and (4) a minimum disc with gas. The maximum and minimum disc models respectively constrain the value of the dark matter density to be minimum and maximum at all . We also considered a model allowing the mass-to-light ratio to be a free parameter. However, this did not yield any physically meaningful results and will therefore not be discussed in the following sections.
6.1 Mass-to-light ratios and weighting
6.1.1 Constant
In this case, we set the equal to the value derived from the photometry and SPS models.
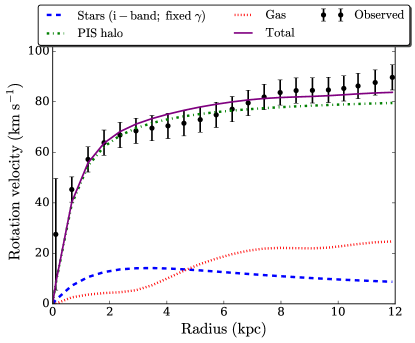
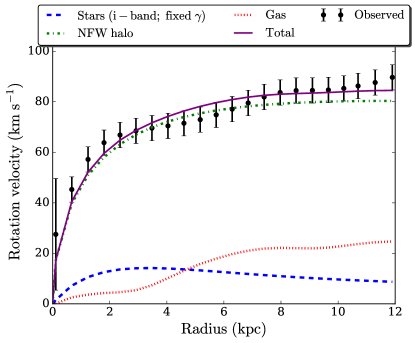
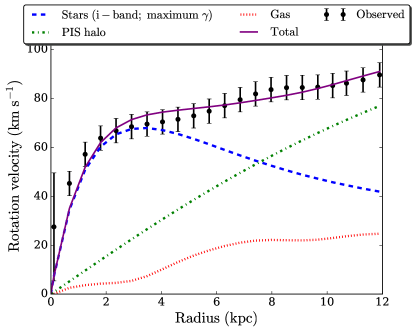
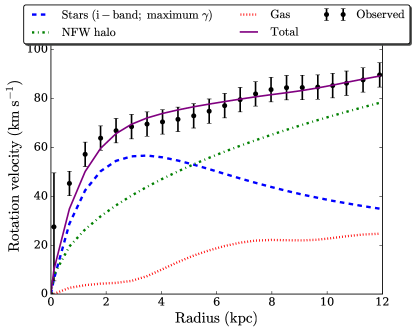
Figure 4 [top panels] show the rotation curve decompositions for the best-fitting mass model using the SDSS –band stellar surface density profiles by fixing the = 0.54 (§3.1). For the PIS halo, the best-fit gives a central density = 0.308 0.060 M⊙ pc-3 and a core radius = 0.64 0.07 kpc. The best-fitting model with an NFW halo corresponds to a concentration parameter = 9.1 0.7 and characteristic radius = 49.5 1.4 kpc.
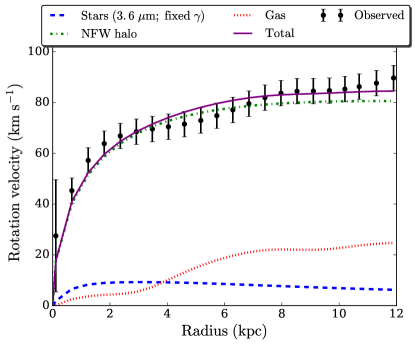
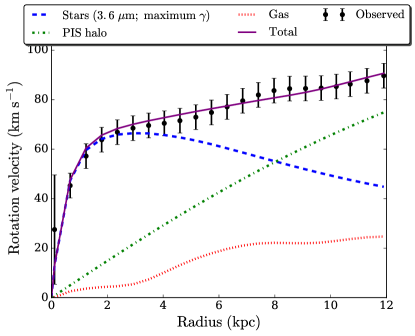
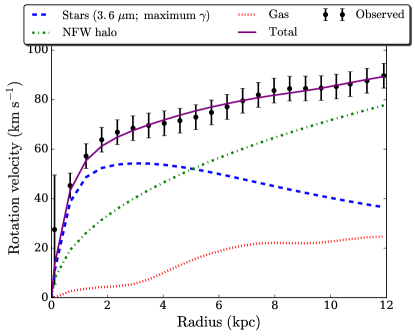
Figure 4 [bottom panels] show the best-fitting mass model using the 3.6 m stellar surface density profiles by fixing the to 0.35 (§3.2). For the PIS halo, the best-fit corresponds to a central density = 0.262 0.053 M⊙ pc-3 and a core radius = 0.69 0.07 kpc. The NFW halo now gives a concentration parameter = 8.6 0.6 and characteristic radius = 50.1 1.5 kpc.
We note that the best-fitting values of the dark matter halo parameters remain almost the same irrespective of the tracer of the stellar density profile used. This could be explained by the fact that the difference between the rotational velocity curves for the stellar potentials obtained from the respective bands is smaller than the error bars on the observed rotation curve.
| Model | Band | (kpc) | ||||
|---|---|---|---|---|---|---|
| Constant | Spitzer 3.6 m | 9.4 0.6 | 49.4 1.4 | 15 | 0.35 | 0.44 |
| SDSS –band | 9.1 0.7 | 49.5 1.4 | 15 | 0.54 | 0.47 | |
| Minimum disc | 9.6 0.7 | 49.3 1.3 | 15 | 0 | 0.45 | |
| Minimum disc with gas | 8.8 0.6 | 52.6 1.5 | 15 | 0 | 0.48 | |
| Maximum disc | Spitzer 3.6 m | 0.82 0.46 | 131.38 38.87 | 15 | 12.0 | 0.11 |
| SDSS –band | 0.87 0.93 | 128.5 73.7 | 15 | 8.64 | 0.52 | |
| Notes: is the expected concentration parameter from the scaling relations of CDM cosmology. | ||||||
6.1.2 Maximum disc
In this model, we scale the rotation curve due to the stellar component to a maximum value such that the dark matter density is non-negative at all radii. As discussed, this sets a lower limit on the dark matter density and hence the contribution of the dark matter to the net gravitational potential of the galaxy.
Figure 5 [top panels] show the rotation curve decompositions with the mass model constructed using the SDSS –band stellar surface density profiles by fixing the to a maximum possible value. For the PIS halo, the best-fitting model gives a central density = 0.0033 0.0005 M⊙ pc-3, the core radius = 13.3 4.7 kpc and mass-to-light ratio = 12.4, whereas the NFW halo gives the concentration parameter = 0.87 0.93, characteristic radius = 128.5 73.7 kpc and mass-to-light ratio = 8.64.
Figure 5 [bottom panels] show the best-fit mass model using the 3.6 m stellar surface density profiles with the model. For the PIS halo, the best-fit gives a central density = 0.0035 0.0003 M⊙ pc-3, the core radius = 11.3 1.6 kpc and = 4.0. The NFW halo gives a reduced = 0.11, the concentration parameter = 0.20 0.8, characteristic radius = 213.9 196.5 kpc and = 4.
We note that the values of the mass-to-light ratio required for the best-fitting models are an order of magnitude higher than the corresponding values dictated by the stellar population syntheses models, which is not physical.
An alternative method of constructing models is to arbitrarily fix the such that the observed rotational velocity at 2.2 could be completely attributed to the baryonic disc without invoking the dark matter halo. However, the drawback with this model is one may end up with negative values of the dark matter densities as was found for the models with NFW halos for the superthin galaxies (Banerjee & Bapat, 2017). Earlier work on LSBs including superthin galaxies using this alternative method indicated that LSBs mostly do not have a (de Blok et al., 2008) as is also the case for the superthins (Banerjee & Bapat, 2017).
6.1.3 Minimum disc
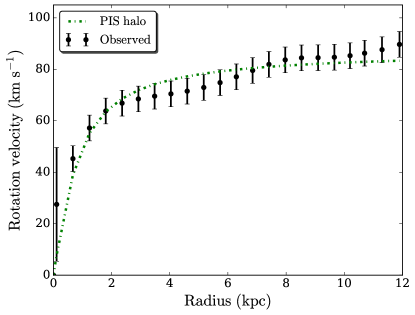
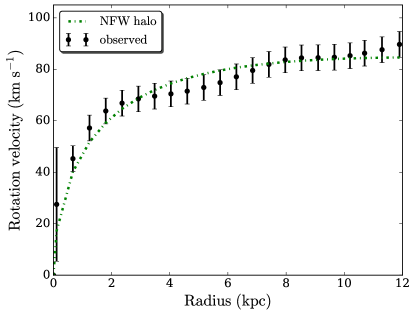
This model assumes that the contribution of stellar and gas disc to the rotation curve is zero and that the rotation curve is entirely due to the dark matter, thus giving an upper limit to the dark matter density. Figure 6 [top panels] show the best-fit to the rotation curve for a PIS halo and and an NFW halo with the model. In this case, the PIS halo gives a central density = 0.280 0.054 M⊙ pc-3 , and a core radius = 0.70 0.07 kpc. The NFW halo gives a concentration parameter = 8.8 0.6 and characteristic radius = 52.6 1.5 kpc.
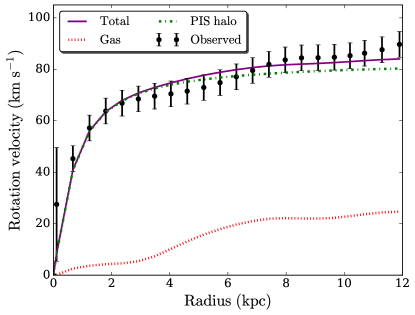
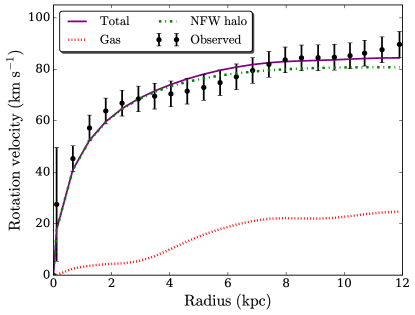
6.1.4 Minimum disc with gas
Here, we consider the contribution of gas (neutral hydrogen and helium) to the rotation curve is taken into account. But, we take the contribution of stellar disc to be zero ( = 0). Figure 6 [bottom panels] show the mass models with zero stellar contribution. In this case, PIS halo gives a central density = 0.337 0.061 M⊙ pc-3 and the core radius = 0.61 0.06 kpc. The NFW halo gives a concentration parameter = 9.6 0.7 and characteristic radius = 49.3 1.3 kpc.
We note, the best-fitting values of the dark matter halo parameters for both the models match within the error bars those from the model with fixed , implying that the contribution of the disc to the net gravitational potential is negligible. This is, again, in compliance with the trend found for other superthin galaxies (Banerjee & Bapat, 2017) and also LSBs in general (de Blok et al., 2008).
| Band | a0 | ||
|---|---|---|---|
| SDSS –band | 3248 708 | 5.70 1.40 | 0.78 |
| Spitzer 3.6 m | 2693 361 | 9.46 1.30 | 0.31 |
| Acceleration per unit mass (a0) is in units of km2 s-2 kpc-1. | |||
We obtain good fits to the observed rotation curve of the superthin galaxy FGC1540 for both the PIS and the NFW dark matter halo models using both the SDSS –band data and Spitzer 3.6 m data, with the values for different parameters obtained using the SDSS –band data and Spitzer 3.6 m data for the stellar contribution matching within error-bars. The reduced is less than 1 for both the PIS and the NFW dark matter halo models, which indicates that error bars on rotation velocity as derived by the FAT package are likely to be overestimated.
We find that except for the models, the ratio of core radius of halo to the scale length of the optical disc (/ ) is 0.5 for the PIS dark matter halo. This indicates that the core of the pseudo isothermal halo is compact, which is consistent with the compact cores (/ < 2) obtained by Banerjee & Bapat (2017) for 3 superthin galaxies (UGC7321, IC5249 and IC2233), but is in contrast with the case of high surface brightness galaxies. Banerjee & Jog (2013) showed that the compact nature of the dark matter halo is fundamentally responsible for the superthin vertical structure of the stellar disc in the prototypical superthin UGC7321. Their analytical calculations showed that for a dark matter halo with a given asymptotic rotational velocity or, in other words, a given total mass, the mean vertical scaleheight-to-radial scalelength ratio remains less than one () only for compact dark matter halos (). This is because for a dark matter halo with a compact core i.e., a core size comparable with the size of the stellar disc, the major mass fraction of the halo is concentrated within the galactic stellar disc, and hence the dark matter halo regulates the disc dynamics in the inner galaxy as well. In contrast, a non-compact dark matter halo dominates the galaxy dynamics mainly at the outer radii, and as a result, its vertical gravitational field cannot strongly act on the stellar disc and render it superthin. Hence, in the case of FGC1540 as well, the compact dark matter halo may be primarily responsible for regulating the superthin vertical structure of the stellar disc.
We can also compare the expected concentration parameter from the scaling relations as predicted from CDM cosmology. The expected concentration parameter (see e.g. Bullock et al., 2001; Bottema & Pestaña, 2015) in terms of maximum rotation velocity is given by
| (7) |
where is the expected concentration parameter and Vmax the maximum rotation velocity. From the rotation curve, the maximum rotation velocity is 84 km s-1, which gives expected concentration parameter to be 15, which differs from the concentration parameter that was obtained from mass modelling . However, we could also derive the value of from the empirical relation between – from the (de Blok et al., 2003; McGaugh et al., 2007) by substituting the with the () (e.g. Oh et al., 2015).We obtain a concentration parameter value of 8.9, which matches with the value obtained from the mass modelling.
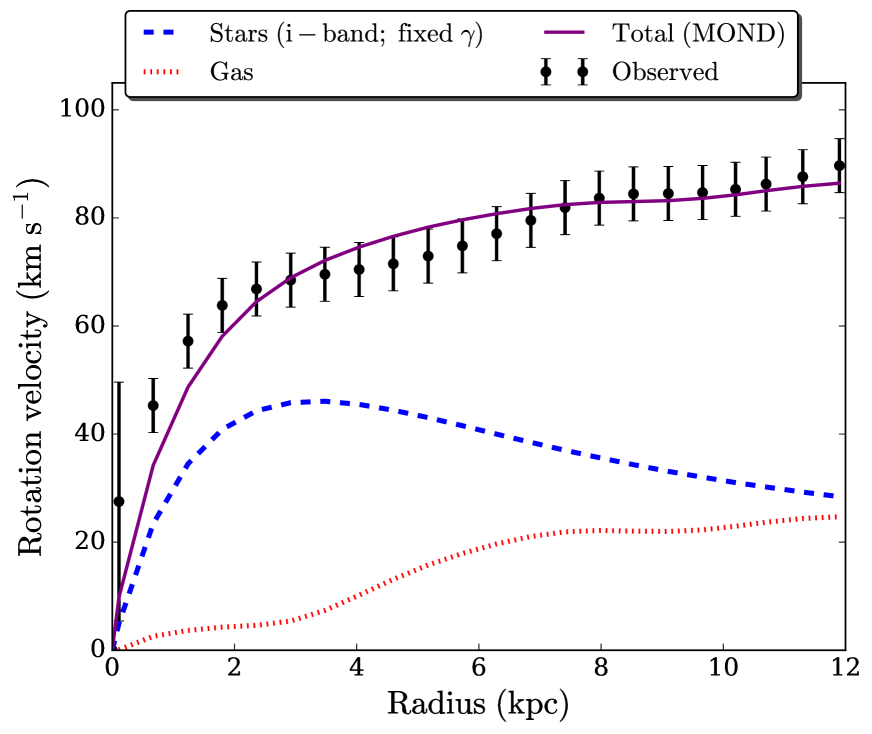
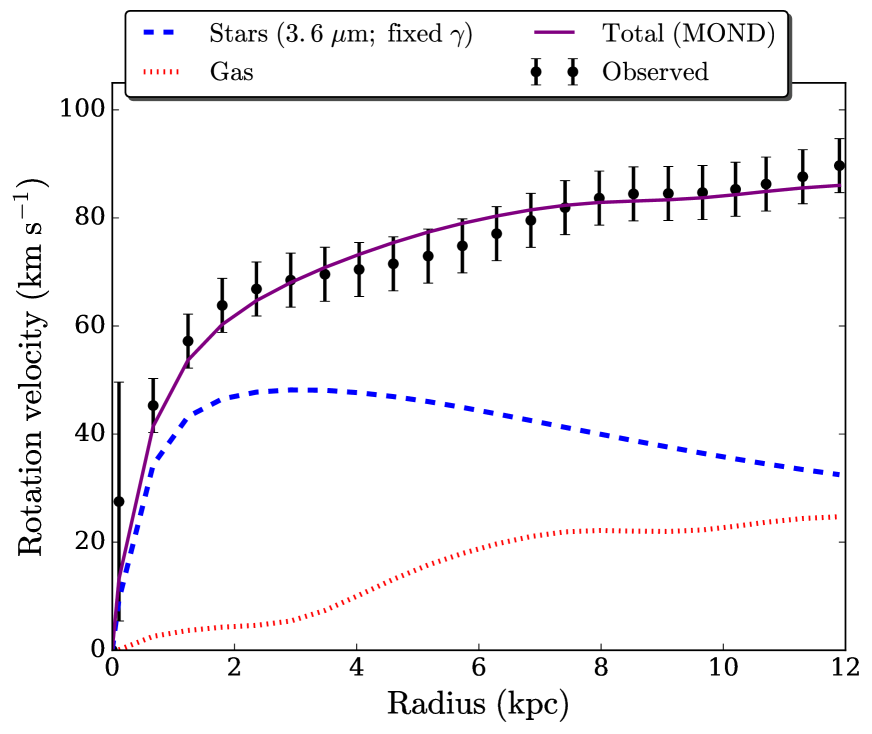
6.2 Mass models with MOND formalism
Modified Newtonian Dynamics (MOND) was proposed as an alternative hypothesis to explain the observed rotation curves of galaxies (Milgrom, 1983). This theory postulates that Newtonian dynamics breaks down at small accelerations. In contrast to Newtonian dynamics, MOND-ian dynamics rule out the presence of dark matter and takes into account the self-gravity of the stars and gas only in galactic dynamics studies. Here, the two free parameters are the stellar mass-to-luminosity ratio () and the acceleration per unit length (a0).
Fig. 7 shows the best-fitting rotation curve for the MOND formalism using both the SDSS –band data and the Spitzer 3.6 m data. The parameters obtained for the MOND formalism are summarized in Table 7. In compliance with the earlier studies of superthin galaxies, the best-fitting is not unusually high compared to those dictated by stellar population synthesis models. The best-fit acceleration parameters (a0) do not differ significantly with the acceleration parameter (3734 km2 s-2 kpc-1) expected from MOND theory. This possibly indicates that the superthins comply with mass models under the MOND formalism.
7 Summary and Conclusions
We present the GMRT 21cm radio-synthesis observation of the superthin galaxy, FGC1540, and also its rotation curve and Hi surface density modelled using the publicly available software FAT (Fully Automated Tirrific). Using the SDSS –band and Spitzer 3.6 m data in conjunction with the Hi data, we also construct mass models for FGC1540. We find that both the pseudo isothermal halo and NFW halo fit equally well for the dark matter; the best fitting models with the PIS halo profile indicates a compact core, where the best fit core radius () is approximately half the stellar disc scale length (). This is in contrast with the case of high surface brightness galaxies where the halo core radius is typically 3-4 times that of the stellar scale length. Banerjee & Bapat (2017) also found that for 3 superthin galaxies (UGC7321, IC5249, and IC2233), the best fitting mass model with a PIS dark matter density profile indicate a compact dark matter halo (with / < 2 ). A compact dark matter halo strongly regulates the distribution of stars in the vertical direction as the vertical thickness of a galactic stellar disc is determined by the balance between the vertical self-gravitational force and pressure (see e.g. Banerjee & Jog, 2013; Ghosh & Jog, 2014; Garg & Banerjee, 2017). This supports the suggestion that the compact core of the dark matter halo is responsible for the existence of superthin galaxies.
Acknowledgements
This paper is based in part on observations taken with the GMRT. We thank the staff of the GMRT who made these observations possible. The GMRT is run by the National Centre for Radio Astrophysics of the Tata Institute of Fundamental Research. We acknowledge the usage of the HyperLeda database (http://leda.univ-lyon1.fr). The work of Russian researchers was supported by the Russian Science Foundation grant 14–12–00965.
References
- Ahn et al. (2012) Ahn C. P., et al., 2012, ApJS, 203, 21
- Banerjee & Bapat (2017) Banerjee A., Bapat D., 2017, MNRAS, 466, 3753
- Banerjee & Jog (2008) Banerjee A., Jog C. J., 2008, ApJ, 685, 254
- Banerjee & Jog (2013) Banerjee A., Jog C. J., 2013, MNRAS, 431, 582
- Banerjee et al. (2010) Banerjee A., Matthews L. D., Jog C. J., 2010, New Astron., 15, 89
- Begeman (1989) Begeman K. G., 1989, A&A, 223, 47
- Begum & Chengalur (2004) Begum A., Chengalur J. N., 2004, A&A, 413, 525
- Bell & de Jong (2001) Bell E. F., de Jong R. S., 2001, ApJ, 550, 212
- Bottema & Pestaña (2015) Bottema R., Pestaña J. L. G., 2015, MNRAS, 448, 2566
- Bullock et al. (2001) Bullock J. S., Kolatt T. S., Sigad Y., Somerville R. S., Kravtsov A. V., Klypin A. A., Primack J. R., Dekel A., 2001, MNRAS, 321, 559
- D’Onghia et al. (2006) D’Onghia E., Burkert A., Murante G., Khochfar S., 2006, MNRAS, 372, 1525
- Dalcanton et al. (2004) Dalcanton J. J., Yoachim P., Bernstein R. A., 2004, ApJ, 608, 189
- Di Teodoro & Fraternali (2015) Di Teodoro E. M., Fraternali F., 2015, MNRAS, 451, 3021
- Garg & Banerjee (2017) Garg P., Banerjee A., 2017, MNRAS, 472, 166
- Gentile et al. (2004) Gentile G., Salucci P., Klein U., Vergani D., Kalberla P., 2004, MNRAS, 351, 903
- Gerritsen & de Blok (1999) Gerritsen J. P. E., de Blok W. J. G., 1999, A&A, 342, 655
- Ghosh & Jog (2014) Ghosh S., Jog C. J., 2014, MNRAS, 439, 929
- Goad & Roberts (1981) Goad J. W., Roberts M. S., 1981, ApJ, 250, 79
- Józsa et al. (2007) Józsa G. I. G., Kenn F., Klein U., Oosterloo T. A., 2007, A&A, 468, 731
- Kamphuis et al. (2013) Kamphuis P., et al., 2013, MNRAS, 434, 2069
- Kamphuis et al. (2015) Kamphuis P., Józsa G. I. G., Oh S.-. H., Spekkens K., Urbancic N., Serra P., Koribalski B. S., Dettmar R.-J., 2015, MNRAS, 452, 3139
- Karachentsev et al. (1993) Karachentsev I. D., Karachentseva V. E., Parnovskij S. L., 1993, Astronomische Nachrichten, 314, 97
- Karachentsev et al. (1999) Karachentsev I. D., Karachentseva V. E., Kudrya Y. N., Sharina M. E., Parnovskij S. L., 1999, Bulletin of the Special Astrophysics Observatory, 47
- Kautsch (2009a) Kautsch S. J., 2009a, PASP, 121, 1297
- Kautsch (2009b) Kautsch S. J., 2009b, Astronomische Nachrichten, 330, 1053
- Kautsch et al. (2006) Kautsch S. J., Grebel E. K., Barazza F. D., Gallagher III J. S., 2006, A&A, 445, 765
- Kautsch et al. (2009) Kautsch S. J., Gallagher J. S., Grebel E. K., 2009, Astronomische Nachrichten, 330, 1056
- Khochfar (2009) Khochfar S., 2009, in Jogee S., Marinova I., Hao L., Blanc G. A., eds, Astronomical Society of the Pacific Conference Series Vol. 419, Galaxy Evolution: Emerging Insights and Future Challenges. p. 197 (arXiv:0903.0734)
- Kregel et al. (2005) Kregel M., van der Kruit P. C., Freeman K. C., 2005, MNRAS, 358, 503
- Matthews (2000) Matthews L. D., 2000, AJ, 120, 1764
- Matthews & Wood (2001) Matthews L. D., Wood K., 2001, ApJ, 548, 150
- Matthews et al. (1999) Matthews L. D., Gallagher III J. S., van Driel W., 1999, AJ, 118, 2751
- Matthews et al. (2005) Matthews L. D., Gao Y., Uson J. M., Combes F., 2005, AJ, 129, 1849
- McGaugh et al. (2007) McGaugh S. S., de Blok W. J. G., Schombert J. M., Kuzio de Naray R., Kim J. H., 2007, ApJ, 659, 149
- Meurer et al. (1996) Meurer G. R., Carignan C., Beaulieu S. F., Freeman K. C., 1996, AJ, 111, 1551
- Milgrom (1983) Milgrom M., 1983, ApJ, 270, 365
- Mosenkov et al. (2010) Mosenkov A. V., Sotnikova N. Y., Reshetnikov V. P., 2010, MNRAS, 401, 559
- Naab & Burkert (2003) Naab T., Burkert A., 2003, ApJ, 597, 893
- Narayan et al. (2005) Narayan C. A., Saha K., Jog C. J., 2005, A&A, 440, 523
- Navarro et al. (1996) Navarro J. F., Frenk C. S., White S. D. M., 1996, ApJ, 462, 563
- O’Brien et al. (2010) O’Brien J. C., Freeman K. C., van der Kruit P. C., 2010, A&A, 515, A63
- Oh et al. (2015) Oh S.-H., et al., 2015, AJ, 149, 180
- Oh et al. (2018) Oh S.-H., Staveley-Smith L., Spekkens K., Kamphuis P., Koribalski B. S., 2018, MNRAS, 473, 3256
- Rogstad et al. (1974) Rogstad D. H., Lockhart I. A., Wright M. C. H., 1974, ApJ, 193, 309
- Salo et al. (2015) Salo H., et al., 2015, ApJS, 219, 4
- Schlafly & Finkbeiner (2011) Schlafly E. F., Finkbeiner D. P., 2011, ApJ, 737, 103
- Serra et al. (2015) Serra P., et al., 2015, MNRAS, 448, 1922
- Uson & Matthews (2003) Uson J. M., Matthews L. D., 2003, AJ, 125, 2455
- Zasov et al. (1991) Zasov A. V., Makarov D. I., Mikhailova E. A., 1991, Soviet Astronomy Letters, 17, 374
- Zasov et al. (2002) Zasov A. V., Bizyaev D. V., Makarov D. I., Tyurina N. V., 2002, Astronomy Letters, 28, 527
- Zibetti et al. (2009) Zibetti S., Charlot S., Rix H.-W., 2009, MNRAS, 400, 1181
- de Blok et al. (2003) de Blok W. J. G., Bosma A., McGaugh S., 2003, MNRAS, 340, 657
- de Blok et al. (2008) de Blok W. J. G., Walter F., Brinks E., Trachternach C., Oh S.-H., Kennicutt Jr. R. C., 2008, AJ, 136, 2648
- van der Hulst et al. (1992) van der Hulst J. M., Terlouw J. P., Begeman K. G., Zwitser W., Roelfsema P. R., 1992, in Worrall D. M., Biemesderfer C., Barnes J., eds, Astronomical Society of the Pacific Conference Series Vol. 25, Astronomical Data Analysis Software and Systems I. p. 131
- van der Kruit (1988) van der Kruit P. C., 1988, A&A, 192, 117
- van der Kruit & Searle (1981) van der Kruit P. C., Searle L., 1981, A&A, 95, 105
- van der Kruit et al. (2001) van der Kruit P. C., Jiménez-Vicente J., Kregel M., Freeman K. C., 2001, A&A, 379, 374