Emergence of frustration signals systemic risk
Abstract
We show that the emergence of systemic risk in complex systems can be understood from the evolution of functional networks representing interactions inferred from fluctuation correlations between macroscopic observables. Specifically, we analyze the long-term collective dynamics of the New York Stock Exchange between 1926-2016, showing that periods marked by systemic crisis, viz., around the Great Depression of 1929-33 and the Great Recession of 2007-09, are associated with emergence of frustration indicated by the loss of structural balance in the interaction networks. During these periods the dominant eigenmodes characterizing the collective behavior exhibit delocalization leading to increased coherence in the dynamics. The topological structure of the networks exhibits a slowly evolving trend marked by the emergence of a prominent core-periphery organization around both of the crisis periods.
Analyzing the collective behavior of a complex system comprising many components is challenging as the interactions between the local dynamics of the individual components often result in the emergence of qualitatively different phenomena at the systems-level Hidalgo2009 ; May2013 . Indeed many natural and social systems have extremely large number of constituent elements, each following complicated trajectories and influencing others through heterogeneous forms of coupling which may also evolve over time Castellano09 ; Sugihara2012 . Thus, a complete microscopic description of such systems in terms of all the variables involved will be intractable. Instead, a parsimonious description in terms of effective interactions between relatively fewer number of key macroscopic observables may prove to be more effective in understanding the global evolution of the system Beale2011 ; Battiston2016 . The nature of connectivity between the observables can be inferred from the cross-correlations between their temporal evolution Gomez2009 , allowing the construction of a functional network coordinating the overall behavior. This approach has been successfully used for analyzing many natural (e.g., the brain Chialvo2010 ; Arenas2016 ) and socio-economic (e.g., financial markets Laloux1999 ; Plerou1999 ; Pan2007 ) systems, where it can help us understand how extreme events, such as large-scale failures leading to systemic crisis, can arise May2008 ; Haldane2011 ; Noel2013 .
Financial markets provide a particularly appropriate example where such an approach can be used to identify possible universal patterns characterizing self-organizing collective phenomena because of the availability of a large volume of high-quality data Mantegna1999 ; Bouchaud2003 ; Sinha11 . The global dynamics of such a system emerges from millions of transactions daily at the micro-scale between market participants, ranging from individual traders to institutional investors who are variously driven by changes in economic fundamentals, herding effects, idiosyncratic motives and exogenous shocks like news Cont2000 ; Gabaix2006 . A macroscopic description can thus be framed in terms of effective interactions between financial assets inferred from correlations in their price fluctuations that result from the aggregation of all transactions in these assets by market participants. Here we have analyzed the collective dynamics of price fluctuations in the largest stock market, viz., New York Stock Exchange (NYSE), over a period of nine decades (1926-2016) to understand the evolution of this complex system over extremely long time-scales Kuyyamudi2015 . Specifically, we aim to identify quantitative signatures of systemic risk whereby initially localized perturbations can eventually trigger economy-wide catastrophic changes Acemoglu2015 ; Bardoscia2017 .
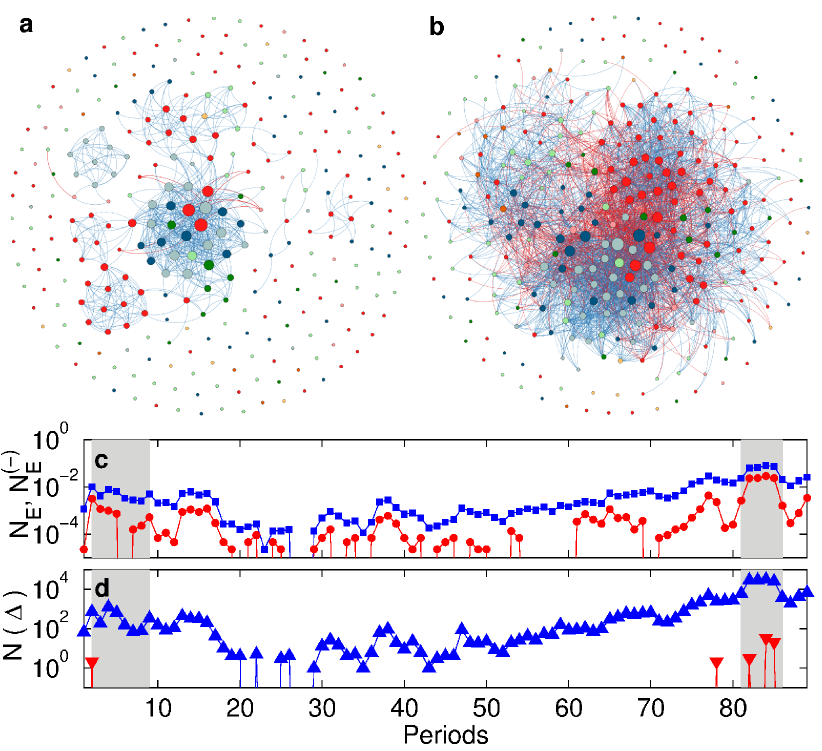
In this paper we uncover several important features of the long-term dynamics of the market by investigating the topological features characterizing the interaction networks between stocks over the entire sequence of different intervals comprising the period under study [see Fig. 1(a-b) for two representative networks from periods prior to and during the 2007-9 crisis]. The most striking of these is the observation that periods of major economic crisis, viz., the Great Depression of 1929-33 and the Great Recession of 2007-9, are associated with the loss of structural balance in the corresponding interaction network for those periods. It is significant that such a phenomenon, which is equivalent to the emergence of frustration, is often identified with a major regime transition in complex systems, e.g., in physical systems (spin glass Fischer1991 ; Stein2013 ) as well as in social systems (such as the loss of structural balance in the network of strategic alliances between nations preceding the outbreak of the first world war Antal2005 ). We show the existence of a slowly evolving trend in the properties of the interaction network, most notably in the number of edges with negative weights which is related to the intensity of anti-correlated movements [Fig. 1(c)] and in the number of connected triads that indicates the extent of clustering [Fig. 1(d)]. These measures have low values for most of the duration under study but become high close to the two periods of crisis mentioned earlier. An associated result is that the networks corresponding to the crisis periods exhibit stronger assortativity indicative of a prominent core-periphery organization. We indeed observe large, densely connected inner cores in the periods around the two crises, suggesting an increased degree of coherence in the movement of stocks. This is reinforced by our demonstration of delocalization in the strongest eigenmodes characterizing large-scale correlated movements during these times note4 .
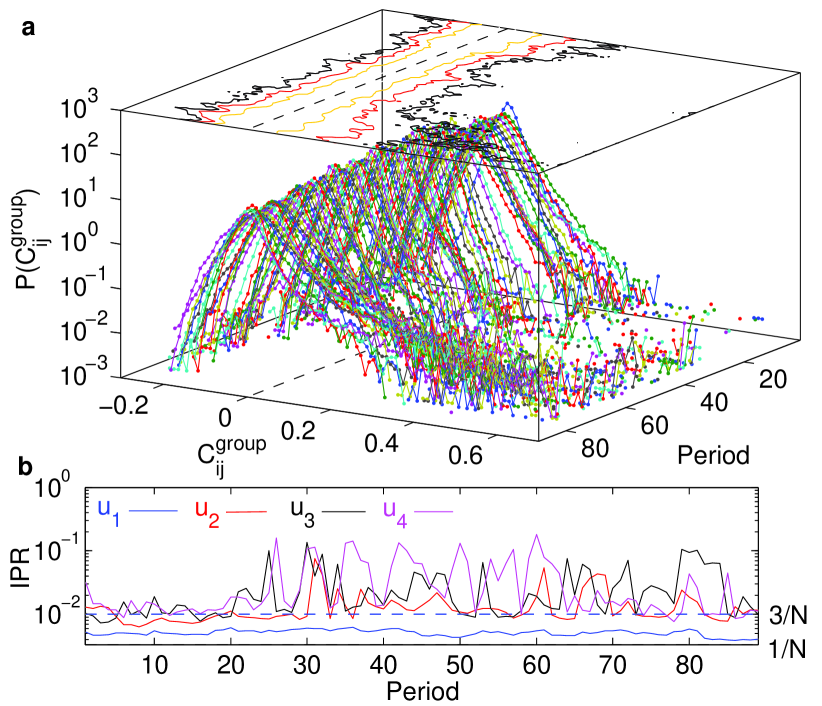
The data used for our analysis is obtained from a database comprising time series of daily closing prices for all stocks traded in NYSE between December 31, 1925 and March 18, 2016, which is maintained by the Center for Research in Security Prices (CRSP) CRSP . We have segregated the total duration into 89 overlapping periods of days, with an overlap of 260 days (approximately corresponding to the number of working days in a year). In each of these periods we focus on stocks having the highest average price in that interval among all the stocks note1 . We have repeated the analysis with different samples obtained from the database, e.g., by increasing to 500 or choosing 300 stocks by random sampling, and have obtained qualitatively similar results. To construct the interaction network between stocks for each period, we focus on cross-correlations () in the normalized logarithmic returns (, and representing mean and standard deviation, respectively) that measures daily fluctuations in the stock prices (, ). Spectral decomposition of the cross-correlation matrix C allows it to be expressed as the sum of terms (corresponding to the different eigenmodes), viz., () where and are the eigenvalues and eigenvectors of C. By comparing with the spectrum of the corresponding Wishart matrix, i.e., the random correlation matrix constructed from mutually uncorrelated time-series each of length , we filter out from C all modes corresponding to eigenvalues that lie within the bounds of the Wishart matrix spectrum Marchenko67 . These “random” modes are essentially indistinguishable from noise and we thus focus only on the deviating modes whose eigenvalues are higher than . The eigenmode corresponding to the largest eigenvalue is identified as the “global” mode that represents signals common to the entire market, while the other deviating eigenmodes together represent the “group” dynamics between related stocks which are responding to similar signals specific to the community to which they belong, e.g., stocks in the same industrial sector. Thus, the spectral decomposition of the collective dynamics allows it to be split into three components, viz., C = Cglobal + Cgroup + Crandom. Fig. 2 (a) shows the time-evolution of the distribution of the elements of Cgroup over the period under study.
The distinct nature of the eigenmodes belonging to these three components is indicated by the qualitatively different distributions followed by the corresponding eigenvector components. In particular, one can quantify this difference by measuring the degree of localization of the eigenmodes using their inverse participation ratio (IPR). This is defined for the -th eigenvector as where is the -th component of the vector note3 . A completely delocalized eigenmode where all components have exactly identical contribution, viz., , will yield an IPR value of . We note that this is approximately the case for the global eigenmode corresponding to the largest eigenvalue of C [Fig. 2 (b)]. The “random” eigenmodes also do not exhibit substantial localization having IPR values around [indicated by the broken line in Fig. 2 (b)]. In contrast, the “group” eigenmodes can show a high degree of localization, with the highest possible value of IPR, viz., corresponding to a single component (say ) dominating the eigenmode, i.e., and for . We note from Fig. 2 (b) that for most of the periods investigated, the IPR for the eigenmodes corresponding to the three highest deviating eigenvalues are indeed much larger than those for the random and global modes. They signify the existence of groups of stocks (viz., the ones having dominant contribution to a deviating eigenmode) such that members of a group have their dynamics more in synchrony with each other as compared to the rest. However, during the two intervals in which there was systemic crises (viz., the Great Depression and the Great Recession), the IPR for all three deviating eigenmodes shown here become almost indistinguishable from that of the random modes. This substantial decrease of the IPR indicates the occurrence of delocalization in the group eigenmodes during times of crises, which in turn signifies that stocks lose any distinct dynamical identity. Thus, systemic crises are marked by globally synchronized collective dynamics characterized by delocalization in all eigenmodes.
In order to analyze this evolution in the nature of interactions between stocks in greater detail, we have reconstructed signed, undirected networks representing significant correlations between stocks for each of the 89 periods under investigation [two instances are shown in Fig. 1 (a-b)]. To obtain the adjacency matrix A for such a network from the corresponding group correlation matrix Cgroup, we impose a threshold such that if , if and otherwise. Here, and are the mean and standard deviation (respectively) of the distribution of matrix elements note2 . Our analysis of the networks for the 89 successive periods reveal significant temporal variation in the frequency of edges with negative weights between various stocks [Fig. 1 (c)]. The number of connected triads (linked by statistically significant cross-correlations) that are observed also vary over a large range spanning 5 orders of magnitude but become particularly large only during the period preceding (and following) the two particularly catastrophic events that occurred during the period under study, viz., the Great Depression of 1929 and the Great Recession of 2007 [Fig. 1 (d)]. Most strikingly, the number of frustrated triads which measures the extent of the loss of structural balance in the network of interactions only show non-zero values in the periods just prior to and during the two crisis periods [Fig. 1 (d)].
The concept of structurally balanced networks was originally introduced in the context of social interactions Heider1946 and refers to systems having positive or negative links arranged such that they do not give rise to inconsistent relations within cycles in the network. An example of arranging such links so that they give rise to an inconsistency (resulting in frustration or equivalently, loss of balance) occurs when three nodes , and are connected to each other such that the links between and are positive, but that between is negative. If the node states can be in one of two states (e.g., “up” or “down”), it is easy to see that no possible assignment of states exist that satisfy all the given relations between the nodes. In general, a system loses balance if triads of connected nodes possess an odd number of negative relations. It is also known that a balanced network can be always mapped to a system comprising two subnetworks, with only positive interactions existing within each subnetwork, while links between the two are exclusively negative Cartwright1956 .
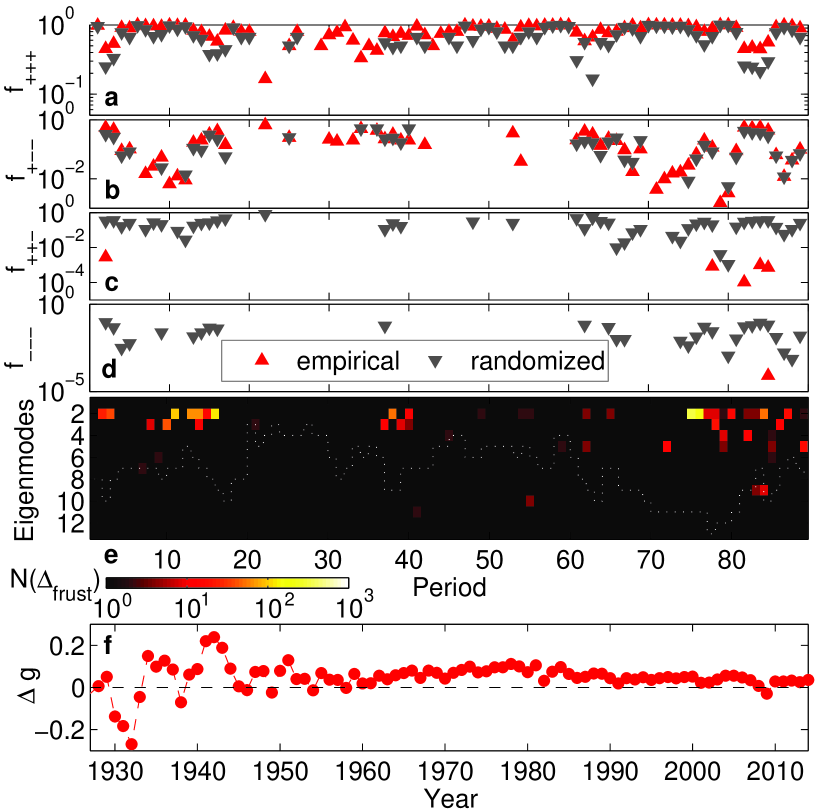
To explore how the balance of the interaction network evolves over different periods, we show in Fig. 3 the sign composition of all the triads that occur in the network in a given period. The first two panels [(a) and (b)] correspond to the fraction of balanced triads (i.e., those having two or no negative edges) while the next two panels [(c) and (d)] show the fraction of unbalanced triads (i.e., having one or three negative edges). We also show for comparison the fraction of triads of each type that are expected to arise by chance given the degree sequence of the network (calculated from the corresponding signed degree-preserved randomized networks). We observe that in the empirical networks, unbalanced triads are far less likely to occur than by chance (with the triad having all negative links occurring only once over the entire duration investigated), and are seen exclusively during systemic crises in the financial system. In Fig. 3 (e) we show how each individual eigenmode belonging to Cgroup (used for reconstructing the interaction network) contributes to the loss of structural balance. This is done by computing the number of frustrated triads in the network corresponding to the eigenmode . This network is constructed from the matrix obtained through the outer product . We observe that frustrated triads appear in individual eigenmodes in many periods clustered around intervals having negative growth rate measured in terms of relative change in the GDP per capita that is shown in Fig. 3 (f). It is worth noting that the frustrated triads in the individual eigenmodes do not appear when we consider the interaction network obtained by aggregating over these modes except in the two major financial crises that occurred during the entire duration under study.
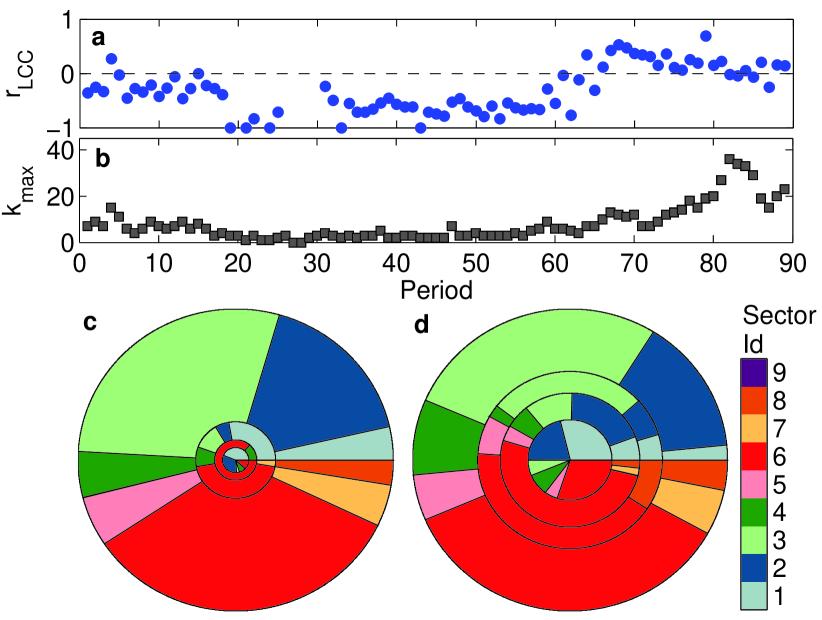
Analysis of the interaction networks (reconstructed from the group correlation matrix) across time also indicates changes in the macroscopic properties of the network which correlate with the stress in the economy. For instance, we observe that the network gets more connected during crisis periods as indicated by the time-evolution of the number of edges [Fig. 1 (c)]. More intriguingly, there is evidence of degree homophily, i.e., nodes tend to preferentially connect with other nodes having similar degree (i.e., number of connections). This is measured for the largest connected component of each of the networks using the measure of assortativity coefficient Newman2003 [Fig. 4 (a)]. It allows us to observe a systematic variation in the mesoscopic structure of the interaction network, with being positive (i.e., the network is assortative) during periods of stress and negative (i.e., disassortative) in other times. We note that degree assortativity in a network implies the existence of a densely connected core of high degree nodes with low degree nodes forming the periphery Newman2003b .
To characterize the core-periphery structure of the networks in detail we have performed -core decomposition Seidman83 on them. This technique successively reveals cores of higher order by sequentially removing shells comprising nodes of lower degree in a recursive manner. The order of the innermost core provides a measure of the depth of interconnectedness in the system for a particular period. Fig. 4 (b) shows that peaks during the periods of systemic crisis further underlining the earlier observation that these periods are associated with global synchronization in the collective dynamics. Fig. 4 (c-d) shows the sector compositions of the shells by grouping them into quartiles, for two of the interaction networks corresponding to Periods 80 (pre-crisis) and 85 (crisis) respectively. The fractional occupancy of a shell quartile by stocks belonging to different industrial sectors is shown using a color code constructed from the four digit Standard Industrial Classification (SIC) as has been indicated in the key. In the pre-crisis period most of the stocks occupy the outer periphery of the network, while during crisis the inner cores become densely populated as indicated by the increased radius of the innermost shell quartile. The diverse sectoral composition of the inner cores is consistent with the emergence of system-wide coherent activity during the crises periods as was suggested by the delocalization of group eigenmodes. This is a quantitative demonstration of the fact that the 2007-09 crisis spilled over to the entire economy after originating in the financial sector Acharya2009 .
It is tempting to conclude that the loss of structural balance in the interaction networks characterizing a financial market can act as a robust indicator signaling the onset of a systemic crises. As already noted earlier, we have obtained qualitatively similar results for other representative samples obtained from the same database. While it may appear that the loss of balance occurs as a sudden event that coincides with the onset of systemic crisis in the system, the other results reported here show that it is in fact connected to a gradual build-up of stress in the market. The resulting change in the nature of the collective dynamics is reflected in the localization-delocalization transition in the group eigenmodes, as well as, structural transformations in the core-periphery organization of the interaction network. We find that there is a strong correspondence between these phenomena and the evolution of market behavior in the 90-year interval under study, where an initial period of high stress (Great Depression) was followed by a long interval of relative calm but that eventually ended in another period of high stress (Great Recession).
Financial markets are known to exhibit periods of high volatility leading to extreme fluctuations in asset prices which, however, seem to have little impact on the economy as a whole Diebold2010 . There have been only two major exceptions to this general trend, viz., the 1929-33 and the 2007-09 crises, where the disturbance originating in the financial sector spilled over to the other sectors eventually resulting in a economy-wide slump. The results reported in this paper may provide significant insights into understanding how local perturbations propagating through complex networks can occasionally trigger such global catastrophes. In particular, our work suggests that loss of structural balance in the networks representing interactions within the components of the financial market can signal critical accumulation of macroeconomic stress that leads to severe systemic crises.
We would like to thank Nils Bertschinger, Bikas K Chakrabarti and Tiziana Di Matteo for helpful discussions. This work was supported in part by IMSc Econophysics (XII Plan) Project funded by the Department of Atomic Energy, Government of India. ASC would like to thank Boston University where preliminary analysis of the data was done. We thank the Vikram Sarabhai Library, IIM Ahmedabad for providing access to data used in this study.
References
- (1) C. A. Hidalgo and R. Hausmann, Proc. Natl. Acad. Sci. USA 106, 10570 (2009).
- (2) R. M. May, Phil. Trans. R. Soc. A 371, 20120376 (2013).
- (3) C. Castellano, S. Fortunato and V. Loreto, Rev. Mod. Phys. 81, 591 (2009).
- (4) G. Sugihara et al., Science 338, 496 (2012).
- (5) N. Beale et al. Proc. Natl. Acad. Sci. USA 108, 12647 (2011).
- (6) S. Battiston et al., Science 351, 818 (2016).
- (7) S. Gómez, P. Jensen, and A. Arenas, Phys. Rev. E 80, 016114 (2009).
- (8) D. R. Chialvo, Nature Physics 6, 744 (2010).
- (9) M. De Domenico, S. Sasai, and A. Arenas, Front. Neurosci. 10, 326 (2016).
- (10) L. Laloux, P. Cizeau, J. P. Bouchaud, and M. Potters, Phys. Rev. Lett. 83, 1467 (1999͒).
- (11) V. Plerou, P. Gopikrishnan, B. Rosenow, L. A. Nunes Amaral, and H. E. Stanley, Phys. Rev. Lett. 83, 1471 (1999͒).
- (12) R. K. Pan and S. Sinha, Phys. Rev. E 76, 046116 (2007).
- (13) R. M. May, S. A. Levin, and G. Sugihara, Nature, 451 893 (2008).
- (14) A. G. Haldane and R. May, Nature 469 (2011) 351.
- (15) P-A. Noël, C. D. Brummitt, and R. M. D’Souza, Phys. Rev. Lett. 111, 078701 (2013)
- (16) R. N. Mantegna and H. E. Stanley, Introduction to Econophysics (Cambridge University Press, Cambridge, 1999͒).
- (17) J. P. Bouchaud and M. Potters, Theory of Financial Risk and Derivative Pricing, 2nd ed. (Cambridge University Press, Cambridge, 2003͒).
- (18) S. Sinha, A. Chatterjee, A. Chakraborti and B. K. Chakrabarti, Econophysics: An Introduction (Wiley-VCH, Weinheim, 2011).
- (19) R. Cont and J. P. Bouchaud, Macroecon. Dynam. 4, 170 (2000).
- (20) X. Gabaix, P. Gopikrishnan, V. Plerou and H. E. Stanley, Q. J. Econ. 121, 461 (2006).
- (21) C. Kuyyamudi, A. S. Chakrabarti and S. Sinha, in Econophysics and Data Driven Modelling of Market Dynamics (Springer, Cham, 2015), p. 105.
- (22) D. Acemoglu, A. Ozdaglar and A. Tahbaz-Salehi, Am. Econ. Rev. 105, 564 (2015).
- (23) M. Bardoscia, S. Battiston, F. Caccioli, and G. Caldarelli, Nature Comm. 8, 14416 (2017).
- (24) K. H. Fischer and J. A. Hertz, Spin Glasses (Cambrdige Univ. Press, Cambridge, 1991).
- (25) D. L. Stein and C. M. Newman, Spin Glasses and Complexity (Princeton Univ. Press, Princeton ,2013)
- (26) T. Antal, P. L. Krapivsky and S. Redner, Phys. Rev. E 72, 036121 (2005).
- (27) This is consistent with the observation that delocalization transition is induced by increased clustering in complex networks reported in L. Jahnke, J. W. Kantelhardt, R. Berkovits, and S. Havlin, Phys. Rev. Lett. 101, 175702 (2008).
- (28) http://www.crsp.com/products/research-products/crsp-us-stock-databases
- (29) Missing values in the price series of stocks were filled by assuming that it was not traded in those days such that the price remained unchanged from the last available value. It was ensured that stocks did not have more than 50 missing values in each interval of length to reduce spurious correlations.
- (30) V. A. Marchenko and L. A. Pastur, Mat. Sb. 114, 507 (1967).
- (31) The eigenvector components () of the -th eigenmode are normalized such that .
- (32) As the elements of appears to have a Gaussian distribution, imposing the specified threshold implies that the probability that the cross-correlation in group modes that we are using to infer interactions could arise randomly from noise is less than 0.01.
- (33) F. Heider, J. Psychology 21, 107 (1946).
- (34) D. Cartwright and F. Harary, Psychol. Rev. 63, 277 (1956).
- (35) M. E. J. Newman, Phys. Rev. E 67, 026126 (2003).
- (36) M. E. J. Newman and M. Girvan, in R. Pastor-Satorras, J. Rubi, and A. Di’az-Guilera, eds., Statistical Mechanics of Complex Networks, no. 625 in Lecture Notes in Physics, pp. 66-87, Springer, Berlin (2003).
- (37) S. B. Seidman, Soc. Netw. 5, 269 (1983).
- (38) V. Acharya and M. Richardson, Crit. Rev. 21, 195 (2009).
- (39) F. X. Diebold and K. Yilmaz, in T. Bollerslev, J. Russell and M. Watson (Eds.) Volatility and Time Series Econometrics: Essays in Honor of Robert Engle (Oxford Univ. Press, Oxford, 2010).