RESOLVING THE POWERFUL RADIO-LOUD QUASAR AT
Abstract
We present high angular resolution imaging ( mas, pc) of the radio-loud quasar PSO J352.403415.3373 at with the Very Long Baseline Array (VLBA) at 1.54 GHz. This quasar has the highest radio-to-optical flux density ratio at such a redshift, making it the radio-loudest source known to date at . The VLBA observations presented here resolve this quasar into multiple components with an overall linear extent of 1.62 kpc () and with a total flux density of mJy, which is about half of the emission measured at a much lower angular resolution. The morphology of the source is comparable with either a radio core with a one-sided jet, or a compact or a medium-size Symmetric Object (CSO/MSO). If the source is a CSO/MSO, and assuming an advance speed of , then the estimated kinematic age is yr.
1 Introduction
The source PSO J352.403415.3373 (hereafter P352–15) has been identified as a luminous quasar at (Bañados et al., 2018). The optical spectrum shows the typical broad emission lines of a high-redshift quasar, plus a possible associated broad absorption line (BAL) system. Karl G. Jansky Very Large Array (VLA) observations at 3 GHz show that the quasar is associated with a radio source that has a flux density of mJy and a size . At 1.4 GHz, the flux density of the source is mJy (Condon et al., 1998). The source is also detected at lower frequencies in both the TIFR GMRT Sky Survey (TGSS; Intema et al. 2017) and the GaLactic and Extragalactic All-sky MWA Survey (GLEAM; Hurley-Walker et al. 2017), with a flux density of around 100 mJy at 200 MHz. The implied rest frame 1.4 GHz luminosity density is W Hz-1 (Bañados et al., 2018).
This quasar is the brightest of any known radio source at . With a radio loudness parameter of , P352–15 is about an order of magnitude more radio loud than any other quasar at these redshifts (Bañados et al., 2015, 2018). The discovery of the quasar is reported in the companion paper (Bañados et al., 2018) which presents its optical spectrum, its identification as a bright radio source using new VLA data as well as available public surveys, and its radio spectral energy distribution.
In this paper we present 1.54 GHz Very Long Baseline Interferometry (VLBI) imaging of this source. These observations reveal a morphology that is consistent with a radio galaxy but with a linear projected size of only 1.62 kpc, or a radio core with a one-sided jet. We discuss the Very Long Baseline Array (VLBA) result in the context of quasar-mode feedback during the earliest formation of active galactic nuclei (AGN) and the most massive galaxies. We adopt a flat cosmology with Mpc-1, , and . At the redshift of this quasar, 1″ corresponds to 5.8 kpc.
2 Observations and Data Reduction
The VLBI observations of the P352–15 were carried out at 1.54 GHz on 2018 January 23, using the VLBA of the Long Baseline Observatory (LBO).111The Long Baseline Observatory is a facility of the National Science Foundation operated under cooperative agreement by Associated Universities, Inc. Eight 32 MHz data channel pairs were recorded at each station using the ROACH Digital Backend and the polyphase filterbank (PFB) digital signal-processing algorithm, both with right- and left-hand circular polarizations, and sampled at two bits. The total bandwidth was 256 MHz centered at 1.54 GHz. The total observing time was 2 hr.
The VLBA observations employed nodding-style phase referencing using the nearby calibrator J23271447 with a cycle time of 3.5 min: 2.75 min on the target and 0.75 min on the calibrator. This calibrator is at an angular distance of from the target source. The accuracy of the phase calibrator position is important in phase-referencing observations (Walker, 1999), because it determines the accuracy of the absolute position of the target and its components, if any. The uncertainty in the position of the phase calibrator is 0.09 mas in right ascension and 0.13 mas in declination (Fey et al., 2015). Phase referencing, as utilized in these observations, is known to preserve absolute astrometric positions to better than (Fomalont, 1999). The calibrator source 3C 454.3 was used as a fringe finder and bandpass calibrator. Amplitude calibration was performed using measurements of the antenna gain and the system temperature of each station. The data were correlated with the VLBA DiFX correlator (Deller et al., 2011) in Socorro, New Mexico, with 2 s correlator integration time.
Data reduction and analysis were performed using the Astronomical Image Processing System (AIPS: Greisen 2003) following standard VLBI data reduction procedures. The phase reference source was self-calibrated, and the solutions were applied on the target. The continuum emission from the target was then deconvolved and imaged using a grid weighting between natural and uniform (Robust=0 in AIPS task IMAGR).
3 Results and Analysis
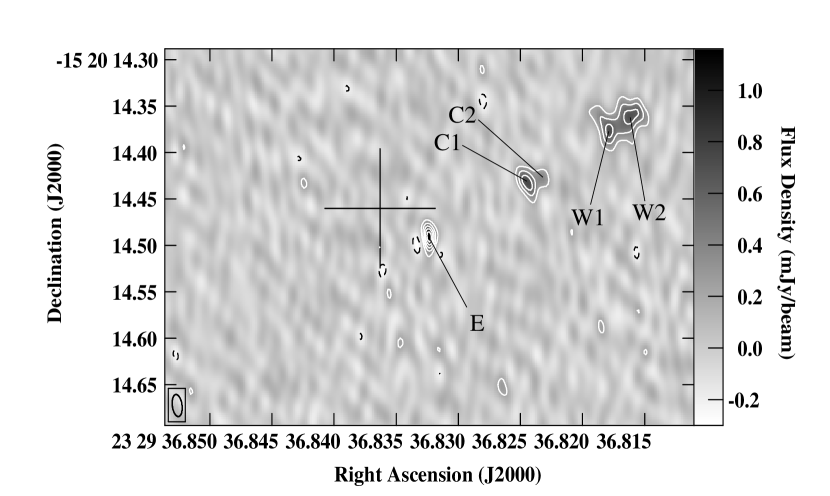
Figure 1 shows the 1.54 GHz image obtained on the target source P352–15 with the VLBA at an angular resolution of mas ( pc at ) with a position angle of P.A.=. The rms noise in the image is 67 Jy beam-1. The observing frequency of 1.54 GHz corresponds to a rest frame frequency of 10.53 GHz. The continuum emission from P352–15 is resolved into three main structures with an overall linear extent of 1.62 kpc () at P.A.= . From east to west, we denote these structures as E (east), C (center), and W (west). The E structure is dominated by a single component, while the C and W structures are resolved into multiple components. We performed Gaussian fitting on these structures with a single component on E, and two components on each of C and W. Table 1 lists the Gaussian fit parameters of the continuum features in P352–15. Column (1) denotes the names of the components. Column (2) lists the relative distance of each component with respect to the stronger of the two center sources, C1, and column (3) lists their flux densities. Column (4) gives the nominal or maximum (upper limit) deconvolved sizes for the major and minor axes of each component, and column (5) reports the corresponding intrinsic brightness temperature values (i.e., at the rest frame frequency of 10.53 GHz), or their lower limits. The components listed in Table 1 are marked in Figure 1. The absolute positional accuracy of the phased-referenced VLBA image (Figure 1) and the VLBA detected sources listed in Table 1 is expected to be better than (see Section 2 for further details). We note that Gaussian component fitting, as listed in Table 1, provides a convenient measure of the source structure even if they do not necessarily represent discrete physical structures.
The optical position of P352–15 is taken from the Pan-STARRS1 (PS1) catalog (Chambers et al., 2016). Positions in the PS1 catalog are calibrated using Gaia Data Release 1 (see Magnier et al. 2016). We verified the astrometry of the PS1 catalog by comparing the coordinates of 70 objects within 5′ of P352–15 with positions listed in Gaia Data Release 2 (Gaia DR2, Gaia Collaboration 2016, 2018). We find a mean shift in right ascension and declination of mas and mas, respectively. We conclude that the differences in the position of objects near the quasar in the PS1 and Gaia DR2 catalogs are negligible, and we take the PS1 coordinates of the quasar for its optical position. The optical quasar coordinates are R.A. (J2000)= 23h29m36.8363s, Decl. (J2000)= 15∘20′14460, with an uncertainty of mas in both right ascension and declination.
The total flux density of P352–15measured with the VLBA at 1.54 GHz is mJy. The flux density measured with the VLA at 1.4 GHz is mJy (Condon et al., 1998), and at 3 GHz is mJy (Bañados et al., 2018), resulting in a spectral index between 1.4 and 3 GHz of (adopting ). This suggests that the total flux density of the source at 1.54 GHz would be 13.83 mJy. Therefore, with the resolution of the VLBA, we are only recovering about half of the total flux density of the source.
These spatially resolving observations can be used to calculate at least a minimum pressure in the radio source, through the standard synchrotron minimum energy arguments. We use the equations in Miley (1980), and assume a proton-to-electron number ratio and a filling factor for the synchrotron emitting fluid of unity and a minimum and maximum frequency for the emission of 0.01 GHz to 10 GHz. The typical observed surface brightness for the resolved components in Table 1 is Jy arcsec-2, and the line-of-sight depth, assuming rotation symmetry, is about 0.1 kpc. The implied minimum pressure is dyne cm-2, and the corresponding magnetic field strength is mG. For comparison, the hot spots of large ( kpc) classical double radio galaxies, such as Cygnus A, have fields about an order of magnitude smaller and pressures two orders of magnitude smaller (Carilli & Barthel, 1996).
4 Discussion
We have detected the quasar P352–15 at 1.54 GHz with the VLBA at mas resolution. The observations show that the radio source is comprised of several components with a maximum angular separation of (1.62 kpc). The total flux density measured with the VLBA is mJy, suggesting that about half of the radio emission associated with the quasar is resolved out, or below our detection threshold. P352–15, which is believed to be near the end of the epoch of reionization, would be an excellent candidate for HI 21 cm absorption experiments to detect the neutral intergalactic medium (IGM) at such high redshifts (Carilli et al., 2002; Furlanetto & Loeb, 2002; Greig & Mesinger, 2017). Knowledge of the source structure, as presented herein, is critical for both identifying potential candidates for neutral hydrogen absorption searches and for subsequent interpretation of the results.
We consider two possible interpretations of the morphology seen in the VLBA image of P352–15 (Figure 1): (i) a radio core with a one-sided jet, and (ii) a classic, but compact, Fanaroff–Riley Class II (FRII) source. With the available data, both scenarios remain viable, even though the proximity of the optical position to the E component makes the core with a one-sided jet interpretation more likely. Multifrequency VLBI observations are needed to measure the spectra of the various components seen in P352–15 in order to identify a flat spectrum core in this source and determine its exact nature.
4.1 A Radio Core with a One Sided Jet
In the scenario that the source is a radio core with a one-sided jet, component E (see Figure 1 and Table 1) is the core, and the C and W components are part of a one-side jet structure. The E component is within of the optical position of the quasar. If the source is indeed a one-sided jet, P352–15 becomes the most distant source in which to study relativistic jet expansion.
The maximum jet apparent proper motion of mas yr-1 is predicted at the highest redshifts based on a maximum jet Lorentz factor of 25 (Kellermann et al., 2004; Frey et al., 2015). VLBI studies of the radio blazar J1026+2542 at (Frey et al., 2015) and the quasar J21340419 at (Perger et al., 2018) are at least consistent with this prediction. The maximum jet apparent proper motion limit noted above corresponds to 1 mas in a 5 year time baseline. Such a proper motion could be measured in P352–15 via sensitive astrometric VLBI observations. Furthermore, if a proper motion of substantially greater than mas yr-1 is observed in P352–15, then, according to the analysis presented by Kellermann et al. (2004), this would be the jet with the highest Lorentz factor. Overall, currently there are only a few radio sources with jets known at (e.g., Frey et al. 2015), hence it is crucial to have more such sources in order to study and test the apparent proper motion – redshift relation at these high redshifts.
4.2 A Compact FRII Radio Morphology: A CSO/MSO
In the scenario that the source is a compact FRII radio galaxy, the radio core will be in the C region, while the E and the W components will be the edge-brightened radio lobes separated by 1.62 kpc. The C region is within of the optical position of the quasar. Contrary to typical FRII sources that span linear extents of 10s to 100s of kpc, this source has an extent of only 1.62 kpc, placing this high- radio-loud quasar near the transition between the category of compact symmetric objects: CSO = FRII radio sources with sizes kpc, and medium-size symmetric objects: MSO = FRII radio sources with sizes kpc (Readhead et al., 1996a; Owsianik & Conway, 1998; Conway, 2002).
CSOs and MSOs are considered to be young radio galaxies with powerful radio jets that are strongly confined by the ISM in the center of the host galaxy (Conway, 2002). Taylor et al. (2000) present the most detailed VLBI imaging analysis of a small sample of CSOs with sizes ranging from 20 pc to 100 pc. They measure projected advance speeds for the hot spots around , and source ages of a few hundred to 1000 years. The minimum pressures in the radio hot spots are of the order of dyne cm-2 (Readhead et al., 1996b).
The most distant CSO found to date is the quasar, J1427+3312 (Frey et al., 2008; Momjian et al., 2008). The difference is that P352–15 is about 10 times more luminous in the radio and about 10 times bigger in projected linear size, than J1427+3312. At a lower redshift of , the bright radio galaxy TN J0924-2201 is an order of magnitude more luminous in the radio than P352–15. However, TN J0924-2201 is larger in extent by a factor of compared to P352–15 (van Breugel et al., 1999). This may suggest that P352–15 is embedded in a denser environment and/or a younger radio source when compared to TN J0924-2201.
Using the minimum pressure calculated in Section 3, we can compute a hot spot advance speed assuming ram-pressure confinement. In this case, , where is the mass density of the external medium. Unfortunately, we do not have an estimate of . If we were to adopt the average density of the ISM in the plane of the Milky Way of cm-3, then the implied advance speed is , which is comparable to what may be typical for CSOs (Readhead et al., 1996a). In some coeval starburst-QSO systems at , an analysis of CO excitation levels suggests much higher densities, approaching cm-3 (see Carilli & Walter 2013). The ISM density on sub-kpc scales in nearby AGN can be of the order of 100 cm-3, or greater (Morganti et al., 2013). Higher densities imply a lower advance speed and larger age. However, if the jets are emerging along the axis of a disk galaxy, relevant densities may correspond to the galaxy halo, and hence could be much lower, implying a higher advance speed and a younger age.
Assuming an advance speed of , as derived using the minimum pressure argument, and the average density of the ISM in the plane of the Milky Way, then the age of the source is years. However, if the advance speed in P352–15 is similar to that measured in low redshift CSOs through multi-epoch VLBI imaging (Taylor et al., 2000), which is , then the derived kinematic age of the source is years.
We emphasize here that the implied source advance speed and age cannot be robustly determined until either the ISM density is determined or until a direct measurement of hot spot motions is made. The former might be possible with ALMA observations of millimeter line or dust emission. The latter would likely require multi-epoch VLBI observations at very high resolution and sensitivity. For instance, if the advance speed is on the plane of the sky, then the separation between the hot spots increases by , and in one year the hot spots will separate by pc. The angular size distance at the redshift of the quasar is 1195.3 Mpc; therefore, the separation between the hot spots would increase at arcsec yr-1. Taylor et al. (2000) measured angular separation rates ranging between 5 and 80 arcsec yr-1 in low-redshift CSOs with the VLBA at 15 GHz through multi-epoch observations spanning up to 5 years. However, these low-redshift CSOs and their components are significantly brighter compared to P352–15 and its components. Therefore, if the source is a CSO/MSO, the apparent proper motion will be much less compared to the one-sided jet scenario. Such measurements will likely require a future VLBI array that would include ultra-sensitive elements, such as the Next Generation Very Large Array (ngVLA222ngvla.nrao.edu) and the Square Kilometre Array (SKA333www.skatelescope.org).
The extreme redshift and strong radio emission from P352–15 presents a unique potential to constrain feedback processes in the first galaxies. Radio jets are hypothesized to play a defining role in massive galaxy formation, through negative or “radio mode feedback”, in which the radio jets evacuate the ISM of the host galaxy (Silk et al., 2013). Because CSOs/MSOs are highly confined sources, they are thought to have higher conversion efficiency of jet kinetic energy to radio luminosity. This process has been studied in detail on pc-scales in lower-redshift CSOs, such as 4C12.50 (Morganti et al., 2013, 2015). A recent possible analogy on larger scales is 3C 298 at (Vayner et al., 2017). In this case, the radio source is 10 times larger than P352–15. Still, imaging of the ionized and molecular gas and dust in the host galaxy implies that a strong outflow is being driven by either the expanding radio source and/or a wind from the luminous AGN.
We can only speculate at the present that P352–15 will exhibit clear signs of radio-mode feedback, although an interesting similarity between this quasar and 3C 298 is a likely associated BAL system in the optical spectrum of P352–15 (Bañados et al., 2018). BALs are thought to be indicative of strong nuclear outflows. Further ALMA and VLBI observations are planned to determine the ISM properties of the host galaxy and the radio source properties in great detail.
References
- Bañados et al. (2015) Bañados, E., et al., 2015, ApJ, 804, 118
- Bañados et al. (2018) Bañados, E., et al., 2018, ApJ, in press
- Carilli & Barthel (1996) Carilli, C. L., & Barthel, P.D. 1996, A&A Rv. 7, 1
- Carilli et al. (2002) Carilli, C. L., Gnedin, N. Y., & Owen, F. 2002, ApJ, 577, 22
- Carilli & Walter (2013) Carilli, C. L., & Walter, F. 2013, ARA&A, 51, 105
- Chambers et al. (2016) Chamvers, K. C., 2016, arXiv:1612.05560
- Condon et al. (1998) Condon, J. J., Cotton, W. D., Greisen, E. W., et al. 1998, AJ, 115, 1693
- Conway (2002) Conway, J. 2002, NewA Rev., 46, 263
- Deller et al. (2011) Deller, A. T., Brisken, W. F., Phillips, C. J., et al. 2011, PASP, 123, 275
- Fey et al. (2015) Fey, A. L., et al., 2015, AJ, 150, 58
- Fomalont (1999) Fomalont, E. B. 1999, in ASP Conf. Ser. 180, Synthesis Imaging in Radio Astronomy II, ed. G. B. Taylor, C. L. Carilli, & R. A. Perley (San Francisco, CA: ASP), 301
- Frey et al. (2008) Frey, S., Gurvits, L. I., Paragi, Z., & Gabanyi K. E. 2008, A&A, 484, L39
- Frey et al. (2015) Frey, S., Paragi, Z., Fogasy, J. O., Gurvits, L. I. 2015, MNRAS, 446, 2921
- Furlanetto & Loeb (2002) Furlanetto, S., & Loeb, A. 2002, ApJ, 579, 1
- Gaia Collaboration (2016) Gaia Collaboration 2016, A&A 595, id.A1
- Gaia Collaboration (2018) Gaia Collaboration 2018, arXiv:1804.09365
- Greig & Mesinger (2017) Greig, B., & Mesinger A. 2017, MNRAS, 472, 2651
- Greisen (2003) Greisen, E. W. 2003, Information Handling in Astronomy - Historical Vistas, 285, 109
- Intema et al. (2017) Intema, H. T., Jagannathan, P., Mooley, K. P., & Frail, D. A. 2017, å, 598, A78
- Hurley-Walker et al. (2017) Hurley-Walker, N., Callingham, J. R., Hancock, P. J., et al. 2017, MNRAS, 464, 1146
- Kellermann et al. (2004) Kellermann, K. I., et al. 2004, ApJ, 609, 539
- Magnier et al. (2016) Magnier et al. 2016, arXiv:1612.05242
- Miley (1980) Miley, G. 1980, ARA&A, 18, 165
- Momjian et al. (2008) Momjian, E., Carilli, C. L., McGreer, I. D. 2008, AJ, 136, 344
- Morganti et al. (2013) Morganti, R., Fogasy, J., Paragi, Z. Oosterloo, T., Orienti, M. 2013, Sci, 341, 1082
- Morganti et al. (2015) Morganti, R., Sadler, E. M., Curran, S., 2015, in Advancing Astrophysics with the Square Kilometre Array (AASKA14), 134
- Owsianik & Conway (1998) Owsianik, I., & Conway, J. E. 1998, A&A, 337, 69
- Perger et al. (2018) Perger, K., et al. 2018, MNRAS, 477, 1065
- Readhead et al. (1996a) Readhead, A. C. S., Taylor, G. B., Xu, W., Pearson, T. J., Wilkinson, P. N., & Polatidis, A. G. 1996, ApJ, 460, 612
- Readhead et al. (1996b) Readhead, A. C. S., Taylor, G. B., Pearson, T. J., & Wilkinson, P. N. 1996, ApJ, 460, 634
- Schwarz et al. (2011) Schwarz, G. J., Ness, J.-U., Osborne, J. P., et al. 2011, ApJS, 197, 31
- Silk et al. (2013) Silk, J., Di Cintio, A., & Dvorkin, I. 2013, arXiv:1312.0107
- Taylor, Readhead, & Pearson (1996) Taylor, G. B., Readhead, A. C. S., & Pearson, T. J. 1996, ApJ, 463, 95
- Taylor et al. (2000) Taylor, G. B., Marr, J. M., Pearson, T. J., & Readhead, A. C. S. 2000, ApJ, 541, 112
- van Breugel et al. (1999) van Breugel, W., et al. 1999, ApJ, 518, 61
- Vayner et al. (2017) Vayner, R., Wright, S. A., Murray, N., Armus, L., Larkin, J. E., & Mieda, E. 2017, ApJ, 851, 126
- Walker (1999) Walker, C. R. 1999, in Synthesis Imaging in Radio Astronomy II, ed. G. B. Taylor, C. L. Carilli, & R. A. Perley (San Francisco: ASP), 433
| Relative PositionaaThe position (0,0) is , . | Flux Density | Deconvolved Size | TbbAt the rest frame frequency of 10.53 GHz. | ||
|---|---|---|---|---|---|
| Source | (mas) | (mJy) | (mas) | (K) | |
| (1) | (2) | (3) | (4) | (5) | |
| E | 114E, 57S | ||||
| C1 | 0, 0 | ||||
| C2 | 16W, 6N | ||||
| W1 | 92W, 59N | ||||
| W2 | 119W, 70N |