Fundamentally fastest optical processes at the surface of a topological insulator
Abstract
We predict that a single oscillation of a strong optical pulse can significantly populate the surface conduction band of a three-dimensional topological insulator, . Both linearly- and circularly-polarized pulses generate chiral textures of interference fringes of population in the surface Brillouin zone. These fringes constitute a self-referenced electron hologram carrying information on the topology of the surface Bloch bands, in particular, on the effect of the warping term of the low-energy Hamiltonian. These electron-interference phenomena are in a sharp contrast to graphene where there are no chiral textures for a linearly-polarized pulse and no interference fringes for circularly-polarized pulse. These predicted reciprocal space electron-population textures can be measured experimentally by time resolved angle resolved photoelectron spectroscopy (TR-ARPES) to gain direct access to non-Abelian Berry curvature at topological insulator surfaces.
I Introduction
Topological insulators (TI’s) represent a modern class of crystalline materials where the bulk is semiconducting and the surfaces are semimetallic Fu et al. (2007); Hsieh et al. (2009); Hasan and Kane (2010); Bansil et al. (2016). The -point of the surface-state band is a Dirac point where the electron dispersion is linear as characteristic of Dirac fermions. There is locking of spin and linear momentum caused by spin-orbit interaction. This provides protection against back scattering and Anderson localization. The absence of the bandgap and, consequently, the linear electron dispersion at the -point, are protected by time-reversal () symmetry. The Bloch bands near the Dirac point are chiral and carry the Berry phase of .
To resolve chirality of the surface states of TI’s and related spin textures one has to use chiral tools: circularly polarized excitation radiation Wang et al. (2011, 2013); Sanchez-Barriga et al. (2014) or detection of the spin state of electrons in spin resolved angle resolved photoemission spectroscopy (SR-ARPES) Hsieh et al. (2009). A unique property of the surface bands of a TI – band-dependent locking of the spin and momentum – allows one to manipulate the spin states by controlling the electron momentum in the Bloch bands. Keeping in mind both fundamental interest and spintronics applications, it is important to perform such manipulation as fast as possible, that is within a single optical cycle. Such ultrafast manipulation would allow avoiding significant relaxation, including quantum decoherence during the excitation cycle. It also would open up unique possibilities for ultrafast, PHz-band scale, information processing. Note that the existing experiments on TI’s employed relatively long ( fs) excitation pulses of moderate field amplitudes Wang et al. (2013), .
The goal of this article is to show theoretically for a 3D TI a possibility to manipulate electron population, crystal momentum and, consequently spin, in a fundamentally fastest way – during only single cycle of a chiral optical pulse with a moderately strong optical field, . We have predicted such ultrafast processes earlier for graphene both for linear polarization Kelardeh et al. (2015) and circular polarization Kelardeh et al. (2016, 2017). Electrical currents and charge transfer associated with ultrafast strong-field excitation of graphene have been recently observed experimentally Higuchi et al. (2017). The underlying chiral distributions of excited electrons in the full Brillouin zone in both the conduction band (CB) and valence band (VB) can fundamentally be observed using time resolved ARPES (TR-ARPES) Liu et al. (2011); Gierz et al. (2013); Crepaldi et al. (2013). However, such studies have not yet been done.
We predict that, similar to graphene, a significant CB population is induced during a single optical oscillation. The main mechanism responsible for this process is Bloch motion of electrons in reciprocal space induced by strong optical fields. In contrast to graphene, the resulting electron CB distribution in the reciprocal space is highly anisotropic and chiral; to a significant degree it is defined by the so-called warping terms in the effective Hamiltonian Liu et al. (2010a). The electron relaxation, which follows the excitation pulse, will cause surface currents and generation of THz radiation. The latter also provides an access to the initial CB electron distribution Braun et al. (2016). Yet another approach to get access to the electron distribution of the surface CB in TIs is ultrafast time-resolved transient reflectivity and Kerr rotation Wang et al. (2016).
Specifically, in this work, we study ultrafast electron dynamics on the surfaces of a 3D TI , which has a bulk bandgap of 0.3 eV and gapless surface states Liu et al. (2010b); Cava et al. (2013); D. Glinka et al. (2015). These gapless surface states are protected by the time reversal symmetry and possess a single Dirac cone located at the point in the reciprocal space Liu et al. (2010b); Zhang et al. (2009a, b); Feng and Yao (2012). Similar to graphene, the interband dipole coupling at the surface of 3D TI is singular at the Dirac point, and the energy dispersion near the Dirac point is linear (quasi-relativistic). The main difference from graphene is that the effective low-energy Hamiltonian in 3D TI’s has large nonlinear (cubic) terms. Such terms, which are known as the warping terms, lower the point symmetry of the system to three-fold (C3) Liu et al. (2010a). This lower symmetry results in unique features in the ultrafast electron dynamics. In particular, as we show below in this article, for a single-oscillation circularly-polarized pulse, the CB population distribution in the reciprocal space shows a pronounced chirality and a pattern of interference fringes.
Because surface Bloch bands of a TI are gapless, the processes of the electron transfer between the valence band (VB) and CB is non-resonant and, consequently, broadband. Therefore, the dependence on the mean (carrier) frequency or duration of the pulse is very smooth. As an example we choose a pulse with duration of 5 fs (carrier frequency ). This duration is chosen to be shorter than the fastest electron scattering time Braun et al. (2016) in TI’s, which is fs. The pulse electric field causes electron motion in the reciprocal space within each band where the crystal momentum excursion is defined by the Bloch acceleration theorem – see Eq. (7) below. The transitions occur when an electron passes in a vicinity of the Dirac point ( point) or other points where the interband transition dipole matrix element is enhanced. The excursion of electron crystal momentum during the pulse can estimated as , where is unit charge and is the field amplitude. To travel a half of the Brillouin zone, this excursion should be , where is a lattice constant. Assuming , we obtain . Correspondingly, we consider a field amplitude range that includes this value, .
The paper is organized as follows. In Section II, a model and main equations, which are used to calculate the electron dynamics in the presence of ultrafast external electric fields, are introduced. In Section III, the results for linearly and circularly polarized pulses are presented and discussed.
II MODEL AND MAIN EQUATIONS
An effective low-energy surface Hamiltonian of near the Dirac point has the following form Liu et al. (2010a)
| (1) |
where , , and are Pauli matrices, is crystal momentum, , , and , , and are constants that are equal to 23.725 , 3.297 , and 25.045 , respectively. The cubic term in this low-energy Hamiltonian is called the hexagonal warping term (2009). The energies of the VB and the CB can be found from the above Hamiltonian as
| (2) |
where indices and stand for the CB and VB, respectively. Near the -point (for ), this dispersion simplifies to two Dirac cones: . This energy dispersion is displayed in Fig. 1 where the point is at . Below we assume that the system is undoped, with the Fermi energy at 0, where the VB is fully occupied and the CB is completely empty. This energy dispersion has sixfold symmetry (see Fig. 1(b)), which is due to the warping term.
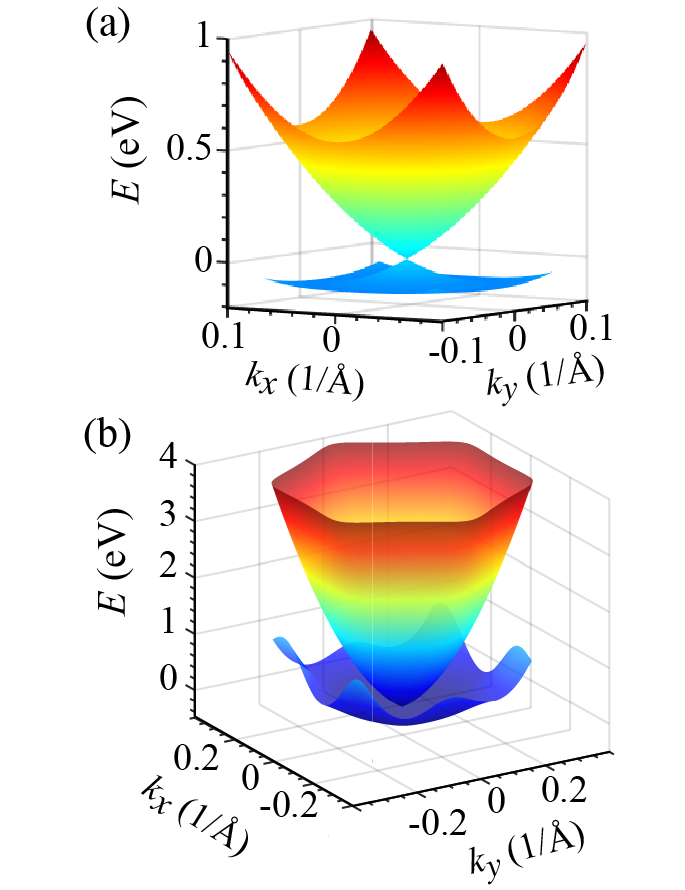
As we have already argued above in Sec. I, during an ultrashort optical pulse with the duration of fs, electron dynamics is coherent since the electron scattering times in are fs. Then the evolution of the system can be described by the time-dependent Schrödinger equation (TDSE),
| (3) |
with Hamiltonian
| (4) |
where is the pulse’s electric field, and is electron charge.
We will be employing moderately high field amplitudes, . At such intensities, the number of photons, , per pulse within the minimum coherence area of , where is wavelength,
| (5) |
where is speed of light; we assume realistic parameters: is the pulse duration, and is the mean photon energy. With such a large photon number involved, it is legitimate to describe as a classical electric field keeping quantum-mechanical description of the solid. This is a usual approach in high-field optics – see, e.g., Refs. Corkum and Krausz, 2007; Krausz and Ivanov, 2009; Krausz and Stockman, 2014. Note that quantized optical fields are used for much lower intensities Kibis (2010); Kristinsson et al. (2016); such an approach is not needed at our fields. With classical field , we solve the Schrödinger equation in the basis chosen numerically without further approximations. Our pulse is just a single optical oscillation; therefore field is not periodic, and its effect cannot be described as band gap opening as in Ref. Kibis, 2010. However, the dynamic Stark effect and other field-dressing effects during the pulse are fully taken into account by our solution.
In solids, the applied electric field generates both the intraband and interband electron dynamics. The intraband dynamics is determined by the Bloch acceleration theorem Bloch (1929),
| (6) |
From this, for an electron with an initial crystal momentum , time-dependent crystal momentum is expressed as
| (7) |
The corresponding wave functions, which are solutions of the Schrödinger equation (3) within a single band , i.e., without interband coupling, are the well-known Houston functions Houston (1940),
| (8) |
where for the VB and CB, correspondingly, and are Bloch-band eigenfunctions in the absence of the pulse field, and are the corresponding eigenenergies.
The interband electron dynamics is determined by the solution of the TDSE (3). Such a solution can be expressed in the basis of the Houston functions ,
| (9) |
where are expansion coefficients, which satisfy the following system of coupled equations
| (10) |
where
| (11) | |||
| (12) | |||
| (13) |
Here and are eigenfunctions of the Hamiltonian without an optical field, ; matrix element is the well-known non-Abelian Berry connection Wilczek and Zee (1984); Xiao et al. (2010); Yang and Liu (2014); is the interband dipole matrix element, which determines optical transitions between the VB and the CB at crystal momentum , and is the dynamic phase; the trajectory in the reciprocal space, , is given by the Bloch theorem (7).
Note that fundamentally Eq. (10) is a Schrödinger equation in the interaction representation in the adiabatic basis of the Houston functions, where the wave function is a two-component state vector . This equation defines the exact solution for dynamics of the system, which is limited only by the size of the basis set (i.e., truncation of the Hilbert space of the surface states of the TI). In particular, it contains such phenomenon as bandgap opening in the field of a circularly-polarized pulse
We introduce components of non-Abelian Berry connection as a vector . Substituting the eigenfunctions of the field-free Hamiltonian (1) into Eq. (13), we obtain for its components
| (14) | |||||
| (15) | |||||
where normalization coefficient is
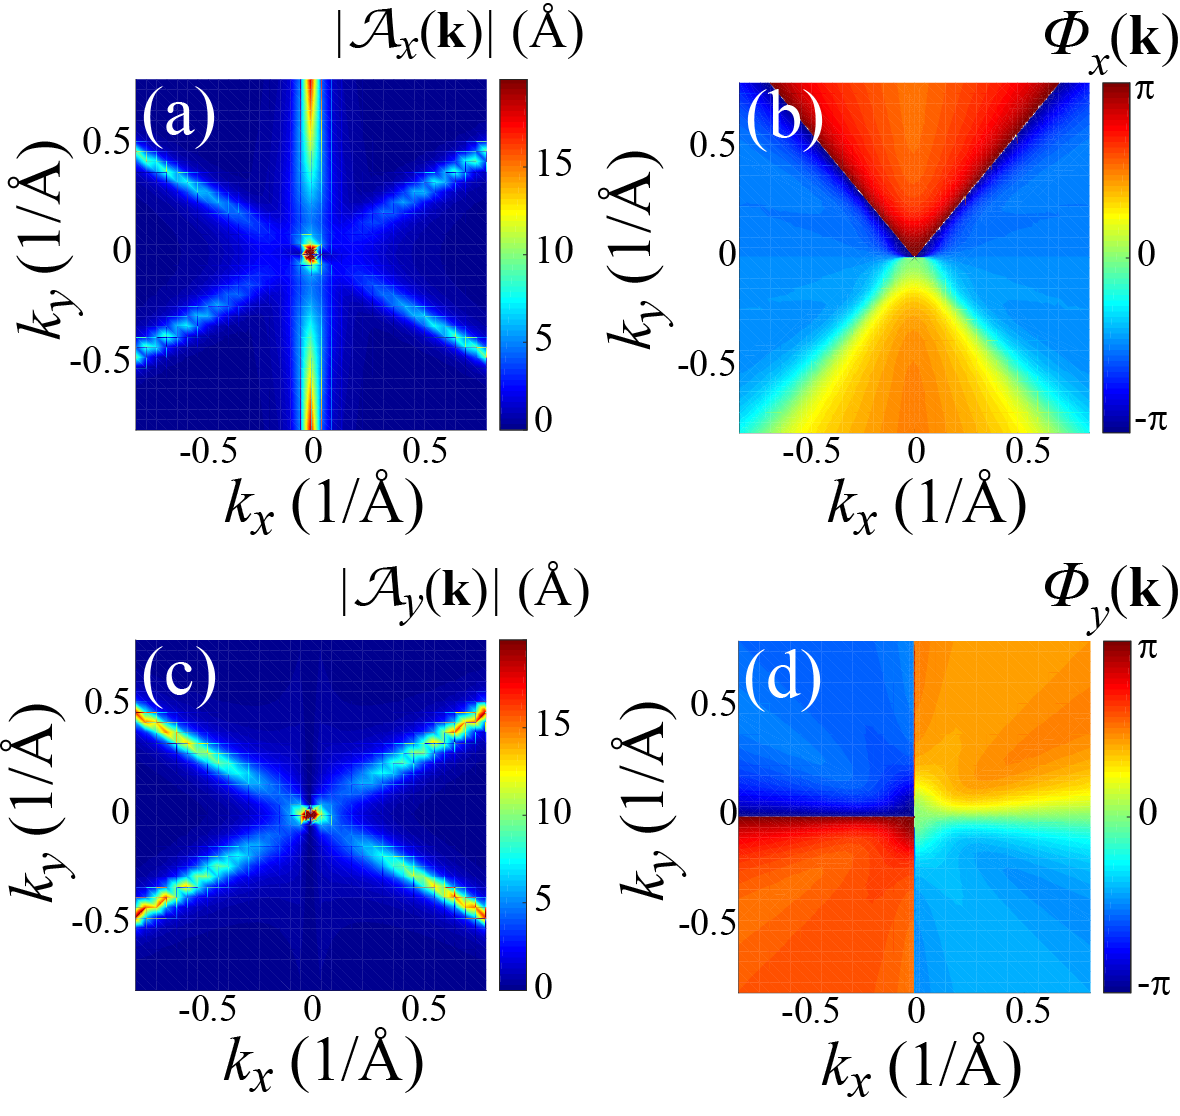
Similar to graphene, there are singularities at the Dirac point, , for both and – see Fig. 2. However, unlike graphene, and have both imaginary and real parts due to the warping term in surface Hamiltonian (1). Consequently, there is a nontrivial dependence on angle, : the components of the non-Abelian Berry connection, and , exhibit sharp maxima along six and four ridges, which are clearly seen in Figs. 2 (a) and (c), respectively.
When an electron is compelled by the optical field to move within a band, the transitions will occur when its trajectory , which is defined by the Bloch acceleration theorem (7)], crosses these ridges and passes in the vicinity of the Dirac point. The corresponding transition amplitudes will interfere generating a texture of fringes in the reciprocal space.
We solve Eqs. (10) numerically with an initial condition corresponding to an occupied VB and an empty CB ( and ). Below we characterize the electron dynamics in terms of the residual CB population as a function of crystal momentum, , and the mean residual CB population
| (16) |
where denotes average over crystal momentum in the first Brillouin zone.
Compare results for 3D TI with the corresponding results for graphene where low-energy Dirac Hamiltonian is
| (17) |
where is the Fermi velocity. Then the energies of the CB and VB are
| (18) |
The corresponding components of the non-Abelian Berry connection are
| (19) | |||||
| (20) |
These are obviously real quantities in contrast to Eqs. (14) and (15).
III Results and discussion
III.1 Linearly polarized pulse
We apply a linearly-polarized single-oscillation optical pulse incident normally to the surface of 3D TI. The electric field waveform of the pulse is parametrized in the following form
| (21) |
where , is the amplitude of the field, , fs, and is the polarization angle of the applied field. Before the pulse, the CB is empty, and the VB is fully occupied. During the pulse, the electron dynamics is characterized by redistribution of electrons between the VB and the CB. After the pulse, there is a significant residual CB population – see Fig. 3 – manifesting irreversibility of the electron due to related to the gapless spectrum of the TI’s surface states. Note that an earlier work Schiffrin et al. (2012, 2012); Kwon et al. (2016); Krausz and Stockman (2014) showed that strong-field induced CB population is highly reversible, i.e., disappearing after the pulse end, for insulators such as silica and alumina (quartz and sapphire). This reversibility is due to the presence of a wind bandgap ( eV) between the VB and the CB, which significantly exceeds the characteristic frequency of the excitation pulse. Such a condition causes the CB population to adiabatically follow the magnitude (modulus) of the pulse field, . This is not the case for TI’s since their surface-band spectrum is gapless.
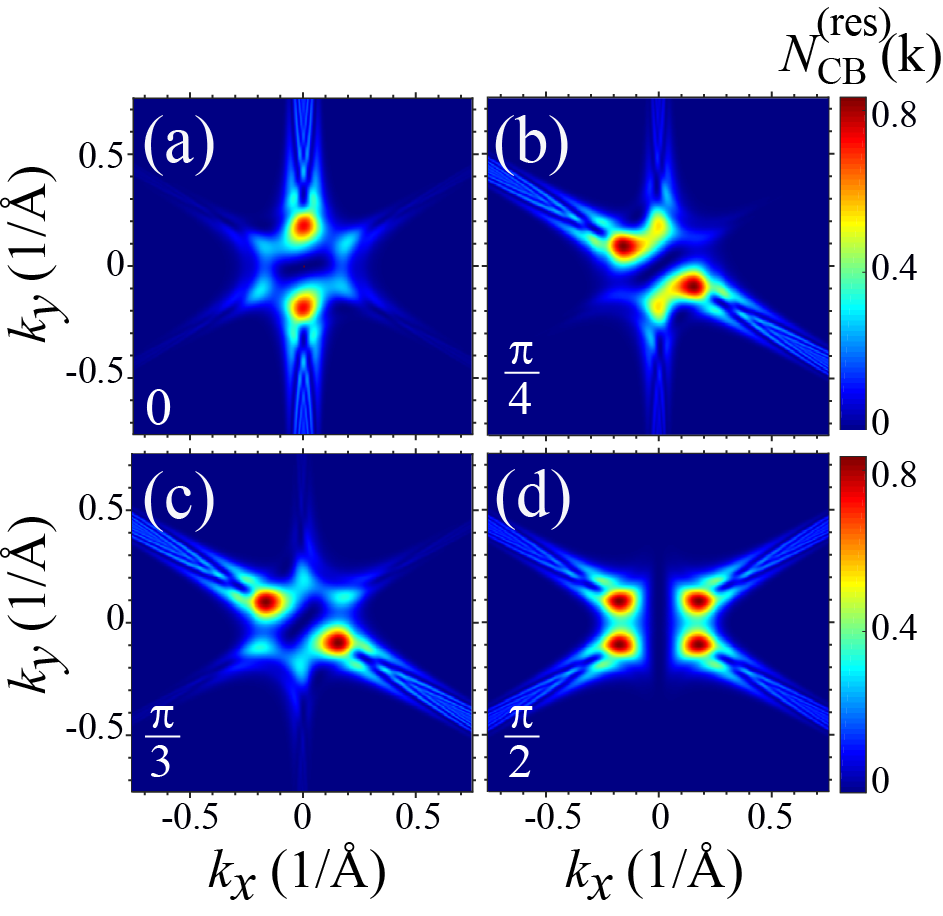
The distribution of the residual CB population in the first Brillouin zone of the surface bands of is shown in Fig. 3 for different angles between the polarization direction and wthe positive axis: (a) , (b) , (c) , and (d) . The amplitude of the electric field is . There is a pattern of “hot spots” with a large CB population and interference fringes are clearly visible. The pair of hot spots seen in each panel is an image of the Dirac point split by a dark line passing through the -point in the polarization direction. Note that this dark line originate from electron passing twice through a Dirac point, which results in its return back to the VB and the zero CB population. This can also be interreted as a result of the pseudospin conservation. The interference fringes farther from the Dirac popint in Figs. 3 (a)-(c) show a pronounced chirality. These fringes originate from the electron transitions caused the warping term and replicate its symmetry.
The components of the non-Abelian Berry connection, which are responsible for the interband coupling for a given direction of polarization, are and for and , respectively. The distribution of follows the profile of the corresponding components, and , see Fig. 3 (a) and (d), respectively.
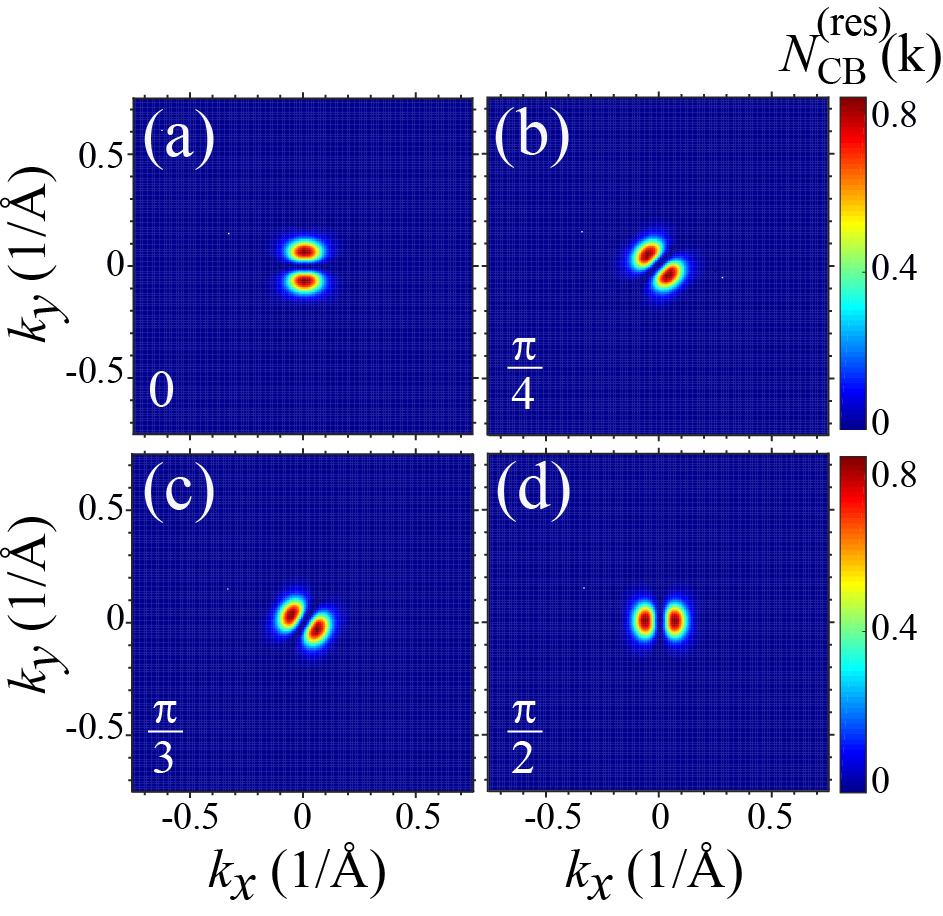
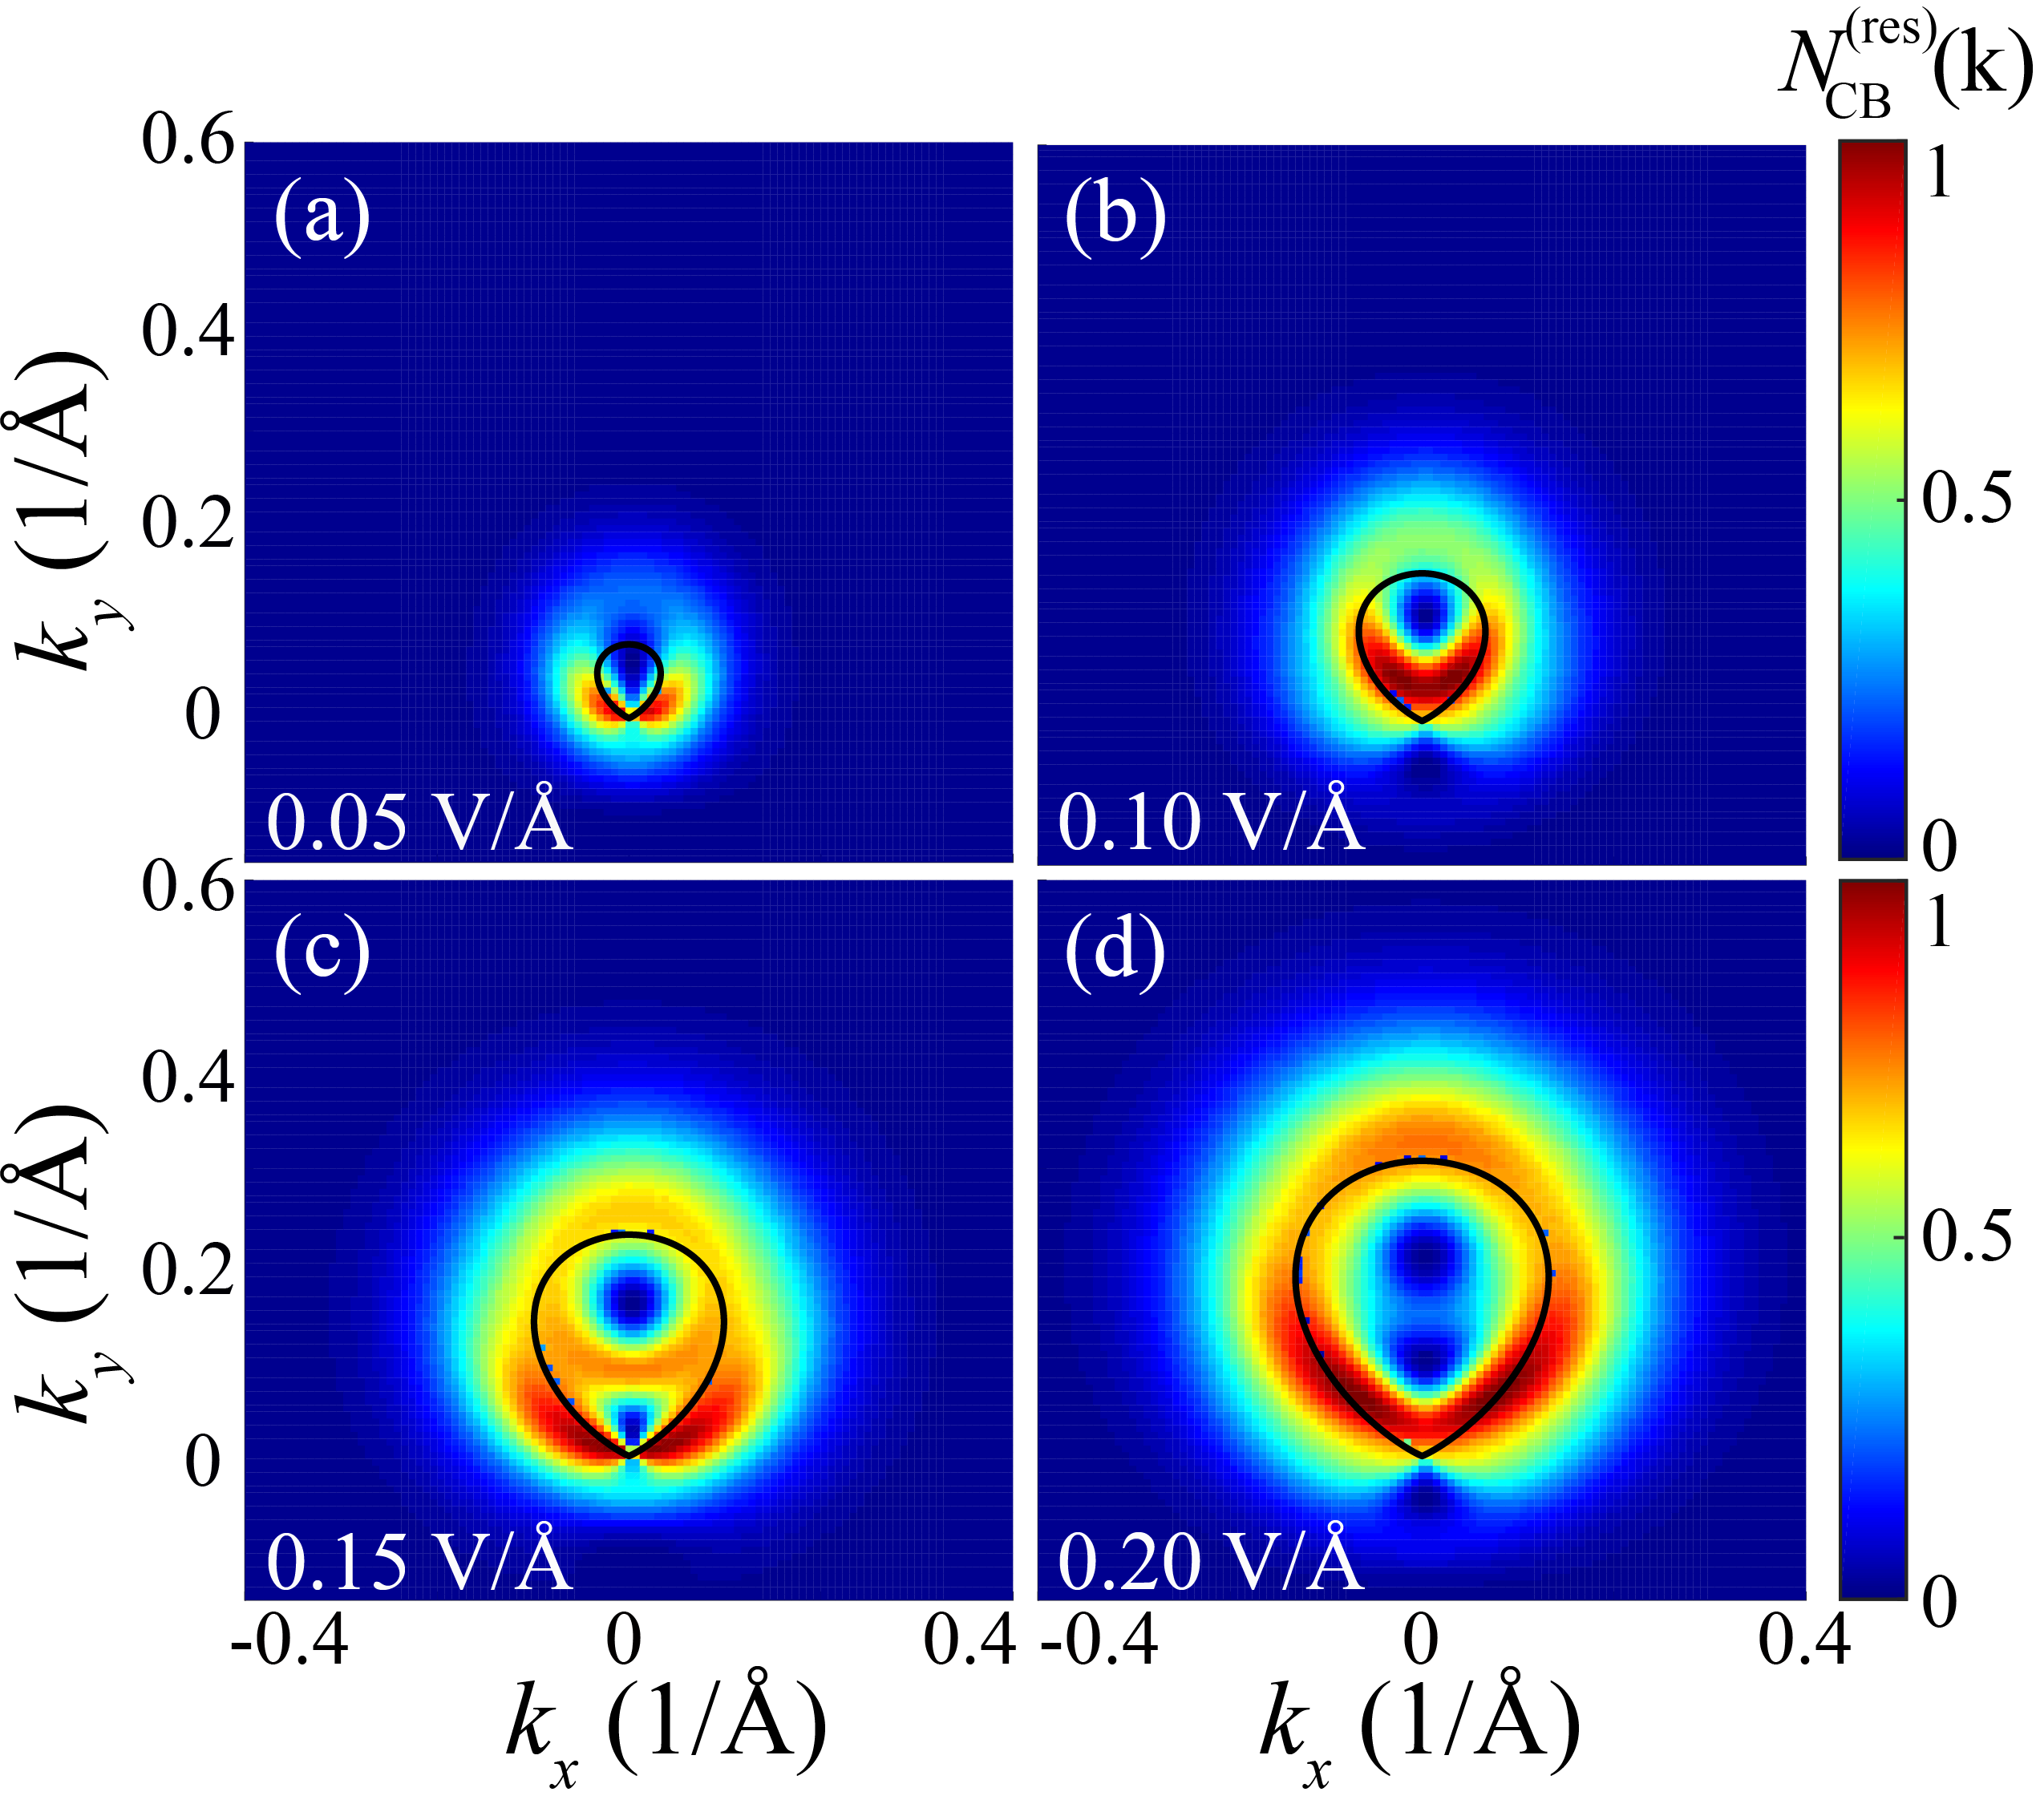
This behavior of the residual CB population is similar but with significant differences to what is calculated for graphene near the Dirac points (K or K′), see Fig. 4, where the residual CB population is shown for a low-energy effective model of graphene [Eq. (17)] for different polarization directions. The distribution of for graphene is symmetric with respect to the polarization plane in contrast to the 3D TI, cf. Fig. 3, where this symmetry is broken by the warping terms.
There is also another fundamental physical difference between the electron-distribution textures in graphene and TI. In graphene, there is locking of crystal momentum and pseudospin, and this locking is opposite in the VB and CB. For TIs, there is locking of crystal momentum and real electron spin. Thus the textures of the electron population in the reciprocal space are simultaneously spin-polarization textures. Potentially, such momentum/spin textures can be directly measured using spin-polarized TR-ARPES Hsieh et al. (2009); Pan et al. (2011).
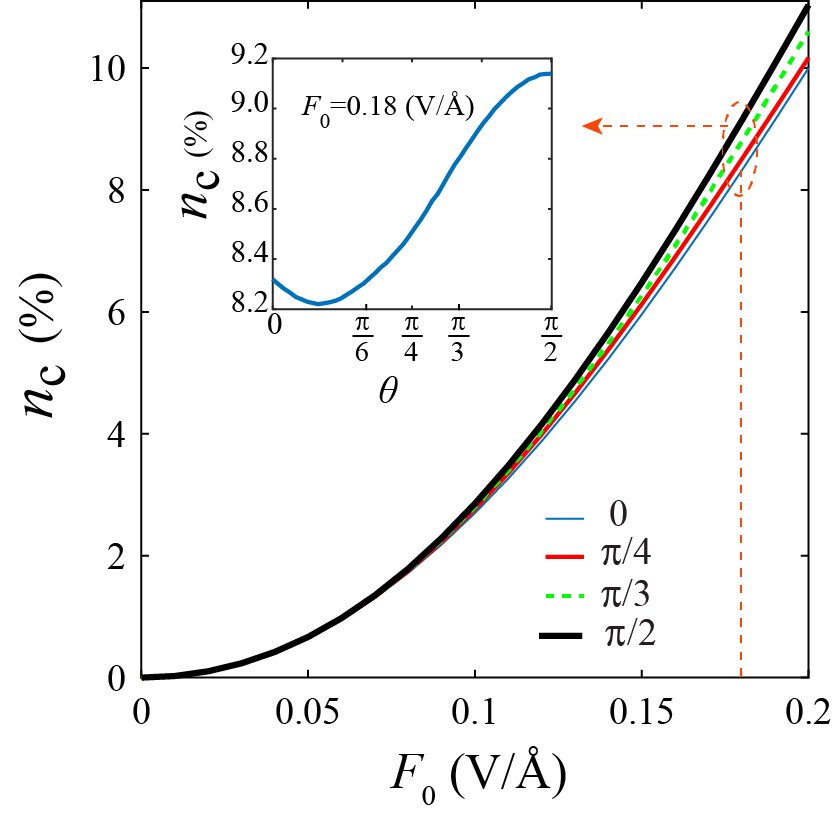
The mean residual CB population (averaged over a part of the surface Brillouin zone close to the Dirac point), , as a function of field amplitude, , is shown for the linearly polarized pulse in Fig. 5. This population monotonically increases with and has only a weak dependence on the direction of polarization. For a given field amplitude, the maximum CB population is realized for the polarized pulse, , while the minimum is at (see inset).
III.2 Circularly polarized pulse
Two-dimensional solids and topological crystals in the reciprocal space possess nontrivial topological properties (chirality) related to the Berry-Zak phase Berry (1984); Zak (1989); Xiao et al. (2010). In this Section, we will study this topology using circularly-polarized ultrashort pulses. Note that the linearly-polarized pulses employed in the previous Section are “blind” to chirality.
A one-cycle circularly-polarized pulse we will use has electric field that can be parametrized as the following waveform:
| (22) |
where sign determines the handedness of the pulse [ is for a right-hand circularly polarized pulse (RCP), and is for a left-hand circularly polarized pulse (LCP)]. For brevity, we denote such one-cycle RCP as 1R and one-cycle LCP as 1L. These 1R and 1L pulses are related by reflection in the plane (-reflection). Note that the same change of handedness can be obtained by -reversal plus reflection in the coordinate center, i.e., -transformation. The pairs of pulses with opposite chirality are ideally suited to probe the chirality of the surface Bloch bands because the resulting electron distributions depend on the sign of the Berry curvature with respect to the pulse chirality.
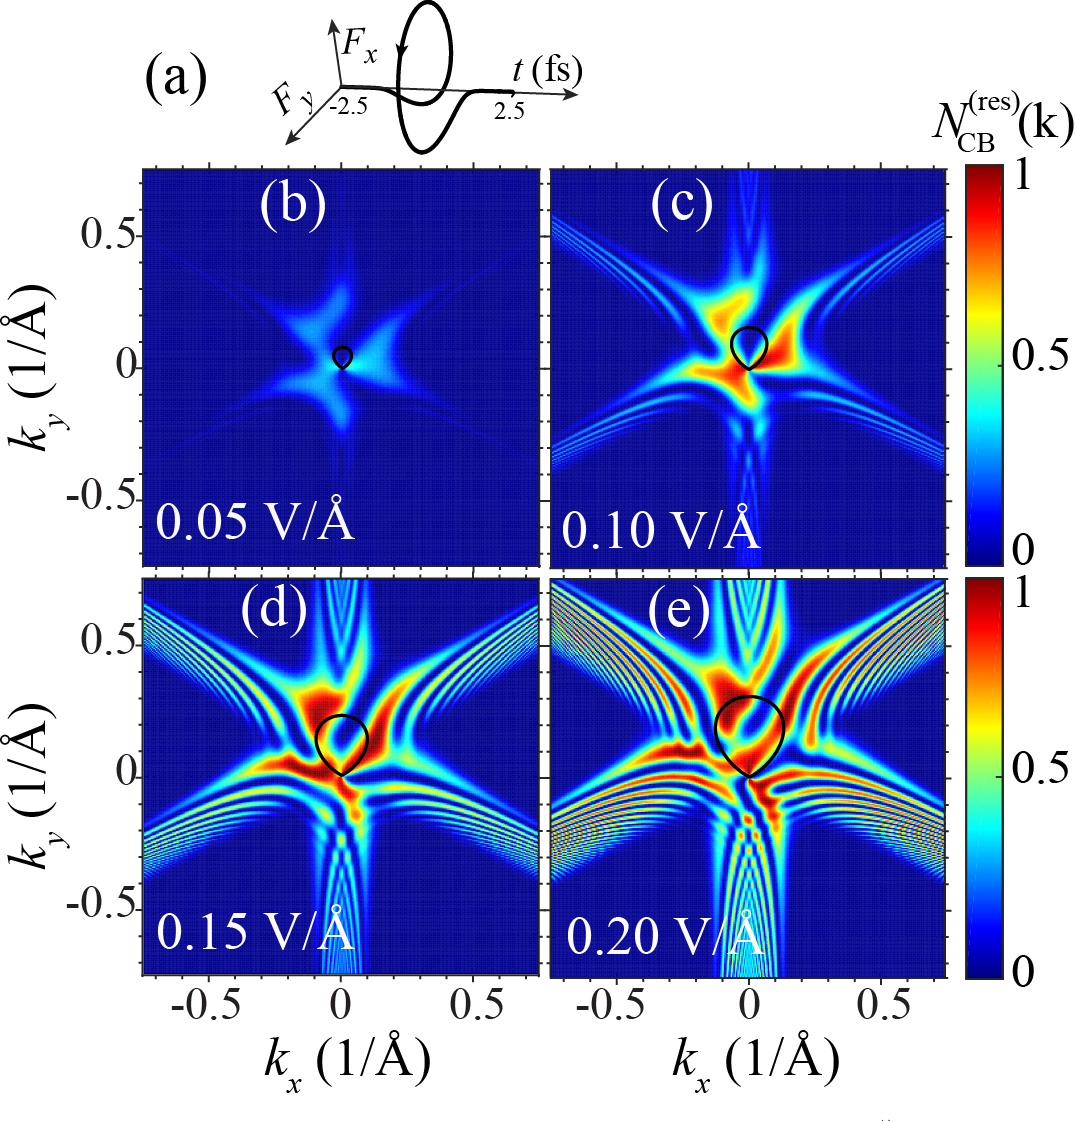
Following this line, for a 1R pulse, residual CB population distributions in the reciprocal space are shown in Fig. 6 for several field amplitudes . Similar to the linear-polarization case considered above in Sec. III.1, here the residual CB population is also large for implying that the electron dynamics is highly irreversible. The CB population distribution shows a chiral pattern, which is correlated with the handedness of the pulse.
A solid closed black curve seen in Fig. 6 (b)-(e) is the separatrix Kelardeh et al. (2016). This is defined as a set of initial points for which electron trajectories pass precisely through the Dirac () point. Its parametric equation is , where is a parameter, and is a Bloch trajectory originating at a point as given by Eq. (7). Thus, the separatrix is an electron trajectory starting at (i.e., at the -point) and reflected in the plane (- reflection). For initial crystal momentum inside of the separatrix, the electron trajectory, , encircles the -point, otherwise it does not.
Because the coupling dipole matrix element (the non-Abelian Berry connection) is large (singular) at the -point [see Fig. 2], one may expect that the residual CB population will be enhanced close to the separatrix. This was the case for graphene in Ref. Kelardeh et al., 2016 (see also Fig. 7 and its discussion below in this Section) but it is not pronounced in the present study, as Fig. 6 demonstrates.
A fundamental difference between the TI and graphene is that the non-Abelian Berry curvature, , a gauge-invariant field whose integral over reciprocal space area is equal to the Berry phase, for graphene is real and singular – it has a -function-singularity localized at the Dirac ( and ) points. For a circular pulse for graphene, there is only one passage of an electron, which is moving in the reciprocal space, by the Dirac point. Thus there is only one significant amplitude to undergo a VBCB transition, and, consequently, there is no pronounced interference along the separatrix, see Fig. 7. Note that the these illustrative data for graphene were calculated as in Ref. Kelardeh et al., 2016.
In a sharp contrast, in present model of TI, there are regions along the radial lines emanating from the -point, which are seen as ridges in Fig. 2, where the non-Abelian Berry connection (dipole matrix element) is increased and possesses a non-trivial phase. These regions overlap in the vicinity of the -point close to the separatrix. Consequently, the corresponding amplitudes of the VBCB transitions interfere causing the chiral pattern of interference fringes seen in Fig. 6. The separatrix itself is surrounded by regions of high CB population but not seen as a continuous arc in contrast to the case of graphene – cf. Fig. 7 and Ref. Kelardeh et al., 2016.
For high enough fields, , there is a pronounced pattern of interference fringes in Fig. 6(b)-(e). Note that his pattern is a self-referenced electron interferogram whose chirality is due to the nontrivial phase of the non-Abelian Berry connection. This interference is caused by passing the ridge of twice during one optical cycle and, also, close the separatrix, additionally by passing close to the Dirac point where the VBCB transitions predominantly occur. The corresponding transition amplitudes interfere generating the fringes, which carry information about both the non-Abelian Berry curvature and the dynamic phase.
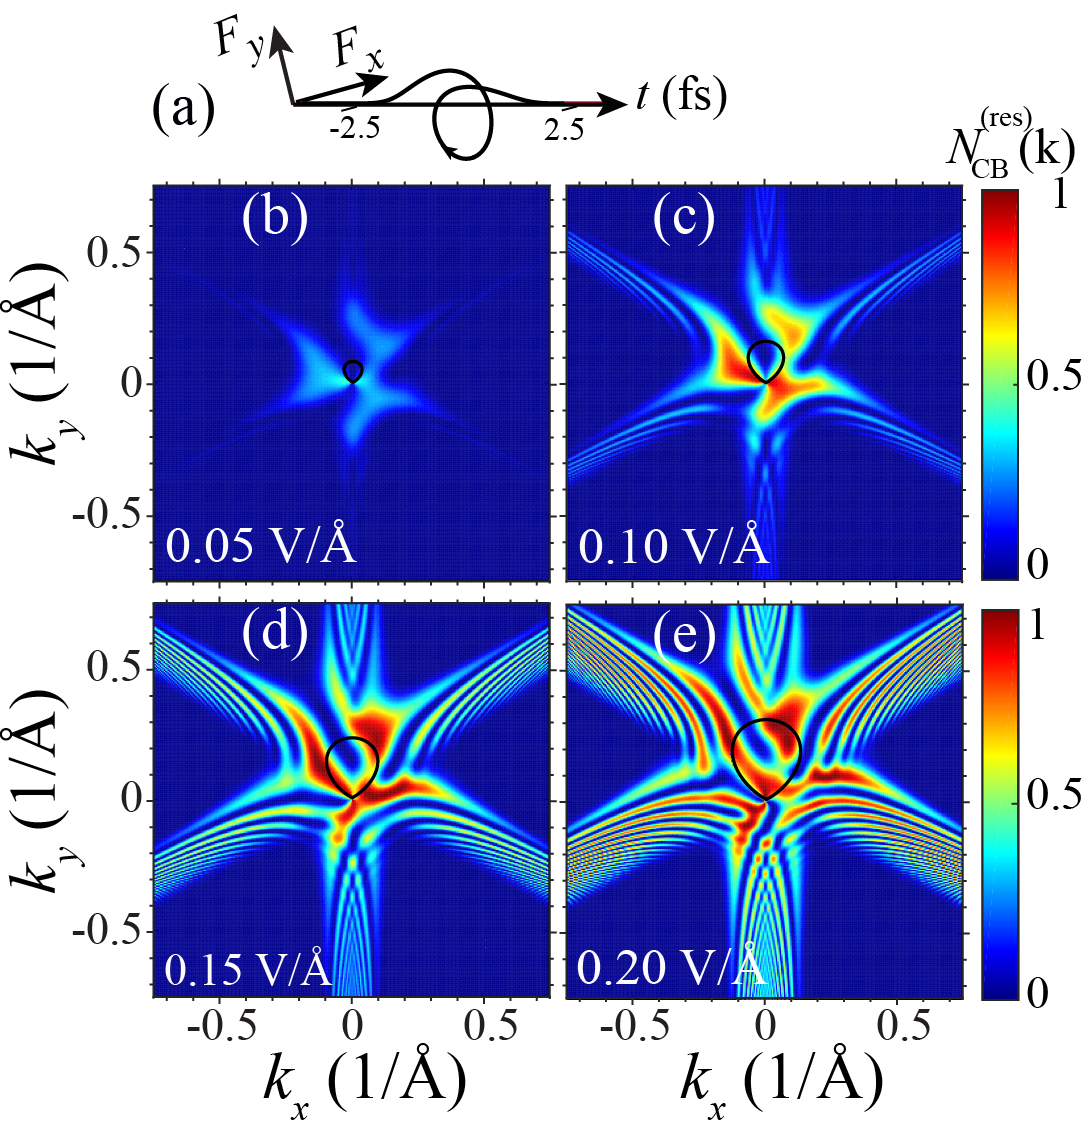
The CB population for the left-handed pulse (1L) is shown in Fig. 8. Obviously it is related to the pattern in Fig. 6 by the -reflection. This exactly is expected from the symmetry of the problem. Correspondingly, the distributions in Fig. 8 exhibit opposite chiralities but otherwise are similar to those in Fig. 6.
We consider also pulses consisting of two optical cycles with opposite chiralities whose waveforms are parametrized as
| (23) |
where and fs. The delay time (the time between the two cycles) is fs. Here the plus sign in the above expression corresponds to two right-handed cycles (2R), while the minus sign corresponds to one right-handed cycle followed by one left-handed cycle (1R+1L). Note these opposite-chirality pulses are related by the -reflection instead of the -reversal.
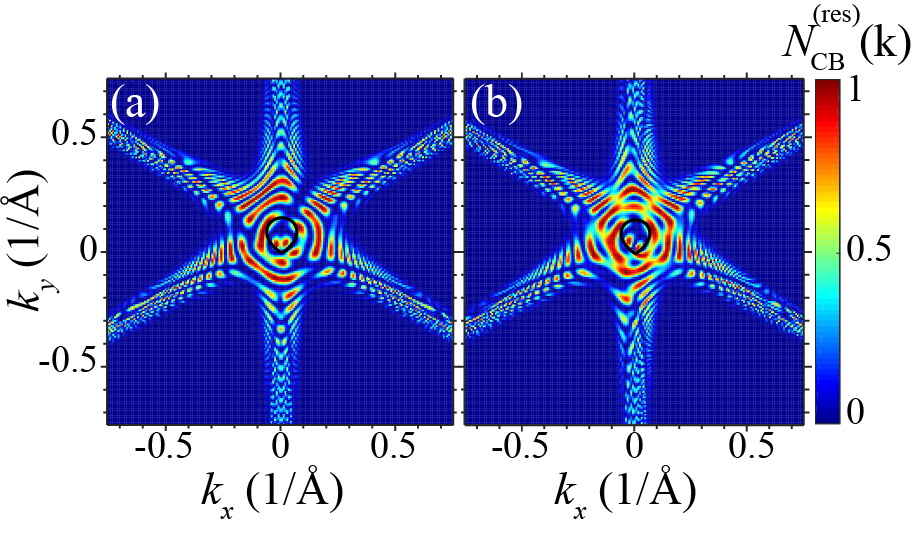
The residual CB population for the two-cycle pulse is shown in Fig. 10(a) for the 2R pulse and Fig. 10(b) for the 1R+1L pulse. In comparison to the one-cycle pulse, the CB population for two-cycle pulse shows more interference fringes, which is due to the interference of the transition amplitudes accumulated during the two constituent subcycles. The CB population distribution also has a chiral pattern for all types of two-cycle pulses (2R and 1R+1L). This chirality is due to non-Abelian Berry phase, which is non-zero due to the warping terms in the Hamiltonian of Eq. (1). In a sharp contrast, in graphene the non-Abelian Berry connection is real – see Eqs. (19)-(20). Consequently, the residual CB population for any pulses of the same chirality (1R, 1L, 2R, or 2L) is non-chiral and symmetric with respect to the -reflection Kelardeh et al. (2016).
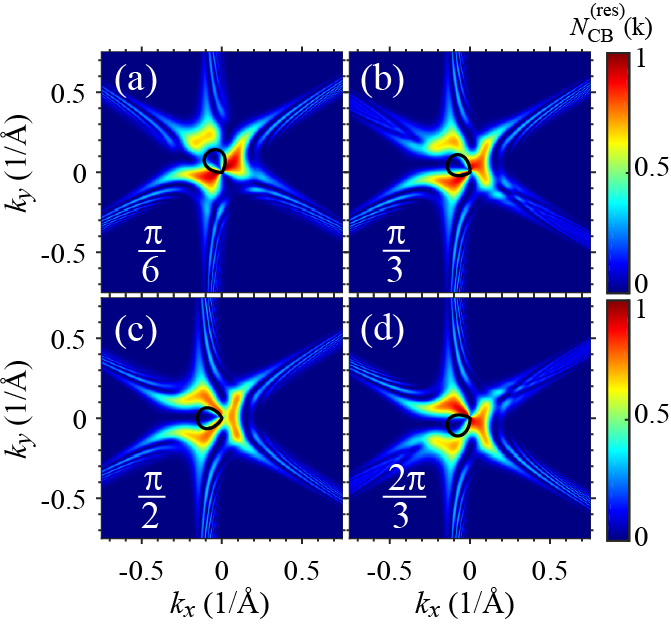
As we have already discussed above in conjunction with Eqs. (14)-(15), for the TIs surface reciprocal space, the Berry connection is distributed bringing about a nontrivial phase that leads to chirality of the CB residual electron distribution. In Figs. 9 (a)-(d) [see also Fig. 6(c) for comparison], we illustrate the dependence of this chirality on the orientation of the 1R pulses for a moderate pulse amplitude, . Note that this orientation is determined by the angle between the direction of the maximum field, , and the positive -axis, which is nothing else as the carrier-envelope phase, , of the pulse. As we see from these figures, the chirality is present for , and ; it is completely absent for , and . Generally, the chirality is absent when the maximum field is in the direction of any of the ridges in Fig. 2(a), i.e., , where is an integer; in contrast, it is maximum when the maximum field is along the bisector between the ridges, . Note that in all cases of Fig. 6(c) and Figs. 9(a)-(d) , the electron distribution consists of “bright” regions of a high population adjacent to and outside of the separatrix. These bright regions have peripheral “wings” extending along the six ridges of the non-Abelian Berry connection [Fig. 2(a)] .
IV Conclusion Discussion
Electron dynamics on the surface of in the field of an ultrashort and strong optical pulse results in a significant CB population during the pulse and after the pulse. This residual CB population is large and comparable to the maximum CB population during the pulse, which implies that the electron dynamics is highly irreversible. For a linearly polarized pulse, the electron dynamics significantly depends on the polarization direction of the pulse. There is a pattern of interference fringes in electron CB distribution [see Figs. 3 and 4]. These fringes appear as a result of interference of two events of the electron passage by the Dirac () point during the single optical oscillation. These are somewhat similar to those predicted earlier for graphene Kelardeh et al. (2015) (the present field is relatively low and only one pair of fringes appear). Note that limited preliminary results on linear-polarized pulses interacting with TI’s, which included only Fig. 3 of the present article, were recently published in Conference Proceedings Motlagh et al. (2017).
Circularly-polarized (chiral) single-oscillation pulse induces a chiral distribution of the residual CB population in the reciprocal space. The handedness of the induced chirality is determined by the handedness (right or left) of the pulse. Such a chiral response in is due to the warping terms in the low-energy surface Hamiltonian near the Dirac point, which is the -point in TI’s. This leads to the non-Abelian Berry connection being complex with phase winding that causes the aforementioned chirality. In a sharp contrast, in graphene the non-Abelian Berry connection is real, and no chirality is induced by a single-oscillation chiral pulse.
The electron interference patterns predicted in this work are self-referenced electron holograms that carry rich information about topological properties (the non-Abelian Berry connection and curvature) of the TI reciprocal space. Such self-referenced holograms can be measured using time-resolved angle-resolved photoelectron spectroscopy (TR-ARPES) Liu et al. (2011); Gierz et al. (2013). In principle, it may be possible to restore the topology of the Bloch bands from these holograms. We will consider the latter problem elsewhere.
Optical pulses, both linearly and circularly polarized, create generally asymmetric carrier distributions in the reciprocal space. These will manifest themselves as currents (net charge transfer) in the real space – cf. Refs. Schiffrin et al., 2012; Kwon et al., 2016; Higuchi et al., 2017. The corresponding charge transfer per pulse can be measured macroscopically. For linearly polarized pulses, the direction of the net charge transfer is parallel to the maximum electric field. The net charge transferred (sign and magnitude) is defined by the carrier-envelope phase of the pulse and provides a direct access to its measurement Paasch-Colberg et al. (2014).
For circularly polarized pulses considered in this article, the resulting electron distributions in the reciprocal space are generally both asymmetric and chiral. Correspondingly, there are two types of currents: (i) Direct current in a direction parallel to the maximum field and (ii) Hall current in a normal direction. The latter depends on the chirality of the pulse vs. the chirality of the Bloch bands at the -point. There is a circular current present during the pulse that follows the shape of the TMDC specimen. This current will produce THz radiation as in Ref. Langer et al., 2018, which can also provide an access to the ultrafast electron dynamics. We will publish our results on the currents induced in TI’s elsewhere.
Acknowledgements.
This work by MIS was supported by Grant DE-FG02-01ER15213 from the Atomic, Molecular and Optical Sciences Program, Office of Basic Energy Sciences, the US Department of Energy. Work of VA was supported by a grant DE-SC0007043 from the Physical Behavior of Materials Program, Office of Basic Energy Sciences, and the US Department of Energy. SAOM gratefully acknowledges support by MURI Grant FA9550-15-1-0037 from the US Air Force Office of Scientific Research. JSW support came from EFRI NewLAW Grant EFMA-17 41691 from US National Science Foundation.References
- Fu et al. (2007) L. Fu, C. L. Kane, and E. J. Mele, “Topological insulators in three dimensions,” Phys. Rev. Lett. 98, 106803–1–4 (2007).
- Hsieh et al. (2009) D. Hsieh, Y. Xia, L. Wray, D. Qian, A. Pal, J. H. Dil, J. Osterwalder, F. Meier, G. Bihlmayer, C. L. Kane, Y. S. Hor, R. J. Cava, and M. Z. Hasan, “Observation of unconventional quantum spin textures in topological insulators,” Science 323, 919–922 (2009).
- Hasan and Kane (2010) M. Z. Hasan and C. L. Kane, “Colloquium : Topological insulators,” Reviews of Modern Physics 82, 3045–3067 (2010).
- Bansil et al. (2016) A. Bansil, H. Lin, and T. Das, “Colloquium: Topological band theory,” Reviews of Modern Physics 88, 021004 (2016).
- Wang et al. (2011) Y. H. Wang, D. Hsieh, D. Pilon, L. Fu, D. R. Gardner, Y. S. Lee, and N. Gedik, “Observation of a warped helical spin texture in from circular dichroism angle-resolved photoemission spectroscopy,” Phys. Rev. Lett. 107, 207602 (2011).
- Wang et al. (2013) Y. H. Wang, H. Steinberg, P. Jarillo-Herrero, and N. Gedik, “Observation of Floquet-Bloch states on the surface of a topological insulator,” Science 342, 453–457 (2013).
- Sanchez-Barriga et al. (2014) J. Sanchez-Barriga, A. Varykhalov, J. Braun, S. Y. Xu, N. Alidoust, O. Kornilov, J. Minar, K. Hummer, G. Springholz, G. Bauer, R. Schumann, L. V. Yashina, H. Ebert, M. Z. Hasan, and O. Rader, “Photoemission of bi2se3 with circularly polarized light: Probe of spin polarization or means for spin manipulation?” Phys Rev X 4, 011046–1–10 (2014).
- Kelardeh et al. (2015) H. K. Kelardeh, V. Apalkov, and M. I. Stockman, “Graphene in ultrafast and superstrong laser fields,” Phys. Rev. B 91, 0454391–8 (2015).
- Kelardeh et al. (2016) H. K. Kelardeh, V. Apalkov, and M. I. Stockman, “Attosecond strong-field interferometry in graphene: Chirality, singularity, and Berry phase,” Phys. Rev. B 93, 155434–1–7 (2016).
- Kelardeh et al. (2017) H. Koochaki Kelardeh, V. Apalkov, and M. I. Stockman, “Graphene superlattices in strong circularly polarized fields: Chirality, Berry phase, and attosecond dynamics,” Phys. Rev. B 96, 075409–1–8 (2017).
- Higuchi et al. (2017) T. Higuchi, C. Heide, K. Ullmann, H. B. Weber, and P. Hommelhoff, “Light-field-driven currents in graphene,” Nature 550, 224–228 (2017).
- Liu et al. (2011) Y. Liu, G. Bian, T. Miller, and T. C. Chiang, “Visualizing electronic chirality and Berry phases in graphene systems using photoemission with circularly polarized light,” Phys. Rev. Lett. 107, 166803–1–5 (2011).
- Gierz et al. (2013) I. Gierz, J. C. Petersen, M. Mitrano, C. Cacho, I. C. Turcu, E. Springate, A. Stohr, A. Kohler, U. Starke, and A. Cavalleri, “Snapshots of non-equilibrium Dirac carrier distributions in graphene,” Nat. Mater. 12, 1119–24 (2013).
- Crepaldi et al. (2013) A. Crepaldi, F. Cilento, B. Ressel, C. Cacho, J. C. Johannsen, M. Zacchigna, H. Berger, Ph. Bugnon, C. Grazioli, I. C. E. Turcu, E. Springate, K. Kern, M. Grioni, and F. Parmigiani, “Evidence of reduced surface electron-phonon scattering in the conduction band of bi2se3 by nonequilibrium arpes,” Phys. Rev. B 88, 121404 (2013).
- Liu et al. (2010a) Chao-Xing Liu, Xiao-Liang Qi, HaiJun Zhang, Xi Dai, Zhong Fang, and Shou-Cheng Zhang, “Model hamiltonian for topological insulators,” Phys. Rev. B 82, 045122 (2010a).
- Braun et al. (2016) L. Braun, G. Mussler, A. Hruban, M. Konczykowski, T. Schumann, M. Wolf, M. Münzenberg, L. Perfetti, and T. Kampfrath, “Ultrafast photocurrents at the surface of the three-dimensional topological insulator bi2se3,” Nat. Commun. 7, 13259–1–9 (2016).
- Wang et al. (2016) M. C. Wang, S. Qiao, Z. Jiang, S. N. Luo, and J. Qi, “Unraveling photoinduced spin dynamics in the topological insulator ,” Phys. Rev. Lett. 116, 036601 (2016).
- Liu et al. (2010b) Chao-Xing Liu, Xiao-Liang Qi, HaiJun Zhang, Xi Dai, Zhong Fang, and Shou-Cheng Zhang, “Model hamiltonian for topological insulators,” Phys. Rev. B 82, 045122 (2010b).
- Cava et al. (2013) R. J. Cava, Huiwen Ji, M. K. Fuccillo, Q. D. Gibson, and Y. S. Hor, “Crystal structure and chemistry of topological insulators,” J. Mater. Chem. C 1, 3176–3189 (2013).
- D. Glinka et al. (2015) Yuri D. Glinka, Sercan Babakiray, Trent A. Johnson, Mikel Holcomb, and David Lederman, “Resonance-type thickness dependence of optical second harmonic generation in thin-films of the topological insulator bi2se3,” Physical Review B 91 (2015).
- Zhang et al. (2009a) Haijun Zhang, Chao-Xing Liu, Xiao-Liang Qi, Xi Dai, Zhong Fang, and Shou-Cheng Zhang, “Topological insulators in Bi2Se3, Bi2Te3 and Sb2Te3 with a single Dirac cone on the surface,” Nature Phys. 5, 438–442 (2009a).
- Zhang et al. (2009b) Haijun Zhang, Chao-Xing Liu, Xiao-Liang Qi, Xi Dai, Zhong Fang, and Shou-Cheng Zhang, “Topological insulators in bi2se3, bi2te3 and sb2te3 with a single dirac cone on the surface,” Nature Physics 5, 438 (2009b).
- Feng and Yao (2012) W. X. Feng and Y. G. Yao, “Three-dimensional topological insulators: A review on host materials,” Science China-Physics Mechanics Astronomy 55, 2199–2212 (2012).
- (2009) Liang , “Hexagonal warping effects in the surface states of the topological insulator ,” Phys. Rev. Lett. 103, 266801 (2009).
- Corkum and Krausz (2007) P. B. Corkum and F. Krausz, “Attosecond science,” Nat. Phys. 3, 381 – 387 (2007).
- Krausz and Ivanov (2009) F. Krausz and M. Ivanov, “Attosecond physics,” Rev. Mod. Phys. 81, 163–234 (2009).
- Krausz and Stockman (2014) Ferenc Krausz and Mark I. Stockman, “Attosecond metrology: from electron capture to future signal processing,” Nat Photon 8, 205–213 (2014).
- Kibis (2010) O. V. Kibis, “Metal-insulator transition in graphene induced by circularly polarized photons,” Phys. Rev. B 81, 165433–1–5 (2010).
- Kristinsson et al. (2016) K. Kristinsson, O. V. Kibis, S. Morina, and I. A. Shelykh, “Control of electronic transport in graphene by electromagnetic dressing,” Sci. Rep. 6, 20082–1–7 (2016).
- Bloch (1929) F. Bloch, “Über die Quantenmechanik der Elektronen in Kristallgittern,” Z. Phys. A 52, 555–600 (1929).
- Houston (1940) W. V. Houston, “Acceleration of electrons in a crystal lattice,” Phys. Rev. 57, 184–186 (1940).
- Wilczek and Zee (1984) F. Wilczek and A. Zee, “Appearance of gauge structure in simple dynamical systems,” Phys. Rev. Lett. 52, 2111–2114 (1984).
- Xiao et al. (2010) D. Xiao, M.-C. Chang, and Q. Niu, “Berry phase effects on electronic properties,” Rev. Mod. Phys. 82, 1959–2007 (2010).
- Yang and Liu (2014) F. Yang and R. B. Liu, “Nonlinear optical response induced by non-Abelian Berry curvature in time-reversal-invariant insulators,” Phys. Rev. B 90, 245205 (2014).
- Schiffrin et al. (2012) A. Schiffrin, T. Paasch-Colberg, N. Karpowicz, V. Apalkov, D. Gerster, S. Muhlbrandt, M. Korbman, J. Reichert, M. Schultze, S. Holzner, J. V. Barth, R. Kienberger, R. Ernstorfer, V. S. Yakovlev, M. I. Stockman, and F. Krausz, “Optical-field-induced current in dielectrics,” Nature 493, 70–74 (2012).
- Kwon et al. (2016) O. Kwon, T. Paasch-Colberg, V. Apalkov, B.-K. Kim, J.-J. Kim, M. I. Stockman, and D. E. Kim, “Semimetallization of dielectrics in strong optical fields,” Sci. Rep. 6, 21272–1–9 (2016).
- Pan et al. (2011) Z.-H. Pan, E. Vescovo, A. V. Fedorov, D. Gardner, Y. S. Lee, S. Chu, G. D. Gu, and T. Valla, “Electronic structure of the topological insulator using angle-resolved photoemission spectroscopy: Evidence for a nearly full surface spin polarization,” Phys. Rev. Lett. 106, 257004 (2011).
- Berry (1984) M. V. Berry, “Quantal phase factors accompanying adiabatic changes,” Proc. Royal Soc. London Ser. A 392, 45–57 (1984).
- Zak (1989) J. Zak, “Berry’s phase for energy bands in solids,” Phys. Rev. Lett. 62, 2747–2750 (1989).
- Motlagh et al. (2017) S. Azar Oliaei Motlagh, Jhih-Sheng Wu, Vadym Apalkov, and Mark I. Stockman, “Ultrafast control of electron dynamics in 3d topological insulator,” Journal of Physics: Conference Series 906, 012012 (2017).
- Paasch-Colberg et al. (2014) T. Paasch-Colberg, A. Schiffrin, N. Karpowicz, S. Kruchinin, Saglam Ozge, S. Keiber, O. Razskazovskaya, S. Muhlbrandt, A. Alnaser, M. Kubel, V. Apalkov, D. Gerster, J. Reichert, T. Wittmann, J. V. Barth, M. I. Stockman, R. Ernstorfer, V. S. Yakovlev, R. Kienberger, and F. Krausz, “Solid-state light-phase detector,” Nat. Phot. 8, 214–218 (2014).
- Langer et al. (2018) F. Langer, C. P. Schmid, S. Schlauderer, M. Gmitra, J. Fabian, P. Nagler, C. Schüller, T. Korn, P. G. Hawkins, J. T. Steiner, U. Huttner, S. W. Koch, M. Kira, and R. Huber, “Lightwave valleytronics in a monolayer of tungsten diselenide,” Nature 557, 76–80 (2018).