The isotropic Compton profile difference across the phase transition of VO2
Abstract
We studied the isotropic Compton profile of the prototypical oxide VO2 across the temperature induced electronic and structural phase transition at T 340 K. We show that the phase transition leaves an observable signal, which facilitates Compton scattering studies of electronic structure and phase transitions in complex solids in powder form. We compare the experimental results with density functional theory calculations and find agreement in the shape of the difference profile, although the amplitude of the observed features is overestimated. The origin of the disagreement is discussed and we argue that it mainly originates mostly correlation effects beyond our current calculations and possibly to some extent, from thermal motion.
pacs:
71.30.+hMetal-insulator transitions and other electronic transitions and 71.18.+yFermi surface: calculations and measurements1 Introduction
Inelastic X-ray scattering at high energy and momentum transfers, Compton scattering, probes the electron momentum density (EMD). eisenberger70 Compton scattering has been shown to be an advantageous tool in obtaining bulk sensitive quantitative information on electronic structure. barbillieni09 ; sakurai11 ; hiraoka05 ; hiraoka07 ; shukla99 ; huotari2010 In the framework of the impulse approximation,eisenberger70 ; eisenberger74 the Compton scattering cross section is proportional to the EMD projected onto the scattering vector . This quantity is known as the Compton profile (CP), J. The EMD is a ground state property and thus useful for comparisons with theoretical calculations as the computation of response functions, with the associated approximations, is avoided.
Metal-insulator transitions (MIT) present a rich topic of study as they are observed in a wide range of compounds and often result in surprising discoveries. imada98 This is especially true in the case of strongly correlated electron systems, where in addition to the canonical Mott transition, phase transitions induced by e.g. temperature, pressure or doping lead into novel electronic ground states, such as high temperature superconductivity in the cuprates or colossal magnetoresistance in the manganites. MIT exhibiting materials are often complex oxides, in which the interpretation of various experiments can be challenging. It it thus important to apply multiple complementary probes to a given problem. VO2 exhibits a complex MIT where the electronic phase transition takes place at T 340 K and coincides with a structural transition from a tetragonal metallic R phase above T to a monoclinic insulating M1 phase in pristine samples. morin1959 ; marezio72 ; blaauw75 The respective roles of electron correlations and electron phonon coupling effects in inducing the MIT have been studied with numerous experimental and theoretical approaches. blaauw75 ; shin90 ; suga09 ; eguchi08 ; haverkort05 ; biermann05 ; wentzcovitch94 ; kim13 ; eyert11 ; continenza99 ; gatti07 ; grau-crespo12
From the experimental perspective, VO2 is an attractive prototype material for investigating phase transitions with Compton scattering. This is due to the fact that in comparison with e.g. MIT-exhibiting ternary oxides, VO2 has a larger valence-to-core electron-number ratio. Compton scattering studies of EMD anisotropies across MIT boundaries have been presented for La2-2xSr1+2xMn2O7, La2−xSrxCuO4, Ba1-xKxBiO3 and PrBa2Cu3O7-δ. barbillieni09 ; sakurai11 ; hiraoka05 ; hiraoka07 ; shukla99 The temperature dependence of Compton profiles in weakly correlated systems has also been studied.dugdale98 ; sternemann01 ; huotari02 ; erba15 Furthermore, Compton profiles across solid-liquid phase boundaries in B and Si have been studied with Compton scattering and ab-initio molecular dynamics. okada12 ; okada15 The effects of temperature and the metal-superconductor phase transition in the Compton profile of MgB2 have been studied experimentally and computationally. nygard04 ; joshi07
The developments presented in the above-mentioned studies suggest that temperature-dependent in situ Compton scattering studies of MITs may now be initiated. Our contribution to this promising line of inquiry is a study on the isotropic EMD difference across the MIT phase boundary in VO2. In particular, we demonstrate the ability of Compton scattering to reveal a MIT-signal in a powder averaged experiment. We compare the experimental result to density functional theory calculations using local exchange-correlation approximations to yield a first order approximation for the difference Compton profile, as it has been shown that the local density approximations yield reasonable anisotropy Compton profiles in e.g. Ni metal. chioncel14 We compare the experimental Compton profile difference across the MIT boundary to density functional theory calculations. Good agreement is found on the shape of the difference profile, but the amplitude is overestimated. To analyze the origin of the discrepancy we compare the relative orders of magnitudes of physical effects not included in the calculations.
2 Experiment
The Compton scattering experiment was performed at the beamline ID15B of the ESRF. The incident beam was monochromatized to a photon energy of 87 keV with 0.1% bandwidth using a bent Si(511) monochromator in the Laue geometry. A 12-element Ge solid state detector at a nominal scattering angle of 154∘ was used to record the spectra. The total momentum resolution of the experiment was 0.7 atomic units (a.u. from hereon), and was calculated from the detector resolution, incident bandwidth and scattering solid angles. We used a N2 gas blower as the sample heater. We monitored the stability of the temperature with a thermocouple placed approximately 1 cm from the sample and found that it was stable within 2 K. The temperatures discussed from hereon refer to the heater setting. A pressed 2 mm thick pellet of commercial 99% grade VO2 powder (Alfa Aesar) was used as the sample. We first performed temperature dependent x-ray diffraction measurements and observed that the structural phase transition was initiated at a heater setting of 377 K and the sample had fully changed phase by 384 K. We thus chose the Compton profile measurement temperature of the M1 phase at 363 K. The Compton profile of the R phase was measured at 383K. We also performed further x-ray diffraction measurements while recording the Compton profiles. The diffraction patterns agreed with the aforementioned initial test measurements at and were stable throughout the Compton profile measurements.
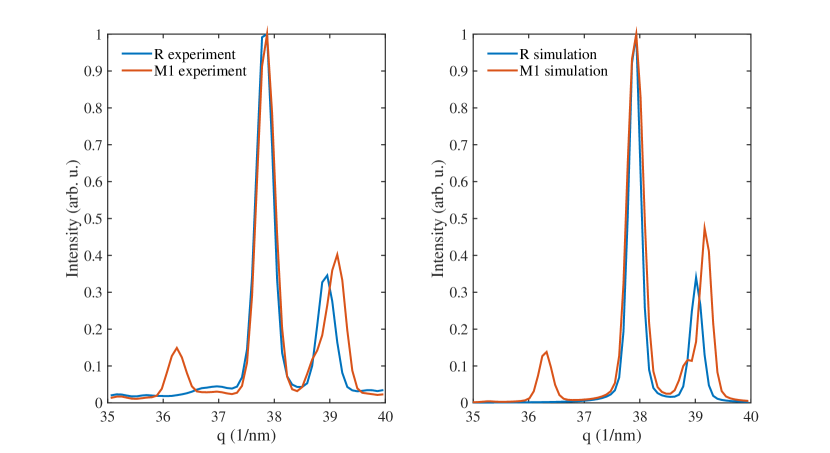
In Fig. 1 we present portions of experimental diffraction patterns taken during the Compton profile measurements and a comparison with calculated powder patterns using the structures from McWhan et al (R) and Longo and Kierkegaard (M1). mcwhan74 ; longo70 The temperature dependence of the reflections (12), (12), (31), (121) and (10) of the M1 phase that contribute to the diffraction peak at 36.2 1/nm clearly demonstrate that the phase transition was complete. Furthermore, they demonstrate that our measurements were performed at temperature values at which there is no observable phase coexistence due to nanoscale phase separation. qazilbash11 From the 2D diffraction images we observed diffuse Debye-Scherrer rings on which brighter spots were evenly distributed. We could also observe a small V6O13 impurity component in the diffraction patterns, which explains the approximately temperature independent diffraction peaks in the experiment. The effect of the impurity on the Compton difference profile is minor. We note that V6O13 undergoes only slight thermal expansion between the below- and above-phase-transition measurement temperatures. Comparing with previous literature on MgB2, we estimate that this thermal expansion in a pure V6O13 sample could cause a Compton profile difference of 0.1% at the maximum, which could result in a 0.001% Compton profile difference for 1% impurity concentration.nygard04 ; joshi07
We measured the Compton scattering spectra repeatedly using 10 minute accumulation times and their mutual agreement within 1 was verified. The incident photon flux on each detector element was kept at counts per second using an attenuator coupled to a feedback loop. The spectra recorded with different analyser elements at slightly different scattering angles were brought to a common scale with the formula of Holm.holm88 The shifted spectra were then summed up to yield the full spectra with counts at the Compton peak. We applied energy dependent corrections for all relevant attenuation sources along the incident and scattered beam paths, and for detector efficiency. Finally we summed the individual spectra for each detector element. The resulting spectra were then normalized to the expected electron number within the 10 a.u. integration range. We then took the CP differences for each analyser, and summed the resulting difference profiles to yield the final experimental result. The profile differences we will present from hereon are defined as .
3 Computational methods
The doubly differential scattering cross section for inelastic x-ray scattering is written in the Kramers-Heisenberg form as
| (1) |
where is the dynamical structure factor and Th refers to the Thomson scattering cross section. The cross section in the Compton scattering regime, where is much larger than electron binding energies in the system and is large compared to the reciprocal lattice unit length scale, can be expressed as a projection of the three dimensional EMD onto the scattering vector. This is the impulse approximation (IA) as discussed in literature. eisenberger70 ; eisenberger74 ; ribberfors75 ; holm88 ; holm89 Within the IA the scattering cross section is written as
| (2) |
where .
The Compton profiles for both phases were calculated utilizing density functional theory (DFT) kohn , and the full potential augmented plane wave plus local orbitals method, as implemented in the elk code.elk We consider V 3s/3p/3d/4s and O 2s/2p electrons as valence electrons that contribute to the momentum densities. Exchange and correlation are treated in the local spin density (LSDA and LSDA+U approximations for the R and M1 phases, respectively. A local Hubbard correction of , where U was 4.2 eV and J was 0.8 eV was applied to the vanadium d-electrons. This selection reproduces the band gap and is widely used in literature. liebch05 ; kim13 Double counting corrections were done at the fully localised limit. The LDA+U ground state of the M1 phase has been studied previously in Ref. yuan12 , and we calculated the M1 Compton profiles using non-magnetic (NM), ferromagnetic (FM) and antiferromagnetic (AFM) solutions of the Kohn-Sham equations, for later comparison with the experiment.
We used experimental crystal structures for the R and M1 phases.longo70 ; mcwhan74 The muffin tin radii were rV,M=1.88 a.u., rO,M=1.42 a.u., rV,R=2.05 a.u. and rO,R=1.53 a.u. The interstitial density was represented by plane waves expanded up to R=8. The interstitial densities and potentials were expanded in Fourier components up to atomic units. The Kohn-Sham equations were solved on a -centered -point grid for both phases. The electron momentum densities were calculated and projected onto selected directions using a recently presented tetrahedron method. ernsting14 The spherically averaged momentum densities were generated by calculating profiles for an appropriate distribution of directions. The weighting factors for the averaging procedure were generated by a numerical Voronoi division of the Brillouin zones about the chosen reciprocal lattice directions. For the R phase we calculated profiles along non-equivalent directions with and , spanning the irreducible wedge of the Brillouin zone. For M1 we chose , and . The computational profiles were convoluted with a Gaussian function of 0.7 a.u. full width at half maximum and normalized to 25 electrons, which is the number of valence electrons per formula unit in the calculation. We used the experimental in taking the differences. We normalize our experimental profiles to the number given by , where the profiles are obtained from the Hartree-Fock calculations of Biggs et al.biggs75 , and the valence contribution is fixed to 25 electrons.
4 Results and discussion
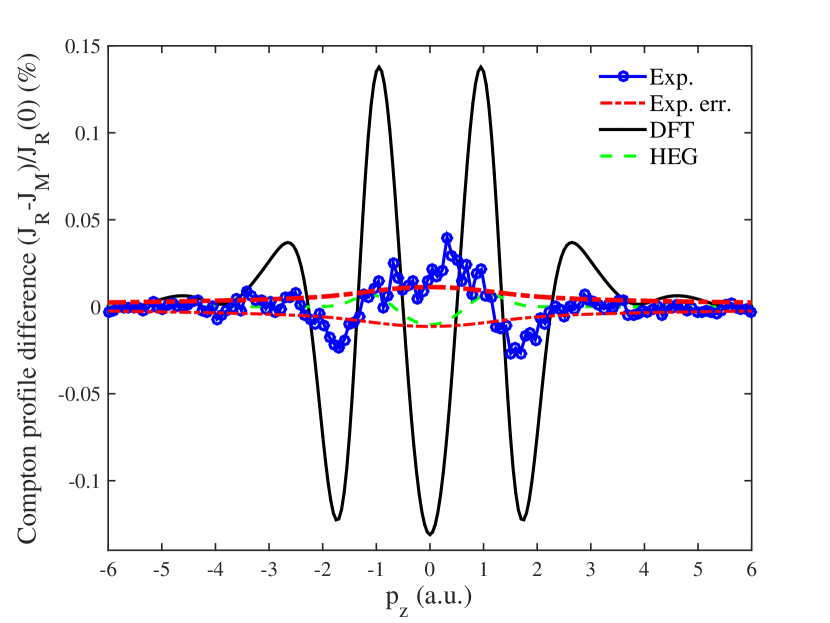
The experimental difference profile and the theoretical results are presented in Fig. 2. In the experimental data, one can observe depressions at a. u. and an increase at . Beyond 4 a.u., the difference is negligible within the experimental uncertainty, indicating that only the valence electron states are significantly altered across the phase transition, as is expected. First, we will discuss the difference profile that results from considering VO2 as a homogeneous electron gas with a change in the electron density at the MIT.
For the homogeneous electron gas (HEG), the Compton profile takes a simple form: for , where is the Fermi momentum and the number of valence electros per unit cell. The density change across the phase transition in the HEG model produces profile differences via the density dependence of . The electron densities across the phase transition change by 0.05%, with the rutile phase being denser. Considering the O 2p and V 3d/4s electrons as the HEG, and by using the electron densities based on structural reference data mcwhan74 ; longo70 we obtain the HEG curve in Fig. 2. We note that the HEG is a poor approximation for the valence electrons in oxide materials, but the magnitude of the difference in the HEG curve can be considered as an indicator of the order of magnitude to expect for the real system. We observe that the magnitude of the HEG difference profile is about half of the experimental one, and that the sign is incorrect. In first approximation, this indicates that the momentum density changes in a way that counteracts effects arising from real space densification.
Second, we will consider the difference profile that we obtain from the LSDA/LSDA+U calculations. Taking electronic correlations into account at the LSDA+U level for the M1 phase using the AFM solution, and LDA level for the R phase, results in a difference profile with an absolute magnitude overestimated by a factor of 5 and significant changes beyond 2 a.u. not observed in the experiment. However, the momentum axis positions of the nodes, minima and maxima in the difference profile are in good agreement with experiment. To rule out convergence issues as the origin of the observed amplitude-discrepancy, we calculated individual Compton profiles for a k-point meshes for both phases. We found that the Compton difference profiles between R and M1 phases were well converged at the coarser k-point mesh. This is not exactly true for features near = 0, but the convergence is reached in the main features to a satisfactory level, and especially well beyond being capable of producing the factor of 5 difference in the amplitude.
There is a number of possible origins of the difference between experiment and theory. We consider electron correlation corrections first. Previous studies have indicated that errors made in exchange-correlation approximations in DFT tend to cancel out in calculations of difference Compton profiles. Lehtola et. al studied the difference profile for a water monomer and a dimer.lehtola11 They compared DFT results to highly accurate quantum chemistry CCSD calculations, and found a small difference of 0.04% at a.u. Quantum Monte Carlo calculations of Compton profiles for Si and Li have been performed,louie98 ; filippi99 and both studies reached the conclusion that correlation effects are not the primary reason for differences between experimental and theoretical Compton profiles. Recent investigation on dynamical mean field theory corrections to Compton profile anisotropies of Ni, for which local correlations are certainly of importance due to the unfilled 3d shell of the Ni atom, presented comparisons of LSDA, LSDA+U and LSDA+DMFT. Again correlation corrections were observed to induce quite small changes in the Compton profile, and the corrections largely cancel out in anisotropy profiles. chioncel14 It it however possible that the error cancellation when comparing two phases is less complete, as effects of static correlation are more pronounced in the M1 phase. gatti07 ; biermann05 In fact, after preparing this manuscript for submission, it has come to our knowledge that recent quantum Monte Carlo calculations kylanpaa18 of the Compton profile difference give much better agreement with the experimental data, indicating that electron-electron interactions play a central role and have to be included more accurately than what is possible within density functional theory and its extensions such as LDA+U. Thus we conclude that exchange-correlation effects may play the decisive role in producing the observed discrepancy.
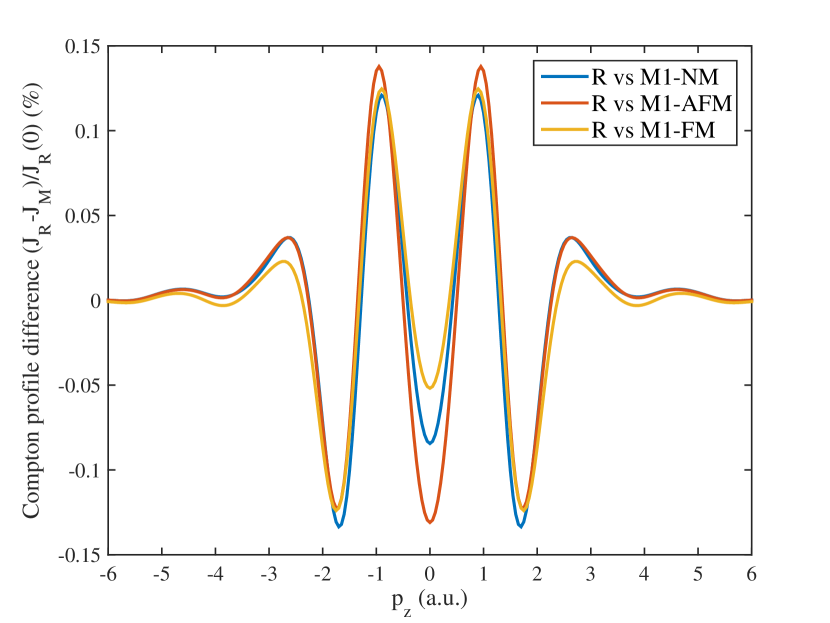
Second, we consider how the calculated difference profile is affected by the presence and ordering of local moments. The formation of local moments may result in changes in the occupation numbers of the d-band states and thus can contribute to the discrepancy. In Fig. 3 we present a comparison of difference profiles obtained using the LDA for the R phase, and the LDA+U NM, FM and AFM solutions for the M1 phase. We observe that the feature near is sensitive to the magnetic nature of the M1 ground state, and that the features at larger momenta are quite insensitive to it. The R1 phase has been suggested to host fluctuating local moments. yuan12 Based on the differences we observe by altering the magnetic properties of the M1 phase, it is possible that the R phase profile might be significantly altered if the local moments were simulated e.g. using supercell calculations.
Third, we consider the effects of the unit cell geometries on the observed difference between experiment and theory. Temperature dependent Compton profile experiments have been performed for the free-electron-like alkali metals and it has been observed that the CP becomes narrower for increasing temperature, mainly due to the reciprocal space shrinking as the real space lattice expands. sternemann01 ; huotari02 A previous study on the temperature dependence of the isotropic Compton profile of MgB2 has shown that a unit cell volume expansion of 0.3% results in a CP difference with a similar magnitude as we observed in our experiment.nygard04 ; joshi07 In the case of LiF it has been observed that approximately 0.7% change in the unit cell volume results in an anisotropy Compton profile with maximum amplitude of 0.2%.erba15 Since the density change across the MIT in VO2 equals only to 0.05%, we conclude that scaling the unit cell dimensions by a few per cent would not be able to produce such a dramatic difference.
Lastly, we consider thermal motion. X-ray diffraction has revealed that the V atoms is VO2 have large root-mean-square thermal displacements in the R-phase. mcwhan74 The effects of phonons on the EMD in sodium has been discussed earlier,olevano12 and the authors argued that it causes momentum density redistribution only in the close vicinity of the highest occupied momentum states. The large thermal displacements in VO2, that correspond to instantaneous deviations from average bond lengths, however suggest that neglect of thermal motion may be a contributing factor. It is known from studies of molecular systems that small differences in intra-molecular covalent bond lengths can induce large oscillations in difference Compton profiles.hakala06 ; jcp_nygard07 Nygård et al.nygard06 demonstrated that an internuclear Li-O distance variation of approximately 10 % in a Li-H2O cluster could reverse the sign of the profile difference at . A similar study on water also demonstrated that for molecules, the profiles are more sensitive to bond lengths than bond angles.hakala06 To gain insight on the expected order of magnitude Compton profile difference caused by V-O bond stretching and compression, we performed Compton profile calculations on a V2O9H10 molecule. We observed that modest V-O bond length changes of the order 1% can cause a CP difference of the order 0.1% at small . We note that the Compton profile of water-ethanol mixtures has been shown to be sensitive to bond length differences of the order 0.001 Å. juurinen11 Thus we suggest that the difference may also have a contribution from thermal motion.
A detailed analysis of the respective roles of the above-mentioned effects possibly explaining the observed discrepancy are the subject of future work. We suggest that the most major contributions to the observed discrepancy originate from correlation effects beyond LSDA/LSDA+U, and possibly partly owing to thermal motion. The effects of local moment formation in the R phase may also give significant contributions. Thermal motion is especially relevant for the R phase, for which large thermal amplitudes of the V atoms have been observed. This can lead to overly narrow Compton profile in combination with correlation effects, which might explain the large amplitude-difference. For the M1 phase the correlation effects are more relevant.
5 Conclusions
The effect of the MIT on the electron momentum density of VO2 was studied using Compton scattering and DFT calculations. We demonstrate that the difference Compton profile capture a signal of the phase transition even in the spherically averaged Compton profile. We observed a difference between the results of the experiment and theoretical calculations, which we suggest to trace back to post-LDA/LDA+U exchange correlation effects and possibly to some extent to thermal motion. The observed discrepancy highlights the sensitivity of the Compton profile to the approximations made in first principles simulations.
6 Authors contributions
All authors contributed equally to the article.
7 Acknowledgements
This work was supported by the Academy of Finland (grants 1283136, 1254065, 1259526, 1295696). The authors wish to acknowledge CSC — IT Center for Science, Finland, for computational resources.
References
- (1) P. Eisenberger, P. Platzman, Phys. Rev. A 2, 415 (1970)
- (2) B. Barbiellini, A. Koizumi, P.E. Mijnarends, W. Al-Sawai, H. Lin, T. Nagao, K. Hirota, M. Itou, Y. Sakurai, A. Bansil, Phys. Rev. Lett. 102, 206402 (2009)
- (3) Y. Sakurai, M. Itou, B. Barbiellini, P.E. Mijnarends, R.S. Markiewicz, S. Kaprzyk, J.M. Gillet, S. Wakimoto, M. Fujita, S. Basak et al., Science 332, 698 (2011)
- (4) N. Hiraoka, T. Buslaps, V. Honkimäki, H. Minami, H. Uwe, Phys. Rev. B 71, 205106 (2005)
- (5) N. Hiraoka, T. Buslaps, V. Honkimäki, J. Ahmad, H. Uwe, Phys. Rev. B 75, 121101 (2007)
- (6) A. Shukla, B. Barbiellini, A. Erb, A. Manuel, T. Buslaps, V. Honkimäki, P. Suortti, Phys. Rev. B 59, 12127 (1999)
- (7) S. Huotari, J.A. Soininen, T. Pylkkänen, K. Hämäläinen, A. Issolah, A. Titov, J. McMinis, J. Kim, K. Esler, D.M. Ceperley et al., Phys. Rev. Lett. 105, 086403 (2010)
- (8) P. Eisenberger, W.A. Reed, Phys. Rev. B 9, 3237 (1974)
- (9) M. Imada, A. Fujimori, Y. Tokura, Rev. Mod. Phys. 70, 1039 (1998)
- (10) F.J. Morin, Phys. Rev. Lett. 3, 34 (1959)
- (11) M. Marezio, D.B. McWhan, J.P. Remeika, P.D. Dernier, Phys. Rev. B 5, 2541 (1972)
- (12) C. Blaauw, F. Leenhouts, F. van der Woude, G.A. Sawatzky, Journal of Physics C: Solid State Physics 8, 459 (1975)
- (13) S. Shin, S. Suga, M. Taniguchi, M. Fujisawa, H. Kanzaki, A. Fujimori, H. Daimon, Y. Ueda, K. Kosuge, S. Kachi, Phys. Rev. B 41, 4993 (1990)
- (14) S. Suga, A. Sekiyama, S. Imada, T. Miyamachi, H. Fujiwara, A. Yamasaki, K. Yoshimura, K. Okada, M. Yabashi, K. Tamasaku et al., New Journal of Physics 11, 103015 (2009)
- (15) R. Eguchi, M. Taguchi, M. Matsunami, K. Horiba, K. Yamamoto, Y. Ishida, A. Chainani, Y. Takata, M. Yabashi, D. Miwa et al., Phys. Rev. B 78, 075115 (2008)
- (16) M.W. Haverkort, Z. Hu, A. Tanaka, W. Reichelt, S.V. Streltsov, M.A. Korotin, V.I. Anisimov, H.H. Hsieh, H.J. Lin, C.T. Chen et al., Phys. Rev. Lett. 95, 196404 (2005)
- (17) S. Biermann, A. Poteryaev, A.I. Lichtenstein, A. Georges, Phys. Rev. Lett. 94, 026404 (2005)
- (18) R.M. Wentzcovitch, W.W. Schulz, P.B. Allen, Phys. Rev. Lett. 72, 3389 (1994)
- (19) S. Kim, K. Kim, C.J. Kang, B.I. Min, Phys. Rev. B 87, 195106 (2013)
- (20) V. Eyert, Phys. Rev. Lett. 107, 016401 (2011)
- (21) A. Continenza, S. Massidda, M. Posternak, Phys. Rev. B 60, 15699 (1999)
- (22) M. Gatti, F. Bruneval, V. Olevano, L. Reining, Phys. Rev. Lett. 99, 266402 (2007)
- (23) R. Grau-Crespo, H. Wang, U. Schwingenschlögl, Phys. Rev. B 86, 081101 (2012)
- (24) S.B. Dugdale, T. Jarlborg, Solid state communications 105, 283 (1998)
- (25) C. Sternemann, T. Buslaps, A. Shukla, P. Suortti, G. Döring, W. Schülke, Phys. Rev. B 63, 094301 (2001)
- (26) S. Huotari, K. Hämäläinen, S. Manninen, C. Sternemann, A. Kaprolat, W. Schülke, T. Buslaps, Phys. Rev. B 66, 085104 (2002)
- (27) A. Erba, J. Maul, M. Itou, R. Dovesi, Y. Sakurai, Phys. Rev. Lett. 115, 117402 (2015)
- (28) J.T. Okada, P.H.L. Sit, Y. Watanabe, Y.J. Wang, B. Barbiellini, T. Ishikawa, M. Itou, Y. Sakurai, A. Bansil, R. Ishikawa et al., Phys. Rev. Lett. 108, 067402 (2012)
- (29) J.T. Okada, P.H.L. Sit, Y. Watanabe, B. Barbiellini, T. Ishikawa, Y.J. Wang, M. Itou, Y. Sakurai, A. Bansil, R. Ishikawa et al., Phys. Rev. Lett. 114, 177401 (2015)
- (30) K. Nygård, S. Huotari, K. Hämäläinen, S. Manninen, T. Buslaps, N. Hari Babu, M. Kambara, D.A. Cardwell, Phys. Rev. B 69, 020501 (2004)
- (31) K. Joshi, B. Sharma, Journal of Applied Physics 102, 103713 (2007)
- (32) L. Chioncel, D. Benea, S. Mankovsky, H. Ebert, J. Minár, Phys. Rev. B 90, 184426 (2014)
- (33) D.B. McWhan, M. Marezio, J.P. Remeika, P.D. Dernier, Phys. Rev. B 10, 490 (1974)
- (34) J.M. Longo, P. Kierkegaard, Acta Chem. Scand. 24, 420—426 (1970)
- (35) M.M. Qazilbash, A. Tripathi, A. Schafgans, B.J. Kim, H.T. Kim, Z. Cai, M. Holt, J. Maser, F. Keilmann, O. Shpyrko et al., Physical Review B 83, 165108 (2011)
- (36) P. Holm, Phys. Rev. A 37, 3706 (1988)
- (37) R. Ribberfors, Phys. Rev. B 12, 2067 (1975)
- (38) P. Holm, R. Ribberfors, Phys. Rev. A 40, 6251 (1989)
- (39) W. Kohn, L.J. Sham, Phys. Rev. 140, A1133 (1965)
- (40) http://elk.sourceforge.net (2015)
- (41) A. Liebsch, H. Ishida, G. Bihlmayer, Phys. Rev. B 71, 085109 (2005)
- (42) X. Yuan, Y. Zhang, T.A. Abtew, P. Zhang, W. Zhang, Phys. Rev. B 86, 235103 (2012)
- (43) D. Ernsting, D. Billington, T.D. Haynes, T.E. Millichamp, J.W. Taylor, J.A. Duffy, S.R. Giblin, J.K. Dewhurst, S.B. Dugdale, Journal of Physics: Condensed Matter 26, 495501 (2014)
- (44) F. Biggs, L. Mendelsohn, J. Mann, Atomic Data and Nuclear Data Tables 16, 201 (1975)
- (45) J. Lehtola, M. Hakala, J. Vaara, K. Hämäläinen, Phys. Chem. Chem. Phys. 13, 5630 (2011)
- (46) B. Králik, P. Delaney, S.G. Louie, Phys. Rev. Lett. 80, 4253 (1998)
- (47) C. Filippi, D.M. Ceperley, Phys. Rev. B 59, 7907 (1999)
- (48) I. Kylänpää, Y. Luo, O. Heinonen, P.R.C. Kent, J. Krogel, submitted
- (49) V. Olevano, A. Titov, M. Ladisa, K. Hämäläinen, S. Huotari, M. Holzmann, Phys. Rev. B 86, 195123 (2012)
- (50) M. Hakala, K. Nygård, S. Manninen, L.G.M. Pettersson, K. Hämäläinen, Phys. Rev. B 73, 035432 (2006)
- (51) K. Nygård, M. Hakala, T. Pylkkänen, S. Manninen, T. Buslaps, M. Itou, A. Andrejczuk, Y. Sakurai, M. Odelius, K. Hämäläinen, The Journal of Chemical Physics 126, 154508 (2007)
- (52) K. Nygård, M. Hakala, S. Manninen, K. Hämäläinen, M. Itou, A. Andrejczuk, Y. Sakurai, Phys. Rev. B 73, 024208 (2006)
- (53) I. Juurinen, K. Nakahara, N. Ando, T. Nishiumi, H. Seta, N. Yoshida, T. Morinaga, M. Itou, T. Ninomiya, Y. Sakurai et al., Phys. Rev. Lett. 107, 197401 (2011)