Phase Boundary Exchange Coupling in the Mixed Magnetic Phase Regime
of a Pd-doped FeRh Epilayer
Abstract
Spin-wave resonance measurements were performed in the mixed magnetic phase regime of a Pd-doped FeRh epilayer that appears as the first-order ferromagnetic-antiferromagnetic phase transition takes place. It is seen that the measured value of the exchange stiffness is suppressed throughout the measurement range when compared to the expected value of the fully ferromagnetic regime, extracted via the independent means of a measurement of the Curie point, for only slight changes in the ferromagnetic volume fraction. This behavior is attributed to the influence of the antiferromagnetic phase: inspired by previous experiments that show ferromagnetism to be most persistent at the surfaces and interfaces of FeRh thin films, we modelled the antiferromagnetic phase as forming a thin layer in the middle of the epilayer through which the two ferromagnetic layers are coupled up to a certain critical thickness. The development of this exchange stiffness is then consistent with that expected from the development of an exchange coupling across the magnetic phase boundary, as a consequence of a thickness dependent phase transition taking place in the antiferromagnetic regions and is supported by complimentary computer simulations of atomistic spin-dynamics. The development of the Gilbert damping parameter extracted from the ferromagnetic resonance investigations is consistent with this picture.
I Introduction
B2-ordered FeRh undergoes a first order metamagnetic phase transition from an antiferromagnet (AF) to a ferromagnet (FM) on heating through a transition temperature K Fallot and Hocart (1939). The proximity of the transition to room temperature and its sensitivity to external stimuli Staunton et al. (2014); Kouvel (1966); Barua et al. (2013); Wayne (1968); Annaorazov et al. (1996); Maat et al. (2005) make it an excellent candidate for use in possible magnetic memory devices architectures Thiele et al. (2003); Cherifi et al. (2014); Lee et al. (2015), including those involving AF spintronics Marti et al. (2014); Moriyama et al. (2015). Coexistence of the two magnetic phases whilst the material undergoes the transition has been well studied using various magnetic imaging techniques Baldasseroni et al. (2012); Kinane et al. (2014); de Vries et al. (2014); Baldasseroni et al. (2015); Almeida et al. (2017); Temple et al. (2018). This region of the transition is known as the mixed magnetic phase (MMP) and has AF material in direct contact with FM material, meaning there is potential for an exchange coupling between the two phases. Any interphase exchange coupling may affect the transition kinetics and the performance of FeRh based devices Moriyama et al. (2015).
The properties of this exchange coupling remain elusive. There have been claims that it has been measured using ferromagnetic resonance (FMR) experiments, which saw a change in the anisotropy field that develops when entering the MMP from the fully FM regime Mancini et al. (2013). However, this behavior has also been attributed to the field due to magnetoelastic effects at the film/substrate interface Kumar et al. (2018) and general phase coexistence Heidarian et al. (2017). More recently, vertical exchange bias and enhanced coercivity, indicative of an interphase exchange coupling, has been seen in FeRh Gray et al. (2019). The direct study of the influence of any such coupling in the GHz regime is of importance for the design of FeRh based spintronic devices that are expected to operate on ns timescales.
Spin-wave resonance (SWR) is an extension of FMR in which higher-order non-uniform modes are studied. The fact that the magnetization flexes out of a non-uniform state allows for the extraction of the exchange stiffness of the magnetic material including magnetic multilayers Goennenwein et al. (2003); Klingler et al. (2015); Yin et al. (2017); Coey (2012a); van Stapele et al. (1985). In SWR, pinning conditions allow for the excitation of perpendicular standing spin-waves (PSSWs) for external magnetic fields applied perpendicularly to the film surface Coey (2012a). The frequency of the PSSW of mode number , , is determined by the exchange stiffness across the film thickness such that van Stapele et al. (1985); Ŝipr et al. (2019),
| (1) |
where is the FMR mode frequency, is the spectroscopic splitting factor extracted from the behavior of the FMR mode, is the Planck constant and is the saturation magnetization Coey (2012a).
Here, we present SWR investigations on a Pd-doped FeRh epilayer within the MMP regime. The Pd doping was used to reduce to an experimentally convenient value. We found that the measured value of is suppressed compared to the expected value of the FM phase for even the slightest deviation in the phase volume fraction from a fully FM state. This is attributed to the influence of the AF phase, which is seen to contribute to the measured exchange stiffness. The behavior of the exchange stiffness within the AF layer is shown, using computer simulations of atomistic spin dynamics, to correspond to the development of the exchange coupling across the magnetic phase boundary as a consequence of a thickness dependent phase transition (TDPT) in the AF layer. These findings are also supported by the behavior of the Gilbert damping parameter extracted from the FMR measurements.
II Sample Growth and Characterization
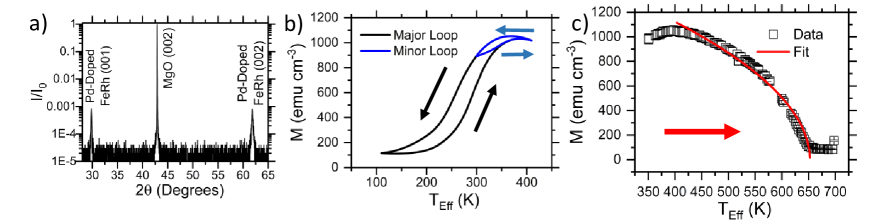
The B2-ordered Pd-doped FeRh epilayer was grown using DC magnetron sputtering. The MgO substrate was annealed overnight at 700∘C, the sample was then deposited at a substrate temperature of 600∘C and annealed in situ at 700∘C for 1 hour. 3% Pd doping on the Rh site was used to lower so the transition spanned room temperature Kouvel (1966); Barua et al. (2013) to match the capabilities of the measurement apparatus. The sample thickness was measured using x-ray reflectivity as nm. X-Ray diffraction (XRD), shown in Fig. 1(a), shows the and Pd-doped FeRh reflections astride the central substrate peak, which confirms the presence of an epitaxial growth having a B2 order parameter Warren (1969); Le Graët et al. (2013); de Vries et al. (2013) and a lattice constant Å.
The magnetic behavior of the sample was measured using a SQUID-vibrating sample magnetometer (VSM) between 100 and 400 K in a 1 T field that was applied in the film plane, and is shown in Fig. 1(b). The black curve shows the major loop where the transition is completed in both directions. As it was not possible to cool below room temperature during the SWR experiment, a minor loop taken through the available temperature range (290-400 K) is also shown by the blue line, for comparison with the SWR data. The temperature scale used here is the effective temperature, , which is used as the measure of position within the transition as external magnetic fields affect Kouvel (1966); Maat et al. (2005); Annaorazov et al. (1996); Barua et al. (2013). is calculated via , where is the measured sample temperature and KT-1 when cooling and KT-1 when heating. These values were measured by tracking the transition midpoint of our film through a range of fields Maat et al. (2005). The saturation magnetization at the temperature when the transition is completed is T, with a moment per Fe atom of .
Fig. 1(c) shows the magnetization at higher temperatures which is fitted to to extract the Curie temperature, K with , which gives good agreement with the mean-field model, which predicts Blundell (2001). We then calculated the exchange constant for the fully FM regime, , using the mean field model via J Stöhr and Siegmann (2006). For the purposes of this calculation it was not possible to measure the value of for the fully FM phase and so we took , as measured previously Mancini et al. (2013). It has been shown previously using computer simulations of atomistic spin-dynamics that the metamagnetic transition in B2-ordered FeRh can be replicated by modelling only the Fe moments and treating their interactions due to the Rh moment as higher-order exchange interactions between quartets of adjacent Fe atoms Barker and Chantrell (2015). FeRh therefore can be modelled as a simple cubic structure comprising only Fe atoms, which makes . It is then possible to convert this to an exchange stiffness for the fully FM regime, , using the following relation pJm-1, where is the spin per atom calculated from Coey (2012b).
III Spin-Wave Resonance Measurements
For the SWR measurements the sample was placed face down on a two-port coplanar waveguide with a ceramic heater used for temperature control. The external magnetic field, was applied perpendicular to the film surface and transmission through the waveguide was measured using a vector network analyzer. The transmission through the waveguide is measured using either or and is presented as , where is the magnitude of the trace. As the transition temperature in FeRh is sensitive to the application of Kouvel (1966); Maat et al. (2005); Annaorazov et al. (1996); Barua et al. (2013), the frequency was swept between 0.01 to 26 GHz to identify the resonance positions, whilst was held constant at 50 mT intervals between 1.4 and 2 T. These measurements were performed at various temperatures on both the heating and cooling branches of the transition from the close to the fully FM state ( K) down to where SWR modes could no longer be observed ( K). The available temperature range in this experiment is between 301 and 338 K and was limited by the experimental apparatus.
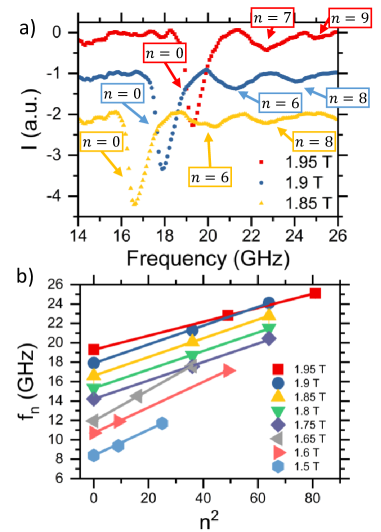
Fig. 2(a) shows an example set of SWR frequency spectra taken at K on the heating branch, which are labeled with the assigned PSSW mode number. They show prominent FMR modes along with higher frequency modes corresponding to SWR excitations. Fig. 2(b) shows the frequency for the PSSW excitation for a given mode number, , against for the spectra in panel (a) of the same figure. The solid lines in this figure are linear fits to the data that are used, along with Eq. 1, to extract for each value of in a measurement set, which is then converted to values of . The linear relationship between and seen in Fig. 2(b) confirms the validity of equation 1 to explain the behavior here.
In SWR, the mode number of the excited PSSWs is very dependent on the boundary conditions acting on the spin wave modes within the system Seavey and Tannenwald (1958); Schmool and Barandiaran (1998); Schoen et al. (2015). In our FeRh epilayer, there would be boundary conditions to satisfy at either end of the film thickness, as well as those present at any interface between the two magnetic phases. This makes the exact boundary conditions difficult to discern. To account for this we assumed that PSSWs with both odd and even mode numbers are capable of being excited in this system. These conditions have been previously applied to systems in which a uniform magnetization with asymmetric pinning conditions at either end of the film thickness Schoen et al. (2015), as well as systems that are exchange coupled at the interface between two layers Qin et al. (2018). Equation 1 states that when the mode numbers are correctly assigned that is constant. This condition, alongside checking the distance between adjacent PSSW modes against the expected distance for a set of mode numbers was used to assign the mode numbers. In Fig. 2(b) it is clear that not all the assigned mode numbers are consecutive and there are some that are missing. This is attributed to the fact that the model used in this work may not accurately reflect the exact pinning conditions of the FeRh system.
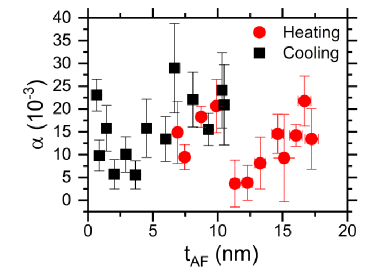
The dependence of on effective temperature is shown in Fig. 3(a). In this calculation of it is assumed, for reasons explained later, that the PSSW excitations span the entire film thickness. The values of are calculated using equation 1 and the data shown in Fig. 2(b) for all measurements where the PSSW peaks are discernible from the background. Due to the large spread in the data for , a symmetric rolling nine-point weighted average was performed to smooth the data. The behavior of the smoothed exchange stiffness, , is shown against in Fig. 3(b). From this figure it can be seen that there are two peaks in when cooling at and 350 K and one when heating at K. These peaks are superimposed upon an overall decrease in with decreasing across the measurement range.
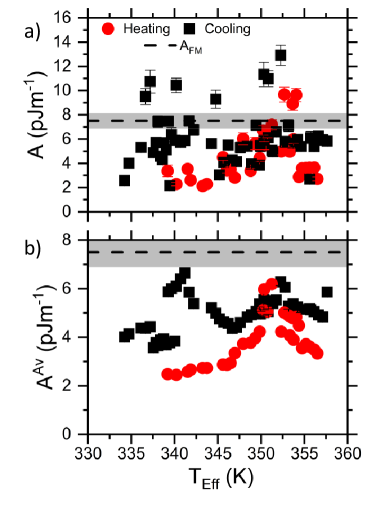
It is also clear here that the values of consistently fall short of the value of . It is important to note that the SWR apparatus was tested by performing measurements on a permalloy (Ni0.81Fe0.19) film, yielding a value of pJm-1, which is consistent with the value obtained by Schoen et al. Schoen et al. (2015), when using the value of extracted from Shaw et al. Shaw et al. (2013). Again, in the calculation of for Py, the same method was used to assign the mode numbers as that used for the FeRh system, and mode numbers are seen to be missing there also, which adds credence to the hypothesis that this behavior is real. All of the measurements presented in Fig. 3 take place in regions of the transition away from the fully FM state, and so some volume fraction, however small (see Fig. 1(b)), is in the AF phase in every measurement. Therefore, this deviation from for all measurements implies that the AF phase has a profound effect on the measured value of for this material system. In order to identify why this is the case, a model of how the two magnetic phases develop relative to each other through the transition is required.
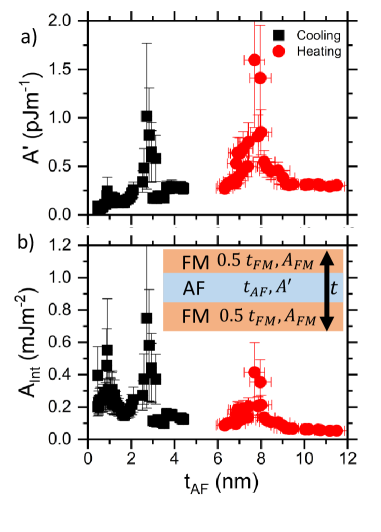
To do this we have developed a simple trilayer model. Photoemission electron microscopy (PEEM) has revealed that the top surface of FeRh can be fully ferromagnetic at a temperature where the sample as a whole is not in the fully FM regime Baldasseroni et al. (2012, 2015). This therefore means that the transition has completed on the top surface, but not in the bulk of the material. Such behavior has also been seen using electron holography, which demonstrated that either surface has a lower transition temperature than the bulk of the material, and so the FM phase nucleates there and permeates into the bulk of the material as the transition progresses Gatel et al. (2017). This picture is also consistent with grazing incidence x-ray diffraction studies of the structural component of the transition Kim et al. (2009) and polarized neutron reflectometry that shows FM order is retained at the film interfaces whilst the interior is AF Fan et al. (2010). In the saturating out-of-plane fields applied in the experiment, the non-uniform in-plane domain structure observed by PEEM will not exist. Therefore, we model the MMP as two layers of FM material that are separated by a layer of AF material and the system can be described as a FM/AF/FM trilayer. A schematic of the model is shown in the inset of Fig. 4(b). In the thermal hysteresis regime the phase volume of the FM phase can be calculated using based in the data in Fig.1(b). Using this model, each of the layers can be described by their thickness. FM domains extend from either surface with total thickness , whilst the AF region has a thickness .
The possibility now arises that the behavior we see here could be due to the confinement of PSSW excitations within these thinner FM layers, changing the value of in Eq. 1. As and decreases across the temperature range here when cooling, according to equation 1 the measured value of would increase across the temperature range. Conversely, when heating would increase across the temperature range here meaning the measured value of would decrease. This is clearly not consistent with our data. Thus we expect that PSSW excitations still span the entire film thickness , and so must travel through the AF layer, which then contributes to the measured behavior. Thus the use of the whole thickness in the initial calculation of is justified. This also provides further justification for the trilayer model in that it can be seen to be consistent with another important feature of the data here, the fact that the SWR signal is lost when there is still a substantial fraction of the material in the FM phase. The portion in the AF phase must laterally span the sample in order for there not to be any regions where a PSSW can vertically span the entire film. A thin AF layer is the only way to do this.
SWR in magnetic multilayers has been considered before by van Stapele et al. van Stapele et al. (1985). In that work it is stated that in magnetic multilayers with interfacial exchange coupling, when the system is driven at the resonant frequency of one of the layers but not the other, the measured value of becomes an effective measure, , across the whole thickness van Stapele et al. (1985). In the van Stapele model, the dormant layers mediate an exchange coupling between the layers driven at resonance, which means now consists of two contributions: the exchange stiffness of the layer driven at resonance and the exchange stiffness of the dormant layer and becomes a volume weighted average of the exchange stiffness for each of the different layers van Stapele et al. (1985). In this scenario, all that is required of the dormant layer is that it possesses an exchange stiffness in order to carry the excitation through the stack van Stapele et al. (1985). This means that the same model can be applied to the case here, where the layer not driven at its resonant frequency is AF.
By taking our measured value and decomposing this average it is possible to calculate the exchange stiffness of the AF layer, . It is important to note that this is not a ferromagnetic exchange stiffness per se, but rather a measure of the rigidity in the spin structure that allows spin waves to propagate. To do this calculation, the FM regions were assigned the value of measured for the fully FM phase, , and both magnetic phases have their thicknesses determined by the trilayer model. In the small wavevector limit, it is possible to calculate using van Stapele et al. (1985),
| (2) |
the results of which are plotted against in Fig. 4(b). Interestingly, when cooling, the value of rises as increases from 0 to 1 nm. This increase then plateaus up to nm, after which peaks at nm. A peak is also seen on the heating branch of the transition at nm. This is also seen to be sitting on a constant background, which is higher than that seen on the cooling branch. The non-zero value of indicates that the AF layer has an exchange stiffness that develops with and contributes to the behavior seen here.
In the van Stapele model, the exchange stiffness of the layer not driven at its resonant frequency, the AF layer in this case, is responsible for the determination of the interfacial exchange coupling strength , such that van Stapele et al. (1985). The behavior of through the measurement range is shown plotted against in Fig. 4(b). is non-zero through the measurement range here and decays in a manner consistent with that expected for an interfacial exchange coupling. Interestingly, superimposed on this characteristic decaying background, there are peaks in the extracted value of that align with those seen in .
The thickness dependence of has been seen before in the context of exchange bias, since it is reminiscent of the development of an exchange field exerted by an AF layer on a FM layer. There it is well understood in terms of the development of AF order in ultrathin films with increasing thickness Ali et al. (2003); Khan et al. (2018); McCord et al. (2004). At the lowest thicknesses, up to 1 or 2 nm, there is no effect of the AF layer on the magnetic properties of the FM, since the material is too thin to possess AF order and presents instead in a paramagnetic (PM) state. However, as the thickness increases the phenomena associated with exchange bias set in, indicating that stable AF-ordered material has appeared, with a characteristic peak in the exchange bias field, often explained in terms of a random field model Malozemoff (1987, 1988), which is similar to that seen here in the AF thickness dependence of . In the case of exchange bias, this behavior can be described by a TDPT between a PM and AF state that takes place in the AF layer, raising the question of whether a similar mechanism might be at play here. The development of an exchange coupling predicted by such a phase transition is consistent with the behavior of seen in this experiment between 0 and 2 nm when cooling. In this case however, FeRh does not exhibit a PM phase between AF and FM when undergoing its phase transition Stamm et al. (2008). Nevertheless, our results suggest that when FM order starts to be lost, the AF layer is unable to establish full AF order until exceeds a critical thickness that is at the position of the peak in . The origin of the peak in seen at around nm is unclear at this stage.
Evidence for phase transitions taking place in AF materials has been seen from the presence of peaks in the Gilbert damping parameter, , when passing through the transition McCord et al. (2004); Frangou et al. (2016). This has been seen for the TDPT in the Py/IrMn system McCord et al. (2004), as well as the transition from an AF to a PM state at the Néel temperature of IrMn in the same material system Frangou et al. (2016). To see if the same behavior is seen here, the behavior of extracted from the experimental FMR mode is shown against in Fig. 5. After fitting a Lorentzian profile to the FMR peaks to extract the linewidth, and the FMR frequency, , it is possible to extract using the following relation,
| (3) |
where is the intrinsic contribution to the linewidth.
In the fully FM regime, has been measured to be by Mancini et al. Mancini et al. (2013). For the closest measurement to the fully FM phase here, which corresponds to nm, we see . Again, here we see that even modest amounts of AF material have a profound effect on the high frequency behavior of the system through mechanisms such as spin pumping. This marked increase in compared to the fully FM phase decreases with increasing , which appears to reach its minimum value when cooling between nm, the same value at which the peak in is seen in the SWR experiment when cooling. Interestingly, for thicknesses in excess of nm, demonstrates a quasi-linear increase with , which is behavior attributed to the dephasing of spin-currents that are pumped into the AF material as they pass through Merodio et al. (2014). The heating arm also demonstrates a similar behavior, though the peak in and the position of the dip in do not line up exactly.
This increase in with thickness compared to measured value for the fully FM phase is again indicative of a TDPT taking place within the AF layer McCord et al. (2004); Frangou et al. (2016). The position in which this TDPT finishes on the cooling arm is unclear, but it occurs somewhere within the nm, as behavior consistent with the presence of bulk AF material is seen after this thickness Merodio et al. (2014). This is the thickness at which the PSSWs are lost in the SWR experiment when cooling. Interestingly, the peak in seen when heating also coincides with the dip seen in for the same transition branch. As is the case with the cooling branch measurements, the PSSW excitations are also lost at thicknesses in excess of this dip which implies that the same behavior is seen on this transition branch also.
However, it is unclear here why the TDPT would lead to an increase in at this stage. To gain a better understanding of the how the interphase exchange coupling affects the physical properties of the system, computer simulations of atomistic spin-dynamics were performed.
IV Computer Simulations of Atomistic Spin-Dynamics
Previously, the first-order phase transition in FeRh system has been modelled on the basis of the different temperature scalings of the bilinear exchange interaction and the higher-order exchange interactions between quartets of Fe atoms known as the four-spin interaction Barker and Chantrell (2015). This model uses the four-spin term to mediate the interactions due to the Rh moment, and it is this interaction that is responsible for the AF ordering at low temperature. The four-spin interaction is more sensitive to temperature fluctuations than the bilinear exchange and breaks down at lower temperatures. At this point, the bilinear exchange, which mediates the FM interactions between adjacent Fe atoms, takes over and the metamagnetic transition occurs. The spin Hamiltonian described in Ref. Barker and Chantrell, 2015 includes the nearest and next-nearest neighbour bilinear and four-spin interaction terms, and here includes the uniaxial anisotropy, , such that:
| (4) | |||||
where and represent the bilinear and four-spin exchange interactions between Fe atomic sites with spin and represents the easy axis direction. We performed simulations using this Hamiltonian using the Vampire software package Evans et al. (2014).
The experimental setup is replicated exactly in the simulations, with an in-plane RF field applied at frequency whilst a static field is applied perpendicular to the film plane. The spins are pinned at either end of the film thickness. The Fourier transform of the time dependence of the in-plane magnetization component is taken as the simulated SWR spectra. The thermal hysteresis associated with the first-order phase transition requires the coexistence of the two magnetic phases and ordinarily needs to be assured by a large enough system size. The system size is limited here by the computationally expensive nature of the four-spin exchange term, which means it is necessary to artificially introduce the AF regions in these systems. Our modelling is therefore not intended to fully quantitatively match the experimental results, but rather to capture the same physics in a semi-qualitative way.
To achieve this we turned again to our trilayer model, and defined a region in the middle of the system, atomic planes thick, that has its four-spin exchange interaction strength increased to . This creates a region with a higher than its surroundings, where . For a given temperature range this generates a FM/AF/FM trilayer geometry, just like that in Fig. 4, as can be seen in Fig. 6(c). is varied to simulate different points within the transition. This amounts to varying , and hence , in the terminology of the previous section. The parameters used in the simulations are taken from Ref. Barker and Chantrell, 2015 and are presented in Table 1, with the exception of the value of the , which was taken from Ref. Ostler et al., 2017.
| Quantity | Value |
|---|---|
| J | |
| J | |
| J | |
| J | |
| J | |
| T | |
| T | |
| varied GHz | |
| 0, 2, 4, 10 & 20 | |
| 0.01 or 1 |
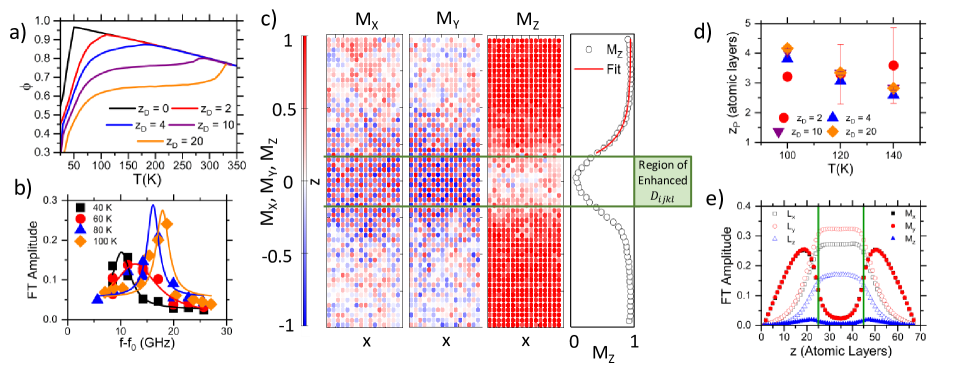
The simulated temperature dependent magnetization for each value of using the experimental configuration is shown in Fig. 6(a). Adding the intermediate region of enhanced four-spin interactions gives a wide range of temperatures where the MMP regime exists, yielding broad transitions qualitatively comparable to the experimental sample.
The Fourier-transformed first SW modes for the system, shown in Fig. 6(b), show a reduction in resonant frequency and amplitude with falling temperature, consistent with the experimental results. The quantitative discrepancies between experiment and the simulations for the SW modes is due to differences in thickness, with the difference in temperatures due to the smaller system sizes used in the simulations. In this experiment the value of is used. To look for evidence of the interphase exchange coupling, field cooled simulations were performed and the magnetic structure through the stack was visualised.
The simulated system was field cooled under T from 750 K to either 100, 120, or 140 K for 1 ns and then allowed to evolve for the same time again, by which time the system had equilibrated. To help aid the quick settling of the state, the value of the Gilbert damping parameter was set to the artificially high value of . An example of this final state for the system is shown in Fig. 6(c). In this figure, the colour in the stack represents the direction and strength of the magnetization at each point. The colour scale used is shown on the left-hand side of panel (c). The FM order along the direction of is evident either side of the region encompassed by . Within that region, shown in green here, in-plane AF order is present. As the AF order is known to orient itself perpendicularly to the applied field to minimize the energy in this system Marti et al. (2014), this configuration is expected. It also demonstrates the recovery of the trilayer configuration using varying values of for the different magnetic phases. Just outside the region of enhanced , there is an ambiguous spin structure that exhibits aspects of both AF and FM order.
One would naïvely expect that of the sixty layers in total, only the ten layers with an enhanced four-spin interaction would be in the AF phase, leading to a . From the magnetization profiles in Fig. 4(a), it can be seen that the system actually exhibits at this temperature, equivalent to 18 layers being in the AF phase. We ought therefore to expect to find the equivalent of four layers of full AF order on each side of the region described by . Consulting Fig. 6(c) we can see that in fact this region is smeared out over a greater distance with partial FM and AF order. The fully AF region contained within has a profound effect on the notionally FM material around it, overcoming to a considerable extent the bilinear exchange interaction. This is consistent with our experimental observation that even a small departure of from 1 leads to a marked effect on the measured exchange stiffness.
In order to quantitatively analyse the extent of this region, the average magnetization per layer starting from the region encompassed by is fitted to , where is the layer index, is the amplitude of magnetization weakening and represents the lengthscale on which FM order is recovered. An example of this fitting is seen in Fig. 6(c) with the average value of extracted for a selection of time-steps taken after the field-cooling protocol has finished is shown in Fig. 6(d). These averages are calculated assuming that everything outside of a 95% confidence level is an outlier, which are not considered in the calculation. The fit shown in Fig. 6(c) is not used in the calculation of the average and is shown as a representative example.
The results for show that between 2 and 5 atomic layers in each of the regions outside have their magnetic order changed from fully FM by proximity to the enhanced four-spin interaction region, depending on temperature and . The saturation value of corresponds to a thickness of nm, which agrees reasonably well the position of the plateau seen in the behavior of for the cooling branch measurements. This then adds credence to the idea that the behavior of measured in the experiment can be interpreted as a development of an exchange coupling across the AF/FM interface with increasing . The development of this exchange coupling with thickness is attributed to a TDPT that takes place in the AF layer: below a critical thickness set by there will be no fully AF region within the middle of the nucleus that is making a transition out of the fully AF state. the appearance of this full AF order is a candidate for the TDPT that is analogous to the one that occurs in exchange bias systems.
From the behavior of and seen in the experiment, the TDPT finishes between nm, which is in excess of the plateau associated with the establishment of the exchange coupling. From the simulations of the SWR modes in Fig. 6(b) it is known that the PSSWs travel through the AF layer in order to give modes that span the total thickness of the layer. The experiment also suggests that the PSSWs pass through bulk AF material so long as it is sufficiently thin: but cannot penetrate more than several nm since that is when the SWR resonances are lost in the experiment. Therefore, in order to identify how these excitations travel through the AF layer in the experiment, investigations into the development of the spin-wave transmission through the AF layer with thickness were made.
In AF/FM bilayers that are driven at the resonant frequency of the FM layer, theory predicts that the exchange coupling at the interface can excite collective excitations of the Neél vector, , with denoting the AF sublattice magnetization in the AF layer Khymyn et al. (2016). Due to the difference in the resonant frequencies of the two layers, these excitations of the Neél vector travel only a finite distance through the AF layer and are therefore known as evanescent SWs (ESWs) Khymyn et al. (2016). These ESWs have been seen to carry spin-currents through distances up to 10 nm in the AF insulator NiO Wang et al. (2014); Khymyn et al. (2016) and so could be responsible for the transmission of the PSSW through the AF layer seen in this experiment down to the temperature at which become too large and the connection between the FM layers, and hence the PSSW mode, is lost. Fig. 6(e) shows the amplitude of the Fourier transform for each of the directional components of both and the magnetization vector through the stack, in the simulated = 20 system at 120 K. The value of is again used in this experiment. Here, it is clear that the amplitude of the Fourier transform of is non-zero for all directional components in the region defined by , as are the corresponding values of . This implies that there is a coherent rotation of the Neél order within the bulk AF material that carries the PSSW excitation through the AF layer. As the simulations treat all materials as electrical insulators and do not consider the contribution of electrons Evans et al. (2014), the observation of ESWs and excitations of PSSWs in the simulations confirm that this is a mechanism by which the PSSW can pass through the AF layer. Also, as the ESWs require an exchange coupling between the AF/FM boundary, it also constitutes proof of the existence of a coupling between the two layers in the simulation, consistent with that seen in the experiment in Fig. 4(b).
In the experimental situation however, we do not have exactly this situation since both magnetic phases of FeRh are metallic de Vries et al. (2013), and spin-currents could pass through the AF layer via electrons as well as the magnon flows that occur in insulators. In the thickness regime in which the TDPT occurs, there will be little magnon spin-pumping due to the lack of a well-defined Neél vector in the AF layer. However, after a given thickness when regions of stable AF material with a common Neél vector are present, ESWs could be excited in this system. As the increase in occurs in the thickness regime in which the TDPT is close to its conclusion from the behavior of , this peak in may then correspond to the point at which ESWs are excited in the experiment. The introduction of ESWs into the system will provide another channel through which the PSSW can travel through the AF layer and will increase the exchange energy within this layer and therefore . As these ESWs by nature only travel a finite distance through the AF layer, it is believed that the disappearance of on both transition branches corresponds to the thickness in which the ESWs can no longer pass through the AF layer.
The PSSW excitations are seen for much larger on the heating branch of the transition when compared to the cooling branch. The critical thickness, , at which these TDPT take place is determined by the strength of the exchange coupling and the anisotropy energy of the AF layer, , such that Radu (2005). The discrepancy in where the TDPT takes place between the transition branches then implies either: the exchange coupling is higher on the heating branch than it is when cooling, or that the anisotropy energy of the AF layer is much lower when heating compared to cooling. It has been previously demonstrated that the anisotropy energy of both the FM and AF phases are largely invariant through the range of the transition probed here Clarkson et al. (2017), which implies that the difference in the thickness range of the TDPT is due to the size of the interlayer exchange coupling. A higher value of the interlayer exchange coupling when heating compared to cooling would explain the asymmetry seen between the transition branches for the extracted values of seen in Fig. 3(b) and the increase in the baseline upon which the peak in is situated in Fig. 4(a), as well as the larger the observation of PSSW excitations through larger seen in the experimental data in Fig. 4. The reason for this larger exchange coupling when heating is unclear at this stage. It is also not possible to explain the peak in seen in this transition branch, as it falls outside the thickness regime where the TDPT is expected and does not align with the dip in extracted from the FMR measurements.
V Conclusion
To conclude, SWR measurements of a Pd-doped FeRh epilayer taken during the metamagnetic transition reveal a reduced value of the measured exchange stiffness when compared to the value for the fully FM phase. By introducing the trilayer model it is possible to demonstrate that this suppression of the measured value of the exchange stiffness is due to the contribution of the AF material. The AF layer contributes an effective exchange stiffness, , to the measured value. is seen to be highly dependent on the thickness of the AF layer, increasing to a plateau initially and then peaking for measurements performed when cooling. The development of the with is then consistent with the development of an exchange coupling across the phase boundary due to a TDPT in the AF layer. Evidence for the presence of a TDPT in the AF layer is also provided by the behavior of the Gilbert damping parameter, , calculated from the FMR measurements. A peak is also seen on top of a flat signal for the heating branch.
To identify the origin of these features complementary simulations of atomistic spin-dynamics were performed using the same geometry and conditions as the experiment. The AF phase fraction was controlled by introducing a thin layer of variable thickness in which the strength of the four-spin interaction was enhanced relative to its surroundings. A similar reduction of SWR mode frequency with temperature was observed in the simulations. These simulations reveal that the exchange coupling across the magnetic phase boundary introduces regions of weakened FM exchange in the AF region, implying that the TDPT observed in the experiment takes place between a disordered intermixed phase in the AF layer, to a globally order bulk-like AF phase. The simulations also reveal that ESWs are present that carry the excitation through bulk AF material. Again, by comparing the behavior of and , it is possible to attribute the peak seen in to the introduction of ESWs into the system as the TDPT in the AF layer finishes. The properties of the exchange coupling are also seen to be asymmetric depending on the temperature sweep direction.
The influence of the interphase exchange coupling and its development through the transition with the thickness of the AF layer should be considered in the design of FeRh-based spintronic devices, particularly those intended to operate at GHz frequencies.
Acknowledgements.
J.M., K.M. and M.S. contributed equally to this work. This work was supported by the Diamond Light Source, the UK EPSRC (grant number EP/M018504/1), the Advanced Storage Research Consortium and a Grant-in-aid for Scientific Research on Innovative Area, “Nano Spin Conversion Science” (Grant No. 26103002).References
- Fallot and Hocart (1939) M. Fallot and R Hocart, “On the appearance of ferromagnetism upon elevation of the temperature of iron and rhodium,” Rev. Sci. 8, 498 (1939).
- Staunton et al. (2014) J. B. Staunton, R. Banerjee, M. Dos Santos Dias, A. Deak, and L. Szunyogh, “Fluctuating local moments, itinerant electrons, and the magnetocaloric effect: Compositional hypersensitivity of FeRh,” Phys. Rev. B 89, 054427 (2014).
- Kouvel (1966) J. S. Kouvel, “Unusual nature of the abrupt magnetic transition in FeRh and its pseudobinary variants,” J. Appl. Phys. 37, 1257 (1966).
- Barua et al. (2013) R. Barua, F. Jiménez-Villacorta, and L. H. Lewis, “Predicting magnetostructural trends in FeRh-based ternary systems,” Appl. Phys. Lett. 103, 102407 (2013).
- Wayne (1968) R. C. Wayne, “Pressure dependence of the magnetic transitions in Fe-Rh alloys,” Phys. Rev. 170, 523 (1968).
- Annaorazov et al. (1996) M. P. Annaorazov, S. A. Nikitin, A. L. Tyurin, K. A. Asatryan, and A. Kh Dovletov, “Anomalously high entropy change in FeRh alloy,” J. Appl. Phys. 79, 1689 (1996).
- Maat et al. (2005) S. Maat, J. U. Thiele, and E. E. Fullerton, “Temperature and field hysteresis of the antiferromagnetic-to-ferromagnetic phase transition in epitaxial FeRh films,” Phys. Rev. B 72, 214432 (2005).
- Thiele et al. (2003) J. U. Thiele, S. Maat, and E. E. Fullerton, “FeRh/FePt exchange spring films for thermally assisted magnetic recording media,” Appl. Phys. Lett. 82, 2859 (2003).
- Cherifi et al. (2014) R. O. Cherifi, V. Ivanovskaya, L. C. Phillips, A. Zobelli, I. C. Infante, E. Jacquet, V. Garcia, S. Fusil, P. R. Briddon, N. Guiblin, A. Mougin, A. A. Unal, F. Kronast, S. Valencia, B. Dkhil, A. Barthélémy, and M. Bibes, “Electric-field control of magnetic order above room temperature,” Nat. Mater. 13, 345 (2014).
- Lee et al. (2015) Y. Lee, Z. Q. Liu, J. T. Heron, J. D. Clarkson, J. Hong, C. Ko, M. D. Biegalski, U. Aschauer, S. L. Hsu, M. E. Nowakowski, J. Wu, H. M. Christen, S. Salahuddin, J. B. Bokor, N. A. Spaldin, D. G. Schlom, and R. Ramesh, “Large resistivity modulation in mixed-phase metallic systems,” Nat. Comms. 6, 5959 (2015).
- Marti et al. (2014) X. Marti, I. Fina, C. Frontera, Jian Liu, P. Wadley, Q. He, R. J. Paull, J. D. Clarkson, J. Kudrnovský, I. Turek, J. Kuneš, D. Yi, J. H. Chu, C. T. Nelson, L. You, E. Arenholz, S. Salahuddin, J. Fontcuberta, T. Jungwirth, and R. Ramesh, “Room-temperature antiferromagnetic memory resistor,” Nat. Mater. 13, 367 (2014).
- Moriyama et al. (2015) T. Moriyama, N. Matsuzaki, K. J. Kim, I. Suzuki, T. Taniyama, and T. Ono, “Sequential write-read operations in FeRh antiferromagnetic memory,” Appl. Phys. Lett. 107, 122403 (2015).
- Baldasseroni et al. (2012) C. Baldasseroni, C. Bordel, A. X. Gray, A. M. Kaiser, F. Kronast, J. Herrero-Albillos, C. M. Schneider, C. S. Fadley, and F. Hellman, “Temperature-driven nucleation of ferromagnetic domains in FeRh thin films,” Appl. Phys. Lett. 100, 262401 (2012).
- Kinane et al. (2014) C. J. Kinane, M. Loving, M. A. de Vries, R. Fan, T. R. Charlton, J. S. Claydon, D. A. Arena, F. Maccherozzi, S. S. Dhesi, D. Heiman, C. H. Marrows, L. H. Lewis, and S. Langridge, “Observation of a temperature dependent asymmetry in the domain structure of a Pd-doped FeRh epilayer,” N. Jour. Phys. 16, 113073 (2014).
- de Vries et al. (2014) M. A. de Vries, M. Loving, M. McLaren, R. M. D. Brydson, X. Liu, S. Langridge, L. H. Lewis, and C. H. Marrows, “Asymmetric “melting” and “freezing” kinetics of the magnetostructural phase transition in B2-ordered FeRh epilayers,” Appl. Phys. Lett. 104, 232407 (2014).
- Baldasseroni et al. (2015) C. Baldasseroni, C. Bordel, C. Antonakos, A. Scholl, K. H. Stone, J. B. Kortright, and F. Hellman, “Temperature-driven growth of antiferromagnetic domains in thin-film FeRh,” J. Phys. : Cond. Mat. 27, 256001 (2015).
- Almeida et al. (2017) T. P. Almeida, R. Temple, J. Massey, K. Fallon, D. McGrouther, T. Moore, C. H. Marrows, and S. McVitie, “Quantitative TEM imaging of the magnetostructural and phase transitions in FeRh thin film systems,” Sci. Rep. 7, 17835 (2017).
- Temple et al. (2018) R. C. Temple, T. P. Almeida, J. R. Massey, K. Fallon, R. Lamb, S. A. Morley, F. Maccherozzi, S. S. Dhesi, D. McGrouther, S. McVitie, T. A. Moore, and C. H. Marrows, “Antiferromagnetic-ferromagnetic phase domain development in nanopatterned FeRh islands,” Phys. Rev. Mater. 2, 104406 (2018).
- Mancini et al. (2013) E. Mancini, F. Pressacco, M. Haertinger, E. E. Fullerton, T. Suzuki, G. Woltersdorf, and C. H. Back, “Magnetic phase transition in iron rhodium thin films probed by ferromagnetic resonance,” J. Phys. D: Appl. Phys 46, 245302 (2013).
- Kumar et al. (2018) H. Kumar, D. R. Cornejo, S. L. Morelhao, S. Kycia, I. M. Montellano, N. R. Alvarez, G. Alejandro, and A. Butera, “Strain effects on the magnetic order of epitaxial FeRh thin films,” J. Appl. Phys. 124, 085306 (2018).
- Heidarian et al. (2017) A. Heidarian, S. Stienen, A. Semisalova, Y. Yuan, E. Josten, R. Hübner, S. Salamon, H. Wende, R. A. Gallardo, J. Grenzer, K. Potzger, R. Bali, S. Facsko, and J. Lindner, “Ferromagnetic resonance of MBE-grown FeRh thin films through the metamagnetic phase transition,” Physica Status Solidi B 254, 1700145 (2017).
- Gray et al. (2019) I. Gray, G. M. Stiehl, J. T. Heron, A. B. Mei, D. G. Schlom, R. Ramesh, D. C. Ralph, and G. D. Fuchs, “Imaging uncompensated moments and exchange-biased emergent ferromagnetism in FeRh thin films,” Phys. Rev. Materials 3, 124407 (2019).
- Goennenwein et al. (2003) S. T. B. Goennenwein, T. Graf, T. Wassner, M. S. Brandt, M. Stutzmann, J. B. Philipp, R. Gross, M. Krieger, K. Zürn, P. Ziemann, A. Koeder, S. Frank, W. Schoch, and A. Waag, “Spin wave resonance in Ga1-xMnxAs,” Appl. Phys. Lett. 82, 730 (2003).
- Klingler et al. (2015) S. Klingler, A. V. Chumak, T. Mewes, B. Khodadadi, C. Mewes, C. Dubs, O. Surzhenko, B. Hillebrands, and A. Conca, “Measurements of the exchange stiffness of YIG films using broadband ferromagnetic resonance techniques,” J. Phys. D: Appl. Phys 48, 015001 (2015).
- Yin et al. (2017) Y. Yin, M. Ahlberg, P. Dürrenfeld, Y. Zhai, R. K. Dumas, and J. Åkerman, “Ferromagnetic and spin-wave resonance on heavy-metal-doped permalloy films: Temperature effects,” IEEE Magn. Lett. 8, 3502604 (2017).
- Coey (2012a) J. M. D. Coey, “Magnetism and magnetic materials,” (Cambridge University Press, New York, 2012) Chap. 9, p. 315, 3rd ed.
- van Stapele et al. (1985) R. P. van Stapele, F. J. A. M. Greidanus, and J. W. Smits, “The spin-wave spectrum of layered magnetic thin films,” J. Appl. Phys. 57, 1282 (1985).
- Ŝipr et al. (2019) O. Ŝipr, S. Mankovsky, and H. Ebert, “Spin wave stiffness and exchange stiffness of doped permalloy via ab-initio calculations,” arXiv e-prints , 1903.05506 (2019).
- Warren (1969) B. E. Warren, “X-ray diffraction,” (Addison-Wesley Publishing Company, 1969) Chap. 12.
- Le Graët et al. (2013) C. Le Graët, M. A. de Vries, M. McLaren, R. M. D. Brydson, M. Loving, D. Heiman, L. H. Lewis, and C. H. Marrows, “Sputter growth and characterization of metamagnetic B2-ordered FeRh epilayers,” J. Vis. Exper. 80, 50603 (2013).
- de Vries et al. (2013) M. A. de Vries, M. Loving, A. P. Mihai, L. H. Lewis, D. Heiman, and C. H. Marrows, “Hall-effect characterization of the metamagnetic transition in FeRh,” New J. Phys. 15, 013008 (2013).
- Blundell (2001) S. Blundell, “Magnetism in condensed matter,” (Oxford University Press, New York, 2001) Chap. 6.
- Stöhr and Siegmann (2006) J. Stöhr and H.-C. Siegmann, “Magnetism: From fundamentals to nanoscale dynamics,” (Springer Series in Solid State Physics, New York, 2006) Chap. 11.
- Barker and Chantrell (2015) J. Barker and R. W. Chantrell, “Higher-order exchange interactions leading to metamagnetism in FeRh,” Phys. Rev. B 92, 094402 (2015).
- Coey (2012b) J. M. D. Coey, “Magnetism and magnetic materials,” (Cambridge University Press, New York, 2012) Chap. 7, p. 235, 3rd ed.
- Seavey and Tannenwald (1958) M. H. Seavey and P. E. Tannenwald, “Direct observation of spin-wave resonance,” Phys. Rev. Lett. 1, 168 (1958).
- Schmool and Barandiaran (1998) D. S. Schmool and J. M. Barandiaran, “Ferromagnetic resonance and spin wave resonance in multiphase materials: theoretical considerations,” J. Phys. : Cond. Mat. 10, 10679 (1998).
- Schoen et al. (2015) M. A. W. Schoen, J. M. Shaw, H. T. Nembach, M. Weiler, and T. J. Silva, “Radiative damping in waveguide-based ferromagnetic resonance measured via analysis of perpendicular standing spin waves in sputtered permalloy films,” Phys. Rev. B 92, 184417 (2015).
- Qin et al. (2018) H. Qin, S. J. Hämäläinen, and S. van Dijken, “Exchange-torque-induced excitations of perpendicular standing spin waves in nanometer-thick YIG films,” Sci. Rep. 8, 5755 (2018).
- Shaw et al. (2013) J. M. Shaw, H. T. Nembach, T. J. Silva, and C. T. Boone, “Precise determination of the spectroscopic g-factor by use of broadband ferromagnetic resonance spectroscopy,” J. Appl. Phys. 114, 243906 (2013).
- Gatel et al. (2017) C. Gatel, B. Warot-Fonrose, N. Biziere, L. A. Rodríguez, D. Reyes, R. Cours, M. Castiella, and M. J. Casanove, “Inhomogeneous spatial distribution of the magnetic transition in an iron-rhodium thin film,” Nat. Comms. 8, 15703 (2017).
- Kim et al. (2009) J. W. Kim, P. J. Ryan, Y. Ding, L. H. Lewis, M. Ali, C. J. Kinane, B. J. Hickey, C. H. Marrows, and D . A. Arena, “Surface influenced magnetostructural transition in FeRh films,” Appl. Phys. Lett. 95, 222515 (2009).
- Fan et al. (2010) R. Fan, C. J. Kinane, T. R. Charlton, R. Dorner, M. Ali, M. A. de Vries, R. M. D. Brydson, C. H. Marrows, B. J. Hickey, D. A. Arena, B. K. Tanner, G. Nisbet, and S. Langridge, “Ferromagnetism at the interfaces of antiferromagnetic FeRh epilayers,” Phys. Rev. B 82, 184418 (2010).
- Ali et al. (2003) M. Ali, C. H. Marrows, and B. J. Hickey, “Onset of exchange bias in ultrathin antiferromagnetic layers,” Phys. Rev. B 67, 172405 (2003).
- Khan et al. (2018) R. A. Khan, H. T. Nembach, M. Ali, J. M. Shaw, C. H. Marrows, and T. A. Moore, “Magnetic domain texture and the Dzyaloshinskii-Moriya interaction in Pt/Co/IrMn and Pt/Co/FeMn thin films with perpendicular exchange bias,” Phys. Rev. B 98, 064413 (2018).
- McCord et al. (2004) J. McCord, R. Mattheis, and D. Elefant, “Dynamic magnetic anisotropy at the onset of exchange bias: The Ni Fe/ Ir Mn ferromagnet/antiferromagnet system,” Phys. Rev. B 70, 094420 (2004).
- Malozemoff (1987) A. P. Malozemoff, “Random-field model of exchange anisotropy at rough ferromagnetic-antiferromagnetic interfaces,” Phys. Rev. B 35, 3679 (1987).
- Malozemoff (1988) A. P. Malozemoff, “Mechanisms of exchange anisotropy (invited),” J. Appl. Phys. 63, 3874 (1988).
- Stamm et al. (2008) C. Stamm, J.-U. Thiele, T. Kachel, I. Radu, P. Ramm, M. Kosuth, J. Minár, H. Ebert, H. A. Dürr, W. Eberhardt, and C. H. Back, “Antiferromagnetic-ferromagnetic phase transition in FeRh probed by x-ray magnetic circular dichroism,” Phys. Rev. B 77, 184401 (2008).
- Frangou et al. (2016) L. Frangou, S. Oyarzún, S. Auffret, L. Vila, S. Gambarelli, and V. Baltz, “Enhanced spin pumping efficiency in antiferromagnetic IrMn thin films around the magnetic phase transition,” Phys. Rev. Lett. 116, 077203 (2016).
- Merodio et al. (2014) P. Merodio, A. Ghosh, C. Lemonias, E. Gautier, U. Ebels, M. Chshiev, H. Béa, V. Baltz, and W. E. Bailey, “Penetration depth and absorption mechanisms of spin currents in Ir20Mn80 and Fe50Mn50 polycrystalline films by ferromagnetic resonance and spin pumping,” Appl. Phys. Lett. 104, 032406 (2014).
- Evans et al. (2014) R. F. L. Evans, W. J. Fan, P. Chureemart, T. A. Ostler, M. O. A. Ellis, and R. W. Chantrell, “Atomistic spin model simulations of magnetic nanomaterials,” Journal of Physics Condensed Matter 26, 103202 (2014).
- Ostler et al. (2017) T. A. Ostler, C. Barton, T. Thomson, and G. Hrkac, “Modeling the thickness dependence of the magnetic phase transition temperature in thin FeRh films,” Phys. Rev. B 95, 064415 (2017).
- Khymyn et al. (2016) R. Khymyn, I. Lisenkov, V. S. Tiberkevich, A. N. Slavin, and B. A. Ivanov, “Transformation of spin current by antiferromagnetic insulators,” Phys. Rev. B 93, 224421 (2016).
- Wang et al. (2014) H. Wang, C. Du, P. C. Hammel, and F. Yang, “Antiferromagnonic spin transport from into NiO,” Phys. Rev. Lett. 113, 097202 (2014).
- Radu (2005) F. Radu, Fundamental Aspects of Exchange Bias Effect in AF/F Bilayers and Multilayers, Ph.D. thesis, Ruhr-Universität Bochum (2005).
- Clarkson et al. (2017) J. D. Clarkson, I. Fina, Z. Q. Liu, Y. Lee, J. Kim, C. Frontera, K. Cordero, S. Wisotzki, F. Sanchez, J. Sort, S. L. Hsu, C. Ko, L. Aballe, M. Foerster, J. Wu, H. M. Christen, J. T. Heron, D. G. Schlom, S. Salahuddin, N. Kioussis, J. Fontcuberta, X. Marti, and R. Ramesh, “Hidden magnetic states emergent under electric field, in a room temperature composite magnetoelectric multiferroic,” Sci. Rep. 7, 15460 (2017).