U 5 crystal-field ground state of UO2 probed by
directional dichroism in nonresonant inelastic x-ray scattering
Abstract
Nonresonant inelastic x-ray scattering (NIXS) has been performed on single crystals of UO2 to study the direction dependence of higher-order-multipole scattering from the uranium edges (90–110 eV). By comparing the experimental results with theoretical calculations the symmetry of the ground state is confirmed directly as the crystal-field (CF) triplet state within the = 4 manifold. The results also demonstrate that the directional dichroism of the NIXS spectra is sensitive to the CF strength and establish NIXS as a tool for probing CF interactions quantitatively.
Whilst in low energy x-ray spectroscopy the electric-dipole transitions prevail, the advent of high-energy synchrotron radiation has provided the opportunity to explore also higher-order multipole transitions. These transitions are governed by different selection rules that are reaching other final states, offering complementary spectroscopic perspectives. This is especially useful because the different multipole transitions are often well-separated in energy from each other due to the electrostatic interactions in the final state. Furthermore, the bulk sensitivity of hard x-rays offers a clear advantage over soft x-rays, and allows spectroscopy under extreme conditions as well as the study of samples, such as actinides, that must be encapsulated for safety reasons.
One such high-energy technique is nonresonant inelastic x-ray scattering (NIXS), in which a photon-in (), photon-out () process promotes a core electron to an unoccupied valence state. This is given by the transition , where represents a valence shell with electrons, and denotes a hole in the core state. Multipole moments for the transition are allowed by the triangle condition and parity rule = even. Thus for transitions, = 1 (dipole), = 3 (octupole), and (triakontadipole) transitions are allowed. The relative contributions of the multipole moments depend on the value of the momentum transfer . A high intensity of the = 3 and 5 transitions compared to the = 1 is obtained by using a large ( 10 Å-1), as achieved with hard x rays, typically 10 keV, at large scattering angles. NIXS has been well described theoretically and successfully compared to experiments assuming spherical symmetry. Soininen et al. (2005); Larson et al. (2007); Haverkort et al. (2007); Gordon et al. (2008, 2009); Bradley et al. (2010); Caciuffo et al. (2010); Bradley et al. (2011); van der Laan (2012a, b); Willers et al. (2012); Sundermann et al. (2016, 2018) In this Letter we investigate the angular dependence.
NIXS has no intermediate state so that the interpretation is as straightforward as for x-ray absorption spectroscopy (XAS). van der Laan and Figueroa (2014) The momentum transfer q in NIXS takes the place of the light polarization in XAS. Importantly, XAS is almost exclusively governed by dipole transitions, which cannot distinguish between spherical and cubic symmetry, since the transferred angular momentum = 1 branches to a single irreducible representation. However, in NIXS the transitions with angular momentum = 3 and = 5 split in cubic symmetry into three and four different irreducible representations, respectively. Measurements with along different crystal directions therefore can give a nonzero difference signal (directional dichroism) that provides information on the non-sphericity of the electronic ground state. NIXS measurements done by Gordon et al. Gordon et al. (2009) at the Mn edge () on a cubic single crystal of MnO already revealed different spectra for along [111] and [100] directions.
Here we demonstrate the power of the -direction dependence of NIXS in a single crystal of uranium dioxide. UO2 has been studied extensively for more than 50 years. We know that this material has two electrons with a triplet ground state. This information has primarily come from neutron scattering — the crystal-field (CF) splitting was determined in 1989 Amoretti et al. (1989) and the excitation spectrum was reported conclusively in 2011 Caciuffo et al. (2011), after pioneering work 50 years ago. Cowley and Dolling (1968) Extensive theory on the interactions in UO2 Santini et al. (2009) and more recently studies using self-consistent DFT+ calculations and a model Hamiltonian Zhou and Ozoliņš (2011, 2012) have also been reported. Given this profound knowledge of the ground state of UO2, we have performed NIXS experiments to test that the new technique gives the correct results for UO2, establishing the importance of the direction dependence of the NIXS spectra. Comparing experiments with a series of calculations shows unambiguously that the triplet is indeed the ground state. In addition, by extending such calculations to cover different CF strengths, we show that the technique is also sensitive to the magnitude of the crystal field.
NIXS measurements with momentum transfer of = 9.1 Å-1 were done on beamline ID20 at the European Synchrotron Radiation Facility (ESRF) on UO2 crystals with (001) and (111) surfaces. Details of the experimental setup and crystals can be found in the Appendix.
The (e-1) penetration length for x rays of 10 keV into UO2 is 5 m, so this probe is sensitive to the top 2.5 m. This is far greater than any surface effects extend, so NIXS may truly be considered as a bulk probe. Data have been collected at room temperature by scanning the incident energy = + at fixed final energy, covering the energy-transfer interval corresponding to the uranium () absorption edges. The obtained results were consistent with earlier measured angular integrated spectra of UO2. Caciuffo et al. (2010); Bradley et al. (2010)
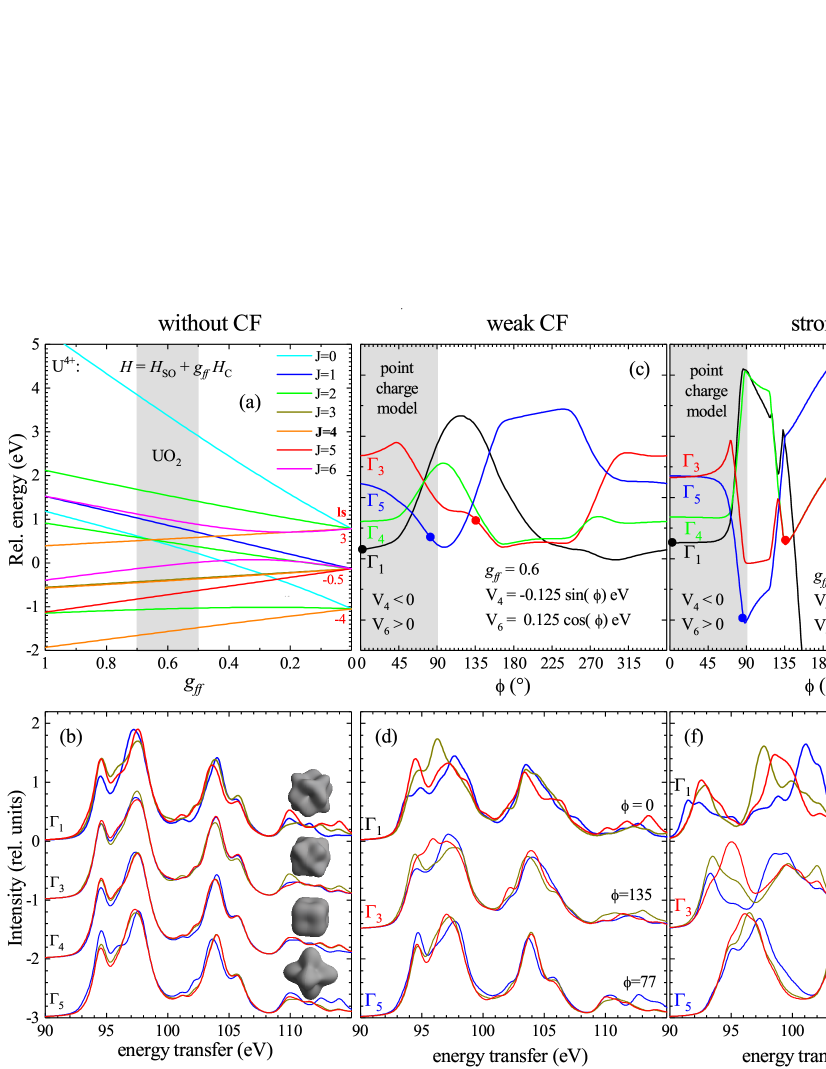
Simulations were performed using the full-multiplet code Quanty Haverkort (2016) that includes Coulomb and spin-orbit interactions. The calculations are based on an ionic approach for the U4+ 5 configuration. In intermediate coupling, the total momentum is a good quantum number and the ground state is = 4 [Fig. 1(a)]. The atomic parameters were calculated using Cowan’s atomic multiplet code Cowan (1981) and the Slater integrals for Coulomb interaction were reduced to account for intra-atomic relaxation effects.Moore and van der Laan (2009) Figure 1(a) shows the energy-level diagram for U4+ 5 as a function of the Slater reduction factor . This reduction factor was adjusted such that the energy distribution of the calculated isotropic and experimental pseudo-isotropic spectra matched. The latter was constructed from the weighted sum of the measured directions; the calculated spectrum is the sum of the diagonal elements of the scattering tensor (see Appendix). Here no CF has been taken into account. For the – and – Coulomb interactions we found reduction factors and that were both equal to 0.6, and the 5 spin-orbit coupling was not reduced. The reduction factors change the overall shape of the isotropic spectra but have no direct influence on the -direction dependence of spectra. For the simulations we used a slightly larger value of than given by the experimental scattering triangle because the radial part of the wave functions is based on the atomic values. A variation of changes slightly the ratio of the multipole contributions. Caciuffo et al. (2010); Sundermann et al. (2016) Finally, a Gaussian and Lorentzian broadening of 0.65 and 0.6 eV FWHM, respectively, accounted for instrumental resolution and life-time effects.
If the Coulomb interaction is much larger than the spin-orbit interaction (-coupling limit) the ground state is , but a finite spin-orbit interaction give intermixing with the and states. In the Stevens approximation, Stevens (1952) which ignores intermixing with 4 levels, the ground state is a mixture of different = 4 levels (see Table I in the Appendix). The CF acts only on and can be written written for the cubic point-group in the basis set. Defining the operator for the phase relation positive, the ninefold = 4 level splits up into
| (17) |
We calculated the NIXS spectra of these eigenstates for different directions [Fig. 1(b)]. The respective two-electron charge densities are displayed as insets. Note that these are the ‘calculations without CF’ since the states were constructed as given above, i.e. in the absence of finite CF. The spectra with [001] (blue) and [111] (red) in Fig. 1(b) show the strongest direction dependence, especially at 95, 97, and 105 eV. Particularly, the and show an opposite direction dependence at these energies. Hence it should be possible to identify a state, which is the CF ground state expected from previous neutron inelastic scattering study.Amoretti et al. (1989)
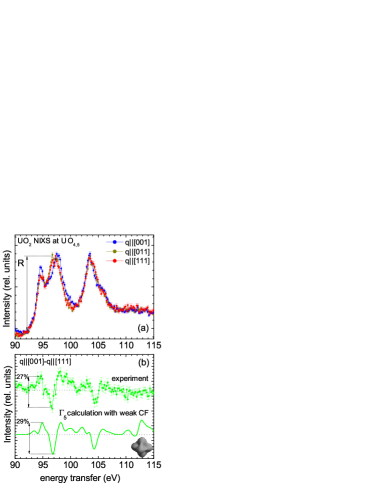
Experimental results are shown in Fig. 2(a). While it is tempting to assign the main peak splitting in the spectra as ( and (), caution should be exercised. In XAS and electron-energy-loss spectroscopy (EELS) the dipole transitions ( = 1) result in a broad peak around 110 eV accompanied by a small prepeak at 105 eV with an energy splitting that is mainly governed by the – exchange interaction. Moore and van der Laan (2009) In NIXS, on the other hand, the observed energy splitting between the (95–97) and 105 eV peaks is primarily due to the core spin-orbit splitting. van der Laan (2012b) The peak at 95 eV arises mainly from = 5 transitions, whereas those at 97 and 105 eV arise from both = 3 and = 5 transitions. According to the spin-orbit sum rule van der Laan (2012a) a change in angular momentum quantum number changes the intensity ratio of the spin-orbit-split peaks. Here instead we will be looking for subtle differences in the angular dependence.
For the actinide , as well as the rare-earth , edges the dipole transitions are strongly broadened due to super-Coster-Kronig decay to continuum states. Terry et al. (2002); Moore and van der Laan (2009) However, compared to the dipole transitions the higher-order multipole transitions, which excite to final states with larger spin and orbital momenta, are shifted towards lower energy due to the strong – exchange interaction. van der Laan (2012b) As a result, higher-order multipole transitions have narrower line width with a broadening primarily determined by the core-hole lifetime.
Figure 2(a) shows the experimental NIXS spectra for the same momentum transfer and directions as in Fig. 1(b), i.e. for [001] (blue), [011] (dark yellow), and [111] (red). Comparing the data and simulations in Figs. 2(a) and 1(b) shows that only the calculation matches the direction dependence of the experimental data.
So far we ignored the intermixing with 4 levels, although mixing is expected in actinide compounds. The question is to what extent this mixing affects the interpretation of the NIXS data. We therefore calculated NIXS spectra for different CF scenarios. Figure 1(c) and 1(e) show the energy-level diagrams for a weak and strong CF potential as a function of the ratio of the CF parameters and . Their ratio is expressed in terms of with and with and 0.5 for the weak and strong CF case, respectively. In the grey-shaded range (), 0 and 0 according to a point-charge model. Lea et al. (1962) The wild dependence of the energy levels in the strong CF case is due to the large intermixing, which in the weak CF case is much more behaved. It turns out that can never be the ground state, and neither can within the point-charge model, in agreement with Lea, Leask, and Wolf.Lea et al. (1962) For the remaining states the direction dependent NIXS spectra have been calculated.
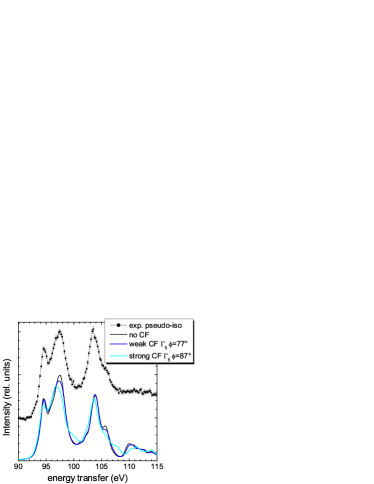
The NIXS spectra for selected CF parameters that produce a (black dots), (red dots), and (blue dots) ground state are shown in Fig. 1(d) and 1(f). The scheme of Amoretti et al. Amoretti et al. (1989) is realized in the weak CF scenario for = 77∘ and that of Rahman & Runciman Rahman and Runciman (1966) in the strong CF case for = 87∘. For the NIXS calculation the reduction factors and line widths are kept unchanged because modifying and does not improve agreement between calculated and measured pseudo-isotropic spectra (see Appendix). Especially the spectra of the and ground states change substantially with increasing intermixing, the lesser so. The mixing factors of the respective ground states are listed in Table I of the Appendix.
Comparison of the calculated CF ground state and data shows that the and still have to be excluded as ground states, both in the weak and strong CF scenarios. The of the strong CF case still shows some resemblance of the measured spectra, e.g., the high energy tail of the peak at 98 eV still shows stronger scattering for [001] than for the two other directions (blue over red and dark yellow). However, the direction dependence at 95 eV is much better reproduced for the weak CF with a ground state. The latter actually describes the data very well. Figure 2(b) shows the excellent agreement of the measured and calculated direction dependence by comparing the difference plots of the [001] and [111] directions. Even the size of the observed dichroism agrees very well with the calculated one, as shown by the relative values of 27% and 29%. These numbers refer to the difference of the two directions at energies indicated in Fig. 2(b), relative to the peak height [as defined in Fig. 2(a)].
We should emphasise that the theoretical dichroism appearing above 110 eV is difficult to observe experimentally because all states at higher energy transfers, i.e. in the energy range of the dipole transition ( 108 eV), Caciuffo et al. (2010); Sundermann et al. (2016) appear strongly broadened due to interaction with continuum states. This increase in lifetime broadening is not captured in the calculations.Sundermann et al. (2018)
The exceptional agreement observed in Fig. 2(b) between experiment and theory shows that the symmetry is unambiguously that of the triplet in the weak CF scenario, i.e. within the = 4 manifold. Other CF symmetries as well as the strong CF scenario can be unambiguously excluded.
Although CF transitions are observed in almost all rare-earth materials with neutron inelastic scattering,Fulde and Loewenhaupt (1985) this is not the case in actinide and some Ce heavy-fermion materials.Gschneidner-Jr.
et al. (1994) For ionic materials, such as UO2, CF-transitions are indeed observed,Amoretti et al. (1989) but for intermetallic systems the conduction electrons interact with the 5 states to cause a severe broadening of the CF transitions. Also XAS and EELS, in which dipole transitions dominate, suffer from severe broadening for intermetallic uranium systems Moore and van der Laan (2009); Jeffries et al. (2010); Wray et al. (2015) so that the excitonic effect of the higher multipole transitions in NIXS offers a great advantage. For UO2, which is cubic, the dipole ( = 1) spectrum cannot provide information on the anisotropy of the charge distribution, so that an examination of higher-order multipole transitions is essential. Hence the NIXS technique represents an alternative method compared to neutron scattering and x-ray absorption spectroscopy to determine the symmetry of the ground state in such materials.
Indeed, such a study has already been published on tetragonal URu2Si2,Sundermann et al. (2016) and the ground-state symmetry was determined but without considering the effect of strong versus weak CF.
Neutron inelastic scattering, however, shows a number of broad CF transitions, and is thus unable to establish the ground state.Santini et al. (2000); Park et al. (2002)
| states | Stevens | weak CF | strong CF | weak CF | strong CF | weak CF | strong CF |
| 0.860 | 0.864 | 0.718 | 0.881 | 0.531 | 0.823 | 0.583 | |
| 0 | 0.002 | 0.010 | 0.011 | 0.105 | 0 | 0 | |
| 0 | 0 | 0.008 | 0.026 | 0.106 | 0.050 | 0.132 | |
| 0 | 0 | 0.047 | 0.013 | 0.101 | 0 | 0 | |
| 0 | 0 | 0.040 | 0 | 0 | 0 | 0 | |
| 0.012 | 0.010 | 0.022 | 0.044 | 0.156 | 0.116 | 0.270 | |
| 0.128 | 0.122 | 0.143 | 0.020 | 0 | 0.006 | 0 | |
| 0 | 0 | 0.002 | 0 | 0 | 0 | 0 | |
| 0 | 0 | 0.006 | 0.004 | 0 | 0.003 | 0.003 | |
| 0 | 0 | 0 | 0 | 0 | 0.002 | 0.010 | |
| 0 | 0 | 0 | 0 | 0 | 0 | 0 | |
| 0 | 0 | 0.004 | 0.002 | 0 | 0 | 0 | |
| 0 | 0 | 0 | 0 | 0 | 0 | 0.002 |
I Appendix
I.1 Experimental details
The NIXS experiment has been performed using the RIXS spectrometer on beamline ID20 at the European Synchrotron Radiation Facility in Grenoble, France.Moretti Sala et al. (2018) The beam generated by three consecutive undulators was monochromatized using a channel-cut Si(311) coupled to a Si(111) double-crystal momochromator, and horizontally focused by a Rh-coated mirror. A set of five spherically-bent Si(660) analyzer crystals with 1 m bending radius, horizontal scattering geometry and vertical Rowland circles, provided an energy resolution of 0.65 eV at a final photon energy = 9.69002 keV, and an intensity of 7 1013 photons/s for a 25 rad vertical divergence of the undulator radiation. The Bragg angle of the analyzers was fixed at 87.5∘. The analyzers were placed at scattering angles 2 = 100, 110, 120, 130, and 140∘. The scattered intensity was recorded by a MAXIPIX fast readout, photon-counting position sensitive detector, achieving up to 1.4 kHz frame rate with 290 s readout dead time, with a pixel size of 55 m and a detection geometry of 256 256 pixels.
For the measurements we used two UO2 single crystals, originally cut and polished by Walt Ellis at Los Alamos National Laboratory Taylor and Ellis (1981), with (001) and (111) surfaces, respectively, and fully described in Ref. Watson et al., 2000. The samples were aligned with the [001] and [111] surface normal parallel to the averaged momentum transfer that points towards 150∘ for elastic scattering. The [011] direction was realized by rotating the [001] crystal accordingly. For data analysis, only data collected in the highest analyzer at 140∘ were used because here the momentum transfer is largest ( = 9.1 Å-1). The corresponding momentum transfer at elastic scattering points towards 160∘, i.e. there is an offset of 10∘ between the respective crystallographic directions and which has been taken into account in the data analysis.
I.2 Calculation of the isotropic spectra
The isotropic spectra have been calculated from the trace of the scattering tensor, which corresponds to an integration over all directions. The Gaussian linewidth is determined by the instrumental resolution, so that only the lifetime (Lorentzian linewidth), Slater reduction factors and , and 5 spin-orbit interaction are adjustable parameters. All calculations in Fig. 3 are performed with the parameters as given in the main text.
The pseudo-isotropic spectrum is a linear combination of the three measured directions that yields an isotropic spectrum for
= 1 and 3, in good agreement with previously measured isotropic specra of UO2. Caciuffo et al. (2010); Bradley et al. (2010)
The prefactors depend on the point group. For the present case: considering = 1 and 3. For = 5 transitions we did not measure enough directions to provide the true isotropic spectrum but the error is negligible when comparing calculations of the true and pseudo-isotropic spectra.
Acknowledgment
We acknowledge beamtime on beamline ID20 at the ESRF in Grenoble under proposal HC-743. M.S. and A.S. benefited from the financial support of the Deutsche Forschungsgemeinschaft (DFG) under grant SE-1441-5-1.
References
- Soininen et al. (2005) J. A. Soininen, A. L. Ankudinov, and J. J. Rehr, Phys. Rev. B 72, 045136 (2005), URL http://link.aps.org/doi/10.1103/PhysRevB.72.045136.
- Larson et al. (2007) B. C. Larson, W. Ku, J. Z. Tischler, C.-C. Lee, O. D. Restrepo, A. G. Eguiluz, P. Zschack, and K. D. Finkelstein, Phys. Rev. Lett. 99, 026401 (2007).
- Haverkort et al. (2007) M. W. Haverkort, A. Tanaka, L. H. Tjeng, and G. A. Sawatzky, Phys. Rev. Lett. 99, 257401 (2007).
- Gordon et al. (2008) R. A. Gordon, G. T. Seidler, T. T. Fister, M. W. Haverkort, G. A. Sawatzky, A. Tanaka, and T. K. Sham, Europhys. Lett. 81, 26004 (2008), URL http://stacks.iop.org/0295-5075/81/i=2/a=26004.
- Gordon et al. (2009) R. Gordon, M. Haverkort, S. Sen Gupta, and G. Sawatzky, J. Phys.: Conf. Ser. 190, 012047 (2009).
- Bradley et al. (2010) J. A. Bradley, S. Sen Gupta, G. T. Seidler, K. T. Moore, M. W. Haverkort, G. A. Sawatzky, S. D. Conradson, D. L. Clark, S. A. Kozimor, and K. S. Boland, Phys. Rev. B 81, 193104 (2010).
- Caciuffo et al. (2010) R. Caciuffo, G. van der Laan, L. Simonelli, T. Vitova, C. Mazzoli, M. A. Denecke, and G. H. Lander, Phys. Rev. B 81, 195104 (2010).
- Bradley et al. (2011) J. A. Bradley, K. T. Moore, G. van der Laan, J. P. Bradley, and R. A. Gordon, Phys. Rev. B 84, 205105 (2011), URL https://link.aps.org/doi/10.1103/PhysRevB.84.205105.
- van der Laan (2012a) G. van der Laan, Phys. Rev. Lett. 108, 077401 (2012a), URL http://link.aps.org/doi/10.1103/PhysRevLett.108.077401.
- van der Laan (2012b) G. van der Laan, Phys. Rev. B 86, 035138 (2012b).
- Willers et al. (2012) T. Willers, F. Strigari, N. Hiraoka, Y. Q. Cai, M. W. Haverkort, K.-D. Tsuei, Y. F. Liao, S. Seiro, C. Geibel, F. Steglich, et al., Phys. Rev. Lett. 109, 046401 (2012).
- Sundermann et al. (2016) M. Sundermann, M. W. Haverkort, S. Agrestini, A. Al-Zein, M. M. Sala, Y. Huang, M. Golden, A. de Visser, P. Thalmeier, L. H. Tjeng, et al., Proc. Nat. Acad. Science. U.S.A. 113, 13989 (2016).
- Sundermann et al. (2018) M. Sundermann, H. Yavaş, K. Chen, D. J. Kim, Z. Fisk, D. Kasinathan, M. W. Haverkort, P. Thalmeier, A. Severing, and L. H. Tjeng, Phys. Rev. Lett. 120, 016402 (2018), URL https://link.aps.org/doi/10.1103/PhysRevLett.120.016402.
- van der Laan and Figueroa (2014) G. van der Laan and A. I. Figueroa, Coord. Chem. Rev. 277-278, 95 (2014).
- Amoretti et al. (1989) G. Amoretti, A. Blaise, R. Caciuffo, J. M. Fournier, M. T. Hutchings, R. Osborn, and A. D. Taylor, Phys. Rev. B 40, 1856 (1989), URL https://link.aps.org/doi/10.1103/PhysRevB.40.1856.
- Caciuffo et al. (2011) R. Caciuffo, P. Santini, S. Carretta, G. Amoretti, A. Hiess, N. Magnani, L.-P. Regnault, and G. H. Lander, Phys. Rev. B 84, 104409 (2011), URL https://link.aps.org/doi/10.1103/PhysRevB.84.104409.
- Cowley and Dolling (1968) R. A. Cowley and G. Dolling, Phys. Rev. 167, 464 (1968).
- Santini et al. (2009) P. Santini, S. Carretta, G. Amoretti, R. Caciuffo, N. Magnani, and G. H. Lander, Rev. Mod. Phys. 81, 807 (2009), URL https://link.aps.org/doi/10.1103/RevModPhys.81.807.
- Zhou and Ozoliņš (2011) F. Zhou and V. Ozoliņš, Phys. Rev. B 83, 085106 (2011), URL https://link.aps.org/doi/10.1103/PhysRevB.83.085106.
- Zhou and Ozoliņš (2012) F. Zhou and V. Ozoliņš, Phys. Rev. B 85, 075124 (2012), URL https://link.aps.org/doi/10.1103/PhysRevB.85.075124.
- Haverkort (2016) M. W. Haverkort, J. Phys.: Conf. Ser. 712, 012001 (2016).
- Cowan (1981) R. D. Cowan, The Theory of Atomic Structure and Spectra (University of California Press, Berkeley, 1981).
- Moore and van der Laan (2009) K. T. Moore and G. van der Laan, Rev. Mod. Phys. 81, 235 (2009).
- Stevens (1952) K. W. H. Stevens, Proc. Phys. Soc. A 65, 209 (1952).
- Terry et al. (2002) J. Terry, R. K. Schulze, J. D. Farr, T. Zocco, K. Heinzelmann, E. Rotenberg, D. K. Shuh, G. van der Laan, D. A. Arena, and J. G. Tobin, Surf. Sci 499, L141 (2002).
- Lea et al. (1962) K. R. Lea, M. J. M. Leask, and W. P. Wolf, J. Phys. Chem. Solids 23, 1381 (1962).
- Rahman and Runciman (1966) H. Rahman and W. Runciman, J. Phys. and Chem. of Solids 27, 1833 (1966), ISSN 0022-3697, URL http://www.sciencedirect.com/science/article/pii/0022369766901144.
- Fulde and Loewenhaupt (1985) P. Fulde and M. Loewenhaupt, Adv. Physics 34, 589 (1985).
- Gschneidner-Jr. et al. (1994) K. A. Gschneidner-Jr., L. Eyring, G. H. Lander, and G. R. Choppin, eds., Handbook on the Physics and Chemistry of Rare Earths, vol. 19 (North-Holland, Amsterdam, 1994), Ch. 130 by E. Holland-Moritz and G. H. Lander and Ch. 131 by G. Aeppli and C. Broholm.
- Jeffries et al. (2010) J. R. Jeffries, K. T. Moore, N. P. Butch, and M. B. Maple, Phys. Rev. B 82, 033103 (2010), URL https://link.aps.org/doi/10.1103/PhysRevB.82.033103.
- Wray et al. (2015) L. A. Wray, J. Denlinger, S.-W. Huang, H. He, N. P. Butch, M. B. Maple, Z. Hussain, and Y.-D. Chuang, Phys. Rev. Lett. 114, 236401 (2015), URL https://link.aps.org/doi/10.1103/PhysRevLett.114.236401.
- Santini et al. (2000) P. Santini, G. Amoretti, R. Caciuffo, F. Bourdarot, and B. Fåk, Phys. Rev. Lett. 85, 654 (2000), URL https://link.aps.org/doi/10.1103/PhysRevLett.85.654.
- Park et al. (2002) J.-G. Park, K. A. McEwen, and M. J. Bull, Phys. Rev. B 66, 094502 (2002), URL https://link.aps.org/doi/10.1103/PhysRevB.66.094502.
- Moretti Sala et al. (2018) M. Moretti Sala, K. Martel, C. Henriquet, A. Al Zein, L. Simonelli, C. Sahle, H. Gonzalez, M.-C. Lagier, C. Ponchut, S. Huotari, et al., J. Synchrotron Rad. 25, 580 (2018).
- Taylor and Ellis (1981) T. N. Taylor and W. P. Ellis, Surface Science 107, 249 (1981).
- Watson et al. (2000) G. M. Watson, D. Gibbs, G. H. Lander, B. D. Gaulin, L. E. Berman, H. Matzke, and W. P. Ellis, Phys. Rev. B 61, 8966 (2000).