The recurrent nova RS Oph – simultaneous B and V band observations of the flickering variability
Abstract
We performed 48.6 hours (in 28 nights) of simultaneous B and V band observations of the flickering variability of the recurrent nova RS Oph in quiescence. During the time of our observations the brightness of the system varied between and the colour in the range . We find that RS Oph becomes more blue, as it becomes brighter, however the hot component becomes more red as it becomes brighter (assuming that the red giant is non-variable). During all the runs RS Oph exhibits flickering with amplitude 0.16 - 0.59 mag in B band. For the flickering source we find that it has colour , temperature in the range , and average radius . We do not find a correlation between the temperature of the flickering and the brightness. However, we do find a strong correlation (correlation coefficient 0.81, significance ) between B band magnitude and the average radius of the flickering source – as the brightness of the system increases the size of the flickering source also increases. The estimated temperature is similar to that of the bright spot of cataclysmic variables. The persistent presence of flickering indicates that the white dwarf is actively accreting material for the next outburst.
keywords:
accretion, accretion discs – stars: binaries: symbiotic – novae, cataclysmic variables – stars: individual: RS Oph1 Introduction
RS Oph (HD 162214) is a symbiotic recurrent nova which exhibits recurrent nova outbursts approximately every 15-20 years. During the outbursts the brightness rises from an initial value of to magnitude. Most likely, the recurrent nova outbursts are the result of a thermonuclear runaway on the surface of the white dwarf (Starrfield 2008), however some authors suggest dwarf nova-like accretion disc instability (King & Pringle 2009; Alexander et al. 2011).
RS Oph contains an M giant mass donor (Dobrzycka & Kenyon 1994; Anupama & Mikołajewska 1999) and a massive (1.2-1.4 ) carbon-oxygen white dwarf (Mikołajewska & Shara 2017). The mass transfer mechanism could be via Roche lobe overflow or stellar wind capture, but it is still the subject of debates (Somero, Hakala & Wynn 2017). Booth, Mohamed & Podsiadlowski (2016) find that the quiescent mass transfer produces a dense outflow, concentrated towards the binary orbital plane, and an accretion disc forms around the white dwarf. A photoionization model of the quiescent spectrum indicates the presence of a low-luminosity accretion disc (Mondal et al. 2018).
Brandi et al. (2009) found that the orbital period of the system is 453.6 d and give a mass ratio , which corresponds to mass of the red giant =0.68–0.80 and an inclination of the orbit . The orbit of the system is consistent with it being circular with period 455.7 d (Fekel et al., 2000).
The most recent nova outburst of RS Oph occurred in 2006 February 12 (Narumi et al. 2006; Evans et al. 2008) and the multiwavelength observations widen our knowledge on the mechanisms and physics of nova explosions and formation of planetary nebulae. The optical and radio observations after the outburst confirmed an asymmetric double-ring structure of the nova remnant (O’Brien et al. 2006; Bode et al. 2007; Rupen, Mioduszewski & Sokoloski 2008). The X-ray observations show that the nova interacts with the dense circumstellar medium leading to deceleration of the material (Sokoloski et al. 2006; Bode et al. 2006). The ejecta have low mass – Mej 10-7 – 10-6 , and high velocity – 4000 km s-1 (Bode et al. 2006; Sokoloski et al. 2006; Vaytet et al. 2011).
The flickering is seemingly irregular with light variations on timescales of a few minutes with amplitude of a few magnitudes. The flickering of RS Oph has been observed by Walker (1977), Bruch (1980), Gromadzki et al. (2006) and others. The study of flickering in any interacting binary system is important because it allows us to probe what is going on in the inner accretion disc regions. The release of luminosity here follows variations at larger accretion disc radii on time-scales of the order, or larger than, the local viscous time-scale. The variations are expected to be of flicker-noise type according to -based accretion disc models pioneered by Lyubarskii (1997). Improving our knowledge of flickering in RS Oph enables us to widen the exploration of the parameter space of accretion discs around mildly compact objects such as its white dwarf companion. In this context, our RS Oph observations contribute to a complementary view of flickering sources beyond previous studies, which have been more focused on black holes in X-ray binary and Active Galactic Nuclei systems. With its unusual flickering properties among symbiotic stars, RS Oph provides an excellent alternative workbench for theorists to put to the test their accretion disc models, and help to understand phenomena such as the widely observed rms-flux relation (see Scaringi et al. 2012).
Here, we report quasi-simultaneous observations of the flickering variability of the recurrent nova RS Oph in two optical bands – B and V and analyze the colour changes, temperature and radius of the flickering source and their response to the brightness variations.


2 Observations
The observations were performed with five telescopes equipped with CCD cameras:
-
•
the 2.0 m telescope of the National Astronomical Observatory (NAO) Rozhen, Bulgaria (Bonev & Dimitrov 2010)
-
•
the 50/70 cm Schmidt telescope of NAO Rozhen
-
•
the 60 cm telescope of NAO Rozhen
-
•
the 60 cm telescope of the Belogradchik Observatory, Bulgaria (Strigachev & Bachev 2011)
-
•
the 41 cm telescope of the University of Jaén, Spain (Martí, Luque-Escamilla, & García-Hernández 2017).
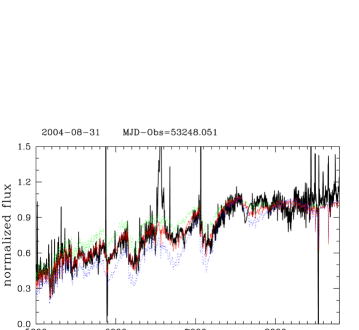
The data reduction was done with IRAF (Tody 1993) following standard recipes for processing of CCD images and aperture photometry. A few comparison stars from the list of Henden & Munari (2006) have been used. On Fig. 1 two examples of our data are given – the observed variability in B and V bands is plotted together with the calculated B-V colour. The typical photometric errors are 0.006 mag in B band and 0.005 mag in V band.
We have 28 nights with simultaneous observations in B and V bands
during the period July 2008 - September 2017. The colour is calculated for 2749 points in total.
During our observations the brightness of RS Oph was:
,
,
,
with mean B = 12.204, mean V = 11.106, mean B-V = 1.098.
The peak-to-peak amplitude of the flickering in B band is in the range 0.16 - 0.59 mag.
The journal of observations is given in Table 1. In the table are given as follows: the date (in format YYYYMMDD), band, the telescope, number of data points over which B-V colour is calculated, average, minimum and maximum magnitude in the corresponding band, dereddened colour of the flickering source and , T1 and T2 - temperature of the flickering source, Rfl and R2 - radius the flickering source. Details of the calculation are given in Sect. 5 below.
3 Interstellar extinction and red giant contribution
3.1 Interstellar reddening
We have nine high resolution spectra obtained with the FEROS spectrograph attached to the 2.2m telescope ESO La Silla and the echelle spectrograph ESPERO at the 2.0m telescope of NAO Rozhen. We compared these spectra with spectra of a few red giants with similar spectral type and measured the equivalent widths of four interstellar features clearly visible in the high resolution spectra. Using the equivalent width of KI and the calibration by Munari & Zwitter (1997), we find . Using the diffuse interstellar bands (DIBs) and results of Puspitarini, Lallement & Chen (2013), we derive for DIB , for DIB 5780 , for DIB 5797 . Taking into account the individual errors, we estimate . This is in agreement with (1) the value given in Snijders (1987) on the basis of UV spectra and to (2) the Galactic dust reddening for a line of sight to RS Oph (NASA/IPAC IRSA: Galactic Reddening and Extinction Calculator) , which should be considered as an upper limit for the interstellar reddening. Hereafter we use .
3.2 Red giant
On basis of the light curves of RS Oph after the 2006 outburst (see Sect. 3 in Zamanov et al. 2015) we estimated that the brightness of the red giant is . To check this value we assume that the ratio between the variable and non-variable part of the hot component contribution to the brightness is equal in U and V bands. The flickering of RS Oph is clearly visible in all UBVRI bands with amplitude increasing to the blue. Using data from Zamanov et al. (2010, 2015), we estimate the magnitude of the red giant in V band to be . This value (although based on an assumption) is in agreement with above.
Shenavrin, Taranova & Nadzhip (2011) found M2pe for the spectral type of the red giant from IR photometry. Mondal et al. (2018) from the absorption band indices derived the spectral type to be M2-M3. Skopal (2015a) found that the radiation from the giant corresponds to its effective temperature K, and the radius . Comparing our spectra with spectra of red giants (Houdashelt et al. 2000; Bagnulo et al. 2003; Zhong et al. 2015), we estimate a similar spectral type M2 III. In Fig.2 we plot one of our spectra of RS Oph. The spectrum is corrected for the interstellar extinction using E(B-V)=0.69, the contribution of the hot continuum is subtracted, and the spectrum is normalized at 8350 Å. The emission lines are not removed. We compared the spectrum with templates of M giants by Zhong et al. (2015). The red line is the template spectrum of an M2III giant from Zhong et al. (2015), for which we achieved the best agreement.
An M2III star is expected to have an effective temperature 3695 – 3750 K, and radius 57.8 – 60.5 (van Belle et al. 1999). For such a giant and solar metallicity models Houdashelt et al. (2000) give K, , , . We adopt for the brightness of the red giant in the optical bands and . The typical error of these magnitudes is about mag.
4 Variability in B and V bands
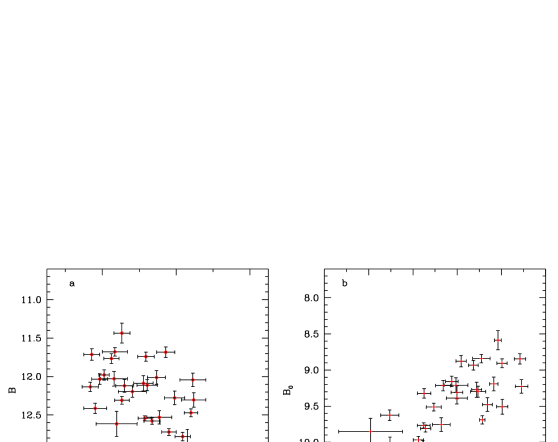
In Fig.5 we plot B versus V band magnitude. In the left panel (Fig. 5a) are the observed magnitudes of RS Oph. In the right panel (Fig. 5b) are the dereddened magnitudes of the hot component (e.g. the red giant contribution is subtracted using the magnitudes given in Sect. 3.2).
4.1 B-V colour
In Fig.5, we plot colour magnitude diagrams. The colour-magnitude diagram is quite different from that of the cataclysmic variable AE Aqr (Zamanov et al. 2017). In the case of AE Aqr all the data occupy a well defined strip, here such a strip is not visible, although the observations from each night are placed on a strip on the diagram. This indicates that the flickering behaviour in the case RS Oph is more complicated and/or with a different mechanism.
In Fig.5, we plot the calculated mean values for each night (one night – one point). The error bars correspond to the standard deviation of the run. It is seen that the system becomes bluer as it becomes brighter, however the hot component becomes redder as it gets brighter. There is a correlation between the mean colour and magnitude of the hot component. The Pearson correlation coefficient is 0.70, Spearman’s (rho) rank correlation – 0.69, the statistical significance . This indicates that the hot component becomes redder as it gets brighter.


5 Flickering light source
In his remarkable paper, Bruch (1992) proposed that the light curve of a white dwarf with flickering can be separated into two parts – constant light and variable (flickering) source. Following his assumptions, we calculate the flux of the flickering light source as , where is the average flux during the run and is the minimum flux during the run (corrected for the typical error of the observations).
An extension of the method is proposed by Nelson et al. (2011), who suggests to use the , where is the maximum flux during the run.
Practically, the method of Bruch (1992) refers to the average luminosity of the flickering source, while that of Nelson et al. (2011) – to its maximal luminosity. and have been calculated for each band, using the values given in Table 1 and the calibration for a zero magnitude star erg cm-2 s-1 Å-1, Å, erg cm-2 s-1 Å-1 and Å as given in Spanish virtual observatory Filter Profile Service (Rodrigo et al. 2018, see also Bessel 1979).
It is worth noting that while the calculated colours of the hot component depend on the assumed red giant brightness, the parameters of the flickering source are independent on the the red giant parameters.
Using method of Bruch (1992), we find that in B band the flickering light source contributes about 13% of the average flux of the system, with . In V band its average contribution is 11%, with .
Using method of Nelson et al (2011), we find that in B band the flickering light source contributes about 25% of the maximal flux of the system, with . In V band its is about 21%, with .
From the amplitude - flux relation (rms-flux relation), we expect that the luminosity of the flickering source will increase as the brightness increases. However, it is not a priori clear which parameter – temperature or radius (or both) increases.
5.1 B-V colour and temperature of the flickering source
The calculated de-reddened colours of the flickering light source are given in Table 1, where is calculated using and , while is calculated using and . Typical error is mag.
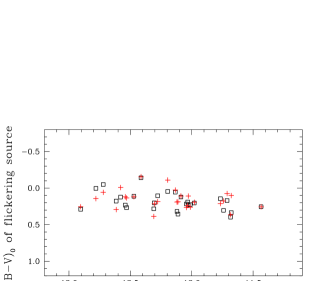
In Fig.7 we plot versus . The solid line represents . To check for a systematic shift between the two methods we performed linear least-squares approximation in one-dimension , when both x and y data have errors. We obtain and . A Kolmogorov-Smirnov test gives Kolmogorov-Smirnov statistic 0.18 and significance level 0.72. It means that both methods give similar results and there is not a systematic shift.
The average difference between them is mag, which is comparable with the accuracy of our estimations. In Fig.7, we plot versus the average B band magnitude. We do not detect a correlation between the colour of the flickering source and brightness.
5.2 Temperature of the flickering source
We calculate the temperature of the flickering source using its dereddened colours and the colours of the black body (Straižys, Sudžius & Kuriliene 1976). is calculated using , and is calculated using . The values are given in Table 1. The two methods give similar results for the temperature of the flickering source as well as for . The average values are and . The slightly larger scatter of the values calculated following Nelson et al. (2011) is due to the fact that is calculated more precisely than .


5.3 Radius of the flickering source
The radius of the flickering source is calculated using the derived temperature (Sect.5.2), B band magnitude and assuming that it is spherically symmetric. We obtain .
In Fig.8 we plot versus the average B band magnitude. It is seen that increases when the brightness of the system increases. When we use all 28 points we find moderate to strong correlation with Pearson correlation coefficient 0.70, Spearman’s (rho) rank correlation 0.73, and statistical significance .
The most deviant point is the run 2012 August 15, the same run that also deviates from the rms-flux relation (see Sect. 6.1 in Zamanov et al. 2015). When we remove this deviating point (due to the low brightness and high amplitude variability, i.e. ), we obtained strong and highly significant correlation between the radius of the flickering source and average B band magnitude of the hot component with Pearson correlation coefficient 0.81, Spearman’s (rho) rank correlation 0.83, statistical significance of the correlation .
We do not detect significant correlation between the brightness and the radius of the flickering source calculated with .
5.4 Luminosity of the flickering source
The luminosity of the flickering source is calculated using the derived temperature and radius given in Table 1 and assuming that it is spherically symmetric: , where is the Stefan-Boltzmann constant. We obtain 27 .
6 Discussion
The flickering variability is typical for the accreting white dwarfs in cataclysmic variables and is considered an observational proof of accretion onto a white dwarf (Sokoloski & Bildsten 2010). It is a relatively rare phenomenon for symbiotic stars. Among more than 200 symbiotic stars known in our Galaxy, flickering is observed only in 11 objects. The last two detected in recent years V648 Car (Angeloni et al. 2013) and EF Aql (Zamanov et al. 2017). The flickering of RS Oph disappeared after the 2006 outburst (Zamanov et al. 2006), reappeared by day 241 of the outburst (Worters et al. 2007), and is visible in all our observations obtained since then to now. This indicates that the white dwarf is accumulating material for the next outburst.
Outbursts of RS Oph have been recorded in 1898, 1933, 1958, 1967, 1985 and most recently in 2006 (Evans et al., 2008; Narumi et al. 2006). According to Schaefer (2010), two outbursts in 1907 and 1945 were missed when RS Oph was aligned with the Sun. The time interval between two consecutive outbursts is between 8.6 and 26.6 years (Schaefer 2010; Adamakis et al. 2011). The last one took place in 2006, which means that the next one can be expected between the time of writing and 2032. We are now well into the observed historic inter-outburst period and we should be alert for the next eruption.
Changes in the emission from H line are detected on time-scales as short as 2 min (Worters & Rushton 2014). This time scale is similar to that of the flickering variability and indicates that the flickering is partly re-processed in the nebula. The variability observed in H could be due to changes in the photoionization of the nebula linked to the flickering activity. Given the discussion in Sect. 6.2 of Sokoloski, Bildsten & Ho (2001) about the difficulty of producing rapid variability from the nebular emission, we expect the rapidly variable component of RS Oph to reflect the physical origin of the variations, for example in the accretion disc (or boundary layer, or hot spot), and not be dominated by nebular features.
In the following paragraphs we discuss the implication of our results for three possible sites of origin of the flickering - the hot spot (e.g. Smak 1971), structures in the accretion disc (e.g. Baptista, Borges & Oliveira 2016) and the boundary layer (e.g. Bruch & Duschl 1993).
6.1 Typical time of the flickering
The wavelet analysis of the flickering of RS Oph performed by Kundra, Hric & Gális (2010) and Kundra & Hric (2014) found two different sources of flickering, the first one with amplitude of 0.1 magnitude and frequency 60-100 cycles per day and the second one with amplitude of 0.6 magnitude and frequency less than 60 cycles per day (with both parameters varying from night to night). Similar frequencies (17 - 144 cycles/day) are also visible in our data (Georgiev et al. 2018). Simon, Hudec & Hroch (2004) using observations with the Optical Monitoring Camera onboard of INTEGRAL satellite, found that the typical frequency was 30-50 cycles/day (i.e. period of 48-29 min) during the observations in 2003. Semiregular oscillations with period min on one night (about 17 cycles per day) have been also detected by Dobrzycka, Kenyon & Milone (1996).
Let us suppose that these quasi-periods correspond to the Keplerian period in the accretion disc around the WD:
| (1) |
where is the gravitational constant, is the distance from the WD, and is the frequency of the variability. For a WD the frequencies correspond to . These values are 5-10 times smaller than the calculated (in Sect. 5.3) average radius of the flickering source. However they are similar to the radii estimated in Sect. 6.3.
6.2 Bright spot
The temperature and the size of the bright spot are derived for a few cataclysmic variables. For OY Car, Wood et al (1989) calculated temperature in the range 8600 – 15000 K; Zhang & Robinson (1987) for U Gem - K; Robinson, Nather & Patterson (1978) give K for the bright spot in WZ Sge. For IP Peg three estimates exist: Marsh (1988) – K, Ribeiro et al. (2007) – 6000-10000 K, Copperwheat et al. (2010) – 7000 - 13000 K. The temperature of the optical flickering source of RS Oph is in the range K (see Sect.4.1), which is similar to the temperature of the bright spot for the CVs.
The bright spot is produced by the impact of the stream on the outer parts of the accretion disc. In case of Roche-lobe overflow this stream is coming from the inner Lagrangian point . If the red giant in RS Oph does not fill its Roche lobe, the white dwarf accretes material from its wind. In this case accretion cone and accretion wake will be formed [see Fig. 1 of Jackson (1975) or Fig. 4 of Ahmad, Chapman & Kondo (1983)]. The stream formed in the accretion wake should be similar to that formed from Roche-lobe overflow.
The luminosity of the bright spot is approximately (Shu 1976; Elsworth & James 1982):
| (2) |
where is the mass accretion rate and is the inward component of the stream’s velocity at the impact with outer disc edge. Eq. 2 indicates that when the mass accretion rate increases, the luminosity of the hot spot also must increase. In addition, our results (Sect.5.3) indicate that when the mass accretion rate increases the radius of the bright spot (if it is the source of flickering) also increases, while its temperature remains almost constant. In this case the quasi-periods (Sect. 6.1) are not connected with the Keplerian rotation but most likely with fragmentation and/or variability in the stream.
6.3 Temperature in the accretion disc
The timescales of changes of the overall structure of the accretion disc (e.g. the mass transfer rate, angular momentum transport, global spiral structure formation) are longer compared to the local fluctuating processes in the flow that are responsible for the flickering activity. In this way the dynamical time scale variability of the flickering light source do not change the overall structure of the accretion disc. Considering the entire disc structure, the temperature in the disc can be approximated with the radial temperature profile of a steady-state accretion disc (e.g. Frank, King & Raine 2002):
| (3) |
is the radial distance from the WD. We assume . In the standard model an white dwarf with mass 1.2-1.4 is expected to have radius 0.006 - 0.002 (e.g. Magano et al. 2017). The average mass accretion rate in quiescence is of about yr-1 (Skopal 2015b). Bearing in mind the variability of the hot component in B band (see Fig. 5b) it implies that the mass accretion rate in quiescence varies approximately from to yr-1.
Using the parameters for RS Oph, a temperature K (the temperature of the flickering light source as derived in Sect. 5.2) should be achieved at a distance from the WD. If the vortexes are 1000 K hotter than their surroundings than this distance is from the WD. These values are similar to the Keplerian radii corresponding to the quasi-periods in the flickering light curves (see Sect. 6.1). If the accretion disc itself (vortexes, blobs or other structures in the disc, e.g. Bisikalo et al. 2001) is the place for the origin of the flickering of RS Oph, then it comes from from the WD.
6.4 X-ray emission from the boundary layer
RS Oph is an X-ray faint recurrent nova. Practically X-ray observations point to a "missing boundary layer" (Mukai 2008). However the flickering source of RS Oph is considerably brighter in the visible and near infrared (V, R and I bands) than the flickering source of T CrB, which is a X-ray bright source (Mukai et al. 2013). For example in R and I bands RS Oph has flickering with an amplitude larger than 0.20 mag, while in T CrB the flickering in R and I bands is with amplitude less than 0.03 mag. In V band RS Oph has flickering with an amplitude larger than 0.30 mag, while T CrB it is mag (e.g. Zamanov et al. 2010, 2016).
If the boundary layer is completely optically thick, this can explain why RS Oph is X-ray faint. In this case the radius of the flickering source measured in the optical bands (Fig. 8) could represent the radius up to which the hard X-rays generated from the boundary layer are effectively processed by the inner parts of the accretion disc and the accretion disc corona.
7 Conclusions
We report our observations of the flickering variability of the recurrent nova RS Oph, simultaneously in B and V bands. We estimate interstellar reddening towards RS Oph and spectral type of the giant M2 III. Subtracting the red giant contribution, we find that dereddened colour of the hot component changes from -0.4 to 0.3 and it becomes redder when it gets brighter.
For the flickering light source in RS Oph, we estimate average , K, which is similar to the temperature of the bright spot in CVs. Its average radius is , and average luminosity L⊙. When the brightness of the hot component increases the temperature of flickering source remains approximately constant and the radius of flickering source increases.
If the flickering of RS Oph is coming from a bright spot our results indicate that when the brightness increases the size of the spot also increases. If the flickering comes from the accretion disc, it is probably generated at distance from the white dwarf.
In any case, the richness of the photometric behaviour reported in this manuscript represents a challenging dataset for further theoretical studies.
Acknowledgements
This work was partly supported by the Program for career development of young scientists, Bulgarian Academy of Sciences (DFNP 15-5/24.07.2017), by grants DN 08/1 13.12.2016, DN 12/13 12.12.2017 (Bulgarian National Science Fund), and AYA2016-76012-C3-3-P from the Spanish Ministerio de Economía y Competitividad (MINECO). We are grateful to an anonymous referee whose comments and suggestions helped to improve the original manuscript.
References
- Adamakis et al. (2011) Adamakis, S., Eyres, S. P. S., Sarkar, A., & Walsh, R. W. 2011, MNRAS, 414, 2195
- Ahmad et al. (1983) Ahmad, I. A., Chapman, R. D., & Kondo, Y. 1983, A&A, 126, L5
- Alexander et al. (2011) Alexander, R. D., Wynn, G. A., King, A. R., & Pringle, J. E. 2011, MNRAS, 418, 2576
- Anupama & Mikołajewska (1999) Anupama, G. C., & Mikołajewska, J. 1999, A&A, 344, 177
- Bagnulo et al. (2003) Bagnulo, S., Jehin, E., Ledoux, C., et al. 2003, The Messenger, 114, 10
- Baptista et al. (2016) Baptista, R., Borges, B. W., & Oliveira, A. S. 2016, MNRAS, 463, 3799
- Bessell (1979) Bessell, M. S. 1979, PASP, 91, 589
- Bisikalo et al. (2001) Bisikalo, D. V., Boyarchuk, A. A., Kilpio, A. A., & Kuznetsov, O. A. 2001, Astronomy Reports, 45, 676
- Bode et al. (2006) Bode, M. F., O’Brien, T. J., Osborne, J. P., et al. 2006, ApJ, 652, 629
- Bode et al. (2007) Bode, M. F., Harman, D. J., O’Brien, T. J., et al. 2007, ApJ, 665, L63
- Bonev & Dimitrov (2010) Bonev, T., & Dimitrov, D. 2010, Bulgarian Astronomical Journal, 13, 153
- Booth et al. (2016) Booth, R. A., Mohamed, S., & Podsiadlowski, P. 2016, MNRAS, 457, 822
- Brandi et al. (2009) Brandi, E., Quiroga, C., Mikołajewska, J., Ferrer, O. E., & García, L. G. 2009, A&A, 497, 815
- Bruch (1980) Bruch, A. 1980, Information Bulletin on Variable Stars, 1805, 1
- Bruch (1992) Bruch, A. 1992, A&A, 266, 237
- Bruch & Duschl (1993) Bruch, A., & Duschl, W. J. 1993, A&A, 275, 219
- Copperwheat et al. (2010) Copperwheat, C. M., Marsh, T. R., Dhillon, V. S., et al. 2010, MNRAS, 402, 1824
- Dobrzycka et al. (1996) Dobrzycka, D., Kenyon, S. J., & Milone, A. A. E. 1996, AJ, 111, 414
- Dobrzycka & Kenyon (1994) Dobrzycka, D., & Kenyon, S. J. 1994, AJ, 108, 2259
- Elsworth & James (1982) Elsworth, Y. P., & James, J. F. 1982, MNRAS, 198, 889
- Evans et al. (2008) Evans, A., Bode, M. F., O’Brien, T. J., & Darnley, M. J. 2008, RS Ophiuchi (2006) and the Recurrent Nova Phenomenon, 401,
- Fekel et al. (2000) Fekel, F. C., Joyce, R. R., Hinkle, K. H., & Skrutskie, M. F. 2000, AJ, 119, 1375
- Frank et al. (2002) Frank, J., King, A., & Raine, D. J. 2002, Accretion Power in Astrophysics, Cambridge University Press
- Georgiev et al. (2018) Georgiev, T., et al. 2012, Bulgarian Astronomical Journal, in preparation
- Gromadzki et al. (2006) Gromadzki, M., Mikolajewski, M., Tomov, T., et al. 2006, Acta Astron., 56, 97
- Henden & Munari (2006) Henden, A., & Munari, U. 2006, A&A, 458, 339
- Houdashelt et al. (2000) Houdashelt, M. L., Bell, R. A., Sweigart, A. V., & Wing, R. F. 2000, AJ, 119, 1424
- Jackson (1975) Jackson, J. C. 1975, MNRAS, 172, 483
- King & Pringle (2009) King, A. R., & Pringle, J. E. 2009, MNRAS, 397, L51
- Kundra et al. (2010) Kundra, E., Hric, L., & Gális, R. 2010, ASP Conf. 435, 341
- Kundra & Hric (2014) Kundra, E., & Hric, L. 2014, Contributions of the Astronomical Observatory Skalnate Pleso, 43, 459
- Lyubarskii (1997) Lyubarskii, Y. E. 1997, MNRAS, 292, 679
- Magano et al. (2017) Magano, D. M. N., Vilas Boas, J. M. A., & Martins, C. J. A. P. 2017, Phys. Rev. D, 96, 083012
- Marsh (1988) Marsh, T. R. 1988, MNRAS, 231, 1117
- Martí et al. (2017) Martí, J., Luque-Escamilla, P. L., & García-Hernández, M. T. 2017, Bulgarian Astronomical Journal, 26, 91
- Mondal et al. (2018) Mondal, A., Anupama, G. C., Kamath, U. S., et al. 2018, MNRAS, 474, 4211
- Mikołajewska & Shara (2017) Mikołajewska, J., & Shara, M. M. 2017, ApJ, 847, 99
- Mukai (2008) Mukai, K. 2008, RS Ophiuchi (2006) and the Recurrent Nova Phenomenon, ASP Conf. 401, 84
- Mukai et al. (2013) Mukai, K., Sokoloski, J. L., Nelson, T., & Luna, G. J. M. 2013, Binary Paths to Type Ia Supernovae Explosions, IAU Symp 281, 186
- Munari & Zwitter (1997) Munari, U., & Zwitter, T. 1997, A&A, 318, 269
- Narumi et al. (2006) Narumi, H., Hirosawa, K., Kanai, K., et al. 2006, IAU Circ., 8671, 2
- Nelson et al. (2011) Nelson, T., Mukai, K., Orio, M., Luna, G. J. M., & Sokoloski, J. L. 2011, ApJ, 737, 7
- O’Brien et al. (2006) O’Brien, T. J., Bode, M. F., Porcas, R. W., et al. 2006, Nature, 442, 279
- Popov & Dimitrov (2011) Popov, V., & Dimitrov, D. 2011, Bulgarian Astronomical Journal, 15, 113
- Puspitarini et al. (2013) Puspitarini, L., Lallement, R., & Chen, H.-C. 2013, A&A, 555, A25
- Ribeiro et al. (2007) Ribeiro, T., Baptista, R., Harlaftis, E. T., Dhillon, V. S., & Rutten, R. G. M. 2007, A&A, 474, 213
- Robinson et al. (1978) Robinson, E. L., Nather, R. E., & Patterson, J. 1978, ApJ, 219, 168
- Rodrigo et al. (….) Rodrigo, C., Solano, E., Bayo, A. http://ivoa.net/documents/Notes/SVOFPS/index.html
- Rupen et al. (2008) Rupen, M. P., Mioduszewski, A. J., & Sokoloski, J. L. 2008, ApJ, 688, 559-567
- Scaringi et al. (2012) Scaringi, S., Körding, E., Uttley, P., et al. 2012, MNRAS, 421, 2854
- Schaefer (2010) Schaefer, B. E. 2010, ApJS, 187, 275
- Shenavrin et al. (2011) Shenavrin, V. I., Taranova, O. G., & Nadzhip, A. E. 2011, Astronomy Reports, 55, 31
- Shu (1976) Shu, F. H. 1976, IAU Symp. 73, 253
- Simon et al. (2004) Simon, V., Hudec, R., & Hroch, F. 2004, Information Bulletin on Variable Stars, 5562, 1
- Skopal (2015) Skopal, A. 2015a, New Astron., 36, 128
- Skopal (2015) Skopal, A. 2015b, New Astron., 36, 139
- Smak (1971) Smak, J. 1971, Acta Astron., 21, 15
- Sokoloski et al. (2001) Sokoloski, J. L., Bildsten, L., & Ho, W. C. G. 2001, MNRAS, 326, 553
- Sokoloski et al. (2006) Sokoloski, J. L., Luna, G. J. M., Mukai, K., & Kenyon, S. J. 2006, Nature, 442, 276
- Sokoloski & Bildsten (2010) Sokoloski, J. L., & Bildsten, L. 2010, ApJ, 723, 1188
- Somero et al. (2017) Somero, A., Hakala, P., & Wynn, G. A. 2017, MNRAS, 464, 2784
- Starrfield (2008) Starrfield, S. 2008, RS Ophiuchi (2006) and the Recurrent Nova Phenomenon, 401, 4
- Straizys et al. (1976) Straizys, V., Sudzius, J., & Kuriliene, G. 1976, A&A, 50, 413
- Strigachev & Bachev (2011) Strigachev, A., & Bachev, R. 2011, Bulgarian Astronomical Journal, 16, 144
- Snijders (1987) Snijders, M. A. J. 1987, Ap&SS, 130, 243
- Tody (1993) Tody, D. 1993, ASP Conf., 52, 173.
- van Belle et al. (1999) van Belle, G. T., Lane, B. F., Thompson, R. R., et al. 1999, AJ, 117, 521
- Vaytet et al. (2011) Vaytet, N. M. H., O’Brien, T. J., Page, K. L., et al. 2011, ApJ, 740, 5
- Walker (1977) Walker, A. R. 1977, MNRAS, 179, 587
- Wood et al. (1989) Wood, J. H., Horne, K., Berriman, G., & Wade, R. A. 1989, ApJ, 341, 974
- Worters et al. (2007) Worters, H. L., Eyres, S. P. S., Bromage, G. E., & Osborne, J. P. 2007, MNRAS, 379, 1557
- Worters & Rushton (2014) Worters, H. L., & Rushton, M. T. 2014, MNRAS, 442, 2637
- Zamanov et al. (2006) Zamanov, R., Boer, M., Le Coroller, H., & Panov, K. 2006, Information Bulletin on Variable Stars, 5733, 1
- Zamanov et al. (2010) Zamanov, R. K., Boeva, S., Bachev, R., et al. 2010, MNRAS, 404, 381
- Zamanov et al. (2015) Zamanov, R., Latev, G., Boeva, S., et al. 2015, MNRAS, 450, 3958
- Zamanov et al. (2017) Zamanov, R. K., Latev, G. Y., Boeva, S., et al. 2017, Astronomische Nachrichten, 338, 598
- Zamanov et al. (2016) Zamanov, R., Semkov, E., Stoyanov, K., & Tomov, T. 2016, The Astronomer’s Telegram, 8675,
- Zhang & Robinson (1987) Zhang, E.-H., & Robinson, E. L. 1987, ApJ, 321, 813
- Zhong et al. (2015) Zhong, J., Lépine, S., Li, J., et al. 2015, Research in Astronomy and Astrophysics, 15, 1154
| DATE | band | telescope | average min max | T1 | Rfl | T2 | R2 | |||||
|---|---|---|---|---|---|---|---|---|---|---|---|---|
| [mag] [mag] [mag] | [K] | [] | [K] | [] | ||||||||
| 20080706 | B | 70cm Sch | 49 | 12.4711 12.380 12.615 | 0.1117 | 10515 | 2.322 | 0.1189 | 10384 | 3.096 | ||
| V | 2.0m Roz | 11.2308 11.168 11.325 | ||||||||||
| 20090615 | B | 60cm Roz | 76 | 11.7666 11.597 11.951 | 0.1442 | 9948 | 3.954 | 0.2118 | 9102 | 6.686 | ||
| V | 60cm Bel | 10.7420 10.581 10.895 | ||||||||||
| 20090721 | B | 60cm Roz | 57 | 12.0280 11.876 12.277 | 0.2302 | 8872 | 4.937 | 0.1083 | 10576 | 4.773 | ||
| V | 60cm Bel | 10.9963 10.891 11.219 | ||||||||||
| 20090723 | B | 70cm Sch | 38 | 11.9789 11.857 12.099 | 0.2025 | 9219 | 3.360 | 0.1927 | 9341 | 4.793 | ||
| V | 2.0m Roz | 10.9740 10.865 11.082 | ||||||||||
| 20100430 | B | 60cm Roz | 62 | 11.7409 11.603 11.848 | 0.3043 | 7964 | 4.732 | 0.1754 | 9558 | 5.199 | ||
| V | 60cm Roz | 10.6227 10.521 10.718 | ||||||||||
| 20100501 | B | 60cm Roz | 66 | 11.4349 11.121 11.612 | 0.2539 | 8576 | 5.936 | 0.2554 | 8558 | 10.7083 | ||
| V | 60cm Roz | 10.3817 10.093 10.541 | ||||||||||
| 20120427 | B | 60cm Roz | 58 | 12.1117 11.934 12.271 | 0.3551 | 7541 | 5.408 | 0.1868 | 9415 | 5.271 | ||
| V | 60cm Bel | 10.9899 10.863 11.138 | ||||||||||
| 20120613 | B | 60cm Roz | 33 | 12.5301 12.380 12.671 | 0.2671 | 8411 | 3.349 | 0.1345 | 10100 | 3.564 | ||
| V | 60cm Roz | 11.3755 11.274 11.492 | ||||||||||
| 20120718 | B | 70cm Sch | 200 | 12.7207 12.617 12.850 | -0.0493 | 14379 | 1.254 | 0.0573 | 11504 | 2.351 | ||
| V | 2.0m Roz | 11.5400 11.462 11.617 | ||||||||||
| 20120721 | B | 60cm Bel | 199 | 12.4126 12.201 12.552 | -0.1415 | 18972 | 1.086 | -0.1561 | 19783 | 1.736 | ||
| V | 60cm Bel | 11.4321 11.288 11.524 | ||||||||||
| 20120815 | B | 60cm Roz | 63 | 12.9043 12.618 13.208 | 0.2897 | 8129 | 4.277 | 0.2549 | 8564 | 5.761 | ||
| V | 70cm Sch | 11.6736 11.452 11.908 | ||||||||||
| 20120816 | B | 2.0m Roz | 185 | 12.7805 12.666 12.897 | 0.0039 | 12783 | 1.358 | 0.1430 | 9962 | 2.887 | ||
| V | 70cm Sch | 11.5624 11.472 11.633 | ||||||||||
| 20130702 | B | 60cm Roz | 46 | 12.1955 11.982 12.368 | 0.0455 | 11718 | 2.422 | -0.1098 | 17211 | 2.321 | ||
| V | 60cm Roz | 11.1140 10.988 11.237 | ||||||||||
| 20130710 | B | 70cm Sch | 127 | 12.0329 11.887 12.207 | 0.1903 | 9371 | 3.784 | 0.2375 | 8781 | 5.997 | ||
| V | 70cm Sch | 11.0399 10.896 11.196 | ||||||||||
| 20130812 | B | 70cm Sch | 335 | 12.1202 11.916 12.270 | 0.3177 | 7852 | 4.796 | 0.1906 | 9368 | 5.476 | ||
| V | 2.0m Roz | 11.0603 10.897 11.203 | ||||||||||
| 20130813 | B | 70Sch+60Roz | 91 | 12.5788 12.476 12.659 | 0.1228 | 10313 | 1.728 | -0.0084 | 13152 | 1.855 | ||
| V | 2.0 m Roz | 11.4438 11.381 11.503 | ||||||||||
| 20130906 | B | 60cm Bel | 39 | 12.0118 11.848 12.152 | 0.2258 | 8928 | 3.779 | 0.2608 | 8490 | 6.376 | ||
| V | 60cm Bel | 10.8648 10.723 10.977 | ||||||||||
| 20140621 | B | 60cm Bel | 65 | 12.5414 12.459 12.614 | 0.2318 | 8852 | 2.199 | 0.1190 | 10382 | 2.469 | ||
| V | 60cm Bel | 11.4264 11.369 11.487 | ||||||||||
| 20140622 | B | 60cm Bel | 104 | 12.6152 12.347 12.864 | 0.1780 | 9525 | 3.305 | 0.2928 | 8090 | 6.958 | ||
| V | 60cm Bel | 11.5765 11.303 11.786 | ||||||||||
| 20140729 | B | 70cm Sch | 32 | 12.3089 12.228 12.430 | 0.2826 | 8218 | 3.619 | 0.3866 | 7278 | 6.191 | ||
| V | 70cm Sch | 11.2557 11.163 11.368 | ||||||||||
| 20140831 | B | 70cm Sch | 54 | 12.0877 11.950 12.303 | 0.1218 | 10331 | 3.434 | 0.1073 | 10595 | 4.361 | ||
| V | 70cm Sch | 10.9762 10.873 11.136 | ||||||||||
| 20160726 | B | 70cm Sch | 63 | 12.3041 12.151 12.471 | 0.2016 | 9230 | 3.367 | 0.2142 | 9072 | 4.993 | ||
| V | 2.0m Roz | 11.0561 10.941 11.174 | ||||||||||
| 20160728 | B | 70cm Sch | 92 | 12.2771 12.084 12.455 | 0.1039 | 10656 | 2.742 | 0.1855 | 9431 | 5.107 | ||
| V | 70cm Sch | 11.0810 10.926 11.201 | ||||||||||
| 20170329 | B | 70cm Sch | 116 | 12.0432 11.925 12.219 | 0.2167 | 9041 | 4.041 | 0.2650 | 8438 | 6.140 | ||
| V | 70cm Sch | 10.7978 10.701 10.924 | ||||||||||
| 20170528 | B | 60cm Bel | 88 | 12.1335 11.960 12.252 | 0.0558 | 11531 | 2.142 | 0.0264 | 12108 | 3.259 | ||
| V | 60cm Bel | 11.1661 11.028 11.262 | ||||||||||
| 20170626 | B | 60cm Bel | 144 | 11.6834 11.557 11.814 | 0.3965 | 7196 | 6.672 | 0.3649 | 7459 | 8.890 | ||
| V | 60cm Bel | 10.5115 10.400 10.632 | ||||||||||
| 20170719 | B | 41cm Jaén | 133 | 11.7123 11.551 11.895 | 0.1709 | 9614 | 4.284 | 0.0747 | 11187 | 4.755 | ||
| V | 41cm Jaén | 10.7409 10.617 10.905 | ||||||||||
| 20170904 | B | 41cm Jaén | 65 | 11.6785 11.557 11.805 | 0.3347 | 7711 | 5.645 | 0.1013 | 10704 | 4.409 | ||
| V | 41cm Jaén | 10.6443 10.567 10.770 |