Common origin for Hercules-Aquila and Virgo Clouds in Gaia DR2
Abstract
We use a sample of 350 RR Lyrae stars with radial velocities and Gaia DR2 proper motions to study orbital properties of the Hercules-Aquila Cloud (HAC) and Virgo Over-density (VOD). We demonstrate that both structures are dominated by stars on highly eccentric orbits, with peri-centres around kpc and apo-centres between 15 and 25 kpc from the Galactic centre. Given that the stars in the HAC and the VOD occupy very similar regions in the space spanned by integrals of motion, we conclude that these diffuse debris clouds are part of the same accretion event. More precisely, these inner halo sub-structures likely represent two complementary not-fully-mixed portions of an ancient massive merger, also known as the “sausage” event.
keywords:
Galaxy: structure – Galaxy : formation – galaxies: individual: Milky Way.1 Introduction
How do you hide the evidence for a massive impact event that caused the extinction of most of the dinosaurs as well as 75% of all species on Earth? You bury it deep under the sea, covered with a layer of sediment taller than the Empire State Building (Hildebrand et al., 1991). Without the discovery of the giant Chicxulub crater, the meteorite impact hypothesis would remain a neat theory supported by striking but indirect evidence. A hypothesis of an ancient dramatic collision between the Milky Way and an unidentified massive dwarf galaxy was put forward by Deason et al. (2013) to explain a particular feature in the overall stellar halo density profile (Watkins et al., 2009; Sesar et al., 2011; Deason et al., 2011). Most recently, through a study of a portion of the nearby stellar halo, Belokurov et al. (2018b) demonstrated that the great impactor must have collided with the young Milky Way on a nearly radial orbit, thus swamping the inner stellar halo with metal-rich material with orbital anisotropy (see Binney & Tremaine, 2008) close to unity. Merger events like this tend to leave behind a battery of debris clouds and shells (see e.g. Johnston et al., 2008; Amorisco, 2015; Hendel & Johnston, 2015), which - akin to the peak rings of impact craters (see e.g. Morgan et al., 2016) - if discovered could help to reconstruct the collision as well as pin down the properties of the progenitor (e.g Sanderson & Helmi, 2013; Johnston, 2016).
Before the Data Release 2 (Gaia Collaboration et al., 2018) of the ESA’s Gaia mission (Gaia Collaboration et al., 2016), five large and diffuse cloud-like structures had been discovered in the Galaxy’s halo. These include: the Virgo Over-Density (VOD, Vivas et al., 2001; Newberg et al., 2002; Duffau et al., 2006; Jurić et al., 2008; Bonaca et al., 2012), the Hercules-Aquila Cloud (HAC, Belokurov et al., 2007; Simion et al., 2014), the Trinagulum-Andromeda structure (Tri-And, Rocha-Pinto et al., 2004; Majewski et al., 2004; Deason et al., 2014), the Pisces Over-density (Sesar et al., 2007; Watkins et al., 2009; Nie et al., 2015) and the Eridanus-Phoenix over-density (Eri-Pho, Li et al., 2016). According to the most recent investigations, Tri-And likely comprises of Galactic disc stars kicked out of the plane in a recent interaction with a dwarf galaxy, probably the Sagittarius dSph (e.g. Price-Whelan et al., 2015; Bergemann et al., 2018; Hayes et al., 2018). Of the remaining four, the Pisces overdensity clearly stands out as it reaches much larger Galacto-centric distances. On the other hand, the VOD, HAC and Eri-Pho structures occupy a very similar range of distances, between 10 and 20 kpc from the Galactic center. This led Li et al. (2016) to suggest that these three Clouds could all be part of one merger event, a galaxy accreted onto the Milky Way on a polar orbit (see also Jurić et al., 2008).
As demonstrated by the recent re-interpretation of the Monoceros Ring (and the associated sub-structures) and the Tri-And, deciphering the nature of halo over-densities is often impossible without either high-resolution spectroscopy (e.g. Bergemann et al., 2018) or accurate astrometry (e.g. de Boer et al., 2018; Deason et al., 2018a). In this Letter, we look for clues to the formation of the Hercules-Aquila and Virgo Clouds using proper motions provided as part of the Gaia DR2. At our disposal are highly pure samples of members of each Cloud, namely the RR Lyrae stars that i) are co-spatial with HAC and VOD in 3-D and ii) that have their line-of-sight velocities measured. By complementing the publicly available 4-D data with the GDR2 proper motions, we build a large tracer set with complete 6-D phase space information and study the make-up of each structure using the orbital properties of the constituent stars.
2 Data and analysis
2.1 4-D RR Lyrae data
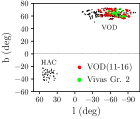
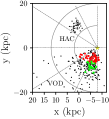
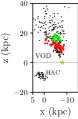
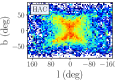
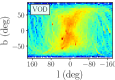
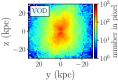
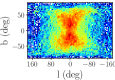
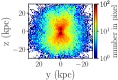
The Hercules-Aquila and Virgo Clouds are diffuse stellar over-densities in the inner stellar halo, located on the opposite sides of the Galaxy (see Figure 1). At high latitudes, these are detected as peaks in RR Lyrae number counts - curiously - at similar heliocentric distances, i.e. 17 kpc (HAC: Watkins et al. 2009; Simion et al. 2014) and 19 kpc (VOD: Vivas & Zinn 2006; Duffau et al. 2014; Vivas et al. 2016). Note that other tracers (e.g. BHBs, MSTO and K and M giants) have also been used to pin down the morphology of the Clouds (see e.g. Belokurov et al., 2007; Jurić et al., 2008; Sharma et al., 2010; Bonaca et al., 2012; Conroy et al., 2018). The RR Lyrae, however offer the clearest view of these halo sub-structures thanks to their associated accurate distances and minuscule Galactic foreground contamination. Therefore, in this work, we have focused on the two recently published samples of RR Lyrae towards the Clouds, where each star has a well-measured line-of-sight velocity. Simion et al. (2018) provide a table of 46 RRL with radial velocity measurements (45 observed at the Michigan-Dartmouth-MIT Observatory and 1 from SDSS) with heliocentric distances between 15 and 18 kpc. Vivas et al. (2016) compiled a catalog of 412 RRL in the region of the sky covered by the VOD with distances between 4 and 75 kpc from the Sun with radial velocity measurements of stars from La Silla-QUEST, QUEST, CRTS and LINEAR.
2.2 From 4-D to 6-D. Velocity distributions
By cross-matching to the GDR2 data with an aperture of 2′′, we have found Gaia counterparts to 44 HAC stars and 411 VOD. From the VOD sample, we remove 112 stars likely belonging to the Sgr stream as identified by (Vivas et al., 2016, , their Group 1). The spatial distribution of the remaining stars (44 from Simion et al. 2018 and 299 from Vivas et al. 2016) with full 6-D phase space measurements is given in Figure 1, in Galactic coordinates in the left panel and in the x-y (x-z) Galactic plane in the middle (right) panel. We adopt a left-handed Galactic Cartesian coordinates with the Sun located at (x⊙,y⊙, z⊙) = (-8,0,0) kpc, the x-axis positive in the direction of the Galactic center, y-axis oriented along the Galactic rotation and the z-axis directed towards the north Galactic pole. While Vivas et al. 2016 identify 6 significant kinematical groups in the VOD region (their table 5), only Group 1 (Sagittarius stream) and 2 (likely members of the VOD, with km/s) contain more than 10 stars. We mark Group 2 stars with green circles in Figure 1. We also mark with red circles the location of a group of stars selected to have galactocentric distances similar to the HAC sample, i.e. kpc to facilitate a fair comparison of their velocities and orbits.
Figure 2 shows the Galacto-centric spherical polar components of the velocities (radial , azimuthal and polar ) of stars in the HAC (top row) and VOD (bottom row) fields. To compute , and we have used astropy (The Astropy Collaboration et al., 2018) with the default values for the Sun’s motion. In the Figure, Group 2 stars (green) can be seen clustering at km/s (by design), while the stars at intermediate (red) seem to have a velocity distribution very similar to those in the HAC, shown in the top row. To estimate the uncertainty in each velocity component we propagate the measured proper motion and line-of-sight velocity errors using Monte-Carlo re-sampling, where we take into account the covariances between the measurements of the right ascension and declination components of proper motion as provided in GDR2. We use the standard deviations of the resulting {, , } distributions as an estimate of the velocity uncertainties; these are shown in Fig. 2.
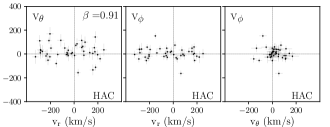
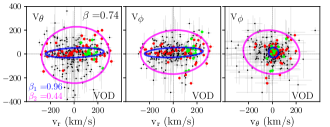
As evident from the Figure, the velocity distributions are highly anisotropic, with the dispersion in the radial component dominating the tangential ones, especially in the HAC data. To describe the shape of the velocity distributions, we model each stellar sample as a single-component multivariate Gaussian using the Extreme Deconvolution (Bovy et al., 2011) method as implemented in (Vanderplas et al., 2012) package. The resulting parameters and the associated uncertainties of the velocity ellipsoids are taken to be the median and the standard deviation values of 500 bootstrap resampling trials. The velocity ellipsoid shape can be summarized using the anisotropy parameter (see Binney & Tremaine, 2008). We find the HAC stars have radially biased orbits with while for the whole of the VOD sample, . Note, however, that the two samples span very different ranges in Galactic and distances. According to Belokurov et al. (2018b), the inner stellar halo can be viewed as a mixture of two debris components with distinct properties. Accordingly, we fit a model with two multivariate Gaussians to the VOD velocity data using Extreme Deconvolution. With log-likelihood of , the two-component model is clearly preferred compared to the single-component one with . The VOD sample appears to be composed of roughly two thirds of stars with highly anisotropic velocity distribution (marked in blue in Fig. 2) and a third with more isotropic velocities (magenta) in good agreement with the results for the local halo presented in Belokurov et al. (2018b).
Using the virial theorem, Myeong et al. (2018b) concluded that the radially anisotropic component of the stellar halo is also significantly flattened vertically. To test this hypothesis, we split the VOD sample into 3 groups according to their distance from the Galactic plane and show the behaviour of the azimuthal and radial velocity distributions in Figure 3. Additionally, for each z slice we have calculated the fraction of Oosterhoff type I (Oo I) RR Lyrae, using equations 1 and 2 in Belokurov et al. (2018a) to explore the changes in the RRL populations. In the 10z/kpc20 range, where the velocity anisotropy is the highest () approaching the value in the HAC field, the Oo I type dominates with the 77 13% fraction. In the same slice, 73% of the stars belong to the more anisotropic (or ‘sausage’ looking) velocity ellipsoid. The slice closer to the galactic plane 0z/kpc10 shows similar properties with anisotropy that is only moderately lower and the fraction of Oo I stars that is broadly consistent with the above at 57 21%. Further from the plane, at z20 kpc, the velocity ellipsoid changes dramatically to almost isotropic with and Oo I type fraction is 64 13%. We note however that in this particular z bin, the value may be affected by the presence of the Sagittarius stream. Group 2 and the stars sharing the same galactocentric distance range with the HAC, are all located at kpc. Interestingly, the HAC counterparts in the VOD (red points) are all clearly part of the anisotropic component. To summarize, it is clear that the velocity ellipsoid shape does change noticeably with vertical height. However, given the limited range of Galactic and in the VOD sample, it is not possible to conclude whether the structure is flattened or simply ends around kpc.

2.3 Orbital Properties
We use the 6-D measurements described above to initialise the RR Lyrae orbits in the HAC and VOD fields. The orbits are integrated using the package (Bovy, 2015) in the recommended Galactic potential model for the Milky Way, MWPotential2014, with parameters given in Table 1 of Bovy (2015). The distribution of orbital properties, i.e. the peri- and apo-centric radii, eccentricities, and the maximal heights above the Galactic plane, are shown in Figure 4. The uncertainties on orbital properties (not shown for VOD to avoid cluttering the figure) are computed by integrating 500 orbits for each star with initial conditions sampled from observables according to the associated uncertainties. The 1-D distributions of the eccentricities, apo-centres and peri-centres are shown in the bottom row of the Figure. We remark that although the default Milky Way mass in , , is somewhat lower than suggested by recent measurements, we have checked that the distributions of the orbital parameters displayed in Figure 4 are minimally affected if we increase the Galaxy’s mass.
The stars in the HAC field typically travel as high as 15 kpc above the Galactic plane. The apo-centres bunch up around 15-20 kpc from the Galactic center - similar to the behaviour of local Main Sequence and BHB stars analysed in Deason et al. (2018b), with a tail to higher values. The distribution of the peri-centric distances of the HAC stars peaks sharply around 1 kpc with most stars having their peri-centers within 5 kpc from the Galactic center. This naturally implies highly eccentric orbits (with eccentricity close to 1) for the vast majority of the HAC stars. Compared to the HAC, the VOD stars explore broader range of apo-centres, with the distribution of the peri-centres much less strongly peaked. As a result, the typical eccentricity for a VOD star is around 0.8. Note however, that a sample of VOD stars comprised of Group 2 (shown in green) and stars that share current Galacto-centric distances with objects in the HAC field appears to have orbital properties much closer to that of HAC. In particular, once the stars with similar distances are selected, the apo-centre and peri-center distance distributions in the two fields look remarkably similar.
The similarity of orbital properties of the HAC and VOD stars is emphasized in Figure 5. Here, we first show the distribution of the components of the angular momentum and for HAC (VOD) stars in the left (middle) panels. The stars in the VOD subset with distances matching HAC stars kpc are shown in red. The right panel presents the behaviour of the total angular momentum as a function of energy. The bulk of the stellar debris in both fields are on high energy, low angular momentum orbits. As evident from the Figure, while stars in both HAC and VOD occupy highly radial orbits, both prograde and retrograde objects exist, with a slight prevalence of the retrograde ones (see also Myeong et al., 2018b, a; Helmi et al., 2018).
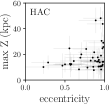
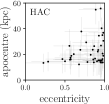
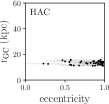
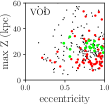
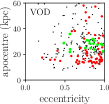
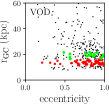
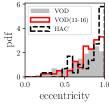
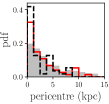
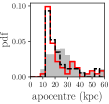
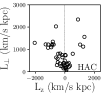
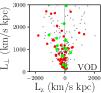
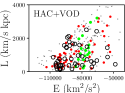
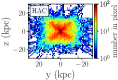
Figure 6 provides an alternative view of the orbital properties of the HAC and VOD stars. Here we have used the stellar 6-D phase-space measurements as initial conditions and integrated the orbits back in time for 8 Gyrs. The Figure shows the density of the test particle positions along each orbit for all orbits across the entire temporal range of the integration. The HAC stars occupy a slightly flattened in the vertical direction and cross-like in the y-z plane and its projection on the sky structure with a density peak at the Galactic centre. Note that some of the appearance of the distribution of debris could be caused by limited footprint and therefore initial conditions of stars with available radial velocity measurements. The VOD stars typically move through very similar regions of the Galaxy (especially the sausage sub-sample shown in the bottom row). While, overall, the match between the stellar debris distributions in Figure 6 is striking, the HAC and VOD stars studied here do not have identical orbital properties. For example, the VOD stars travel further above the Galactic disc, as demonstrated by much rounder, or perhaps even vertically stretched, y-z distribution (right panels). Notwithstanding possible selection effects present in the data, the stellar density distribution shown in Figure 6 looks staggeringly similar to the debris distribution of the simulated accretion event presented in Figure 7 of Simion et al. (2018). This particular merger happened some 11 Gyr ago according to the suite of numerical stellar halo formation models of Bullock & Johnston (2005). Giving the conspicuous similarity in the appearance of the orbital density distributions of the HAC and the VOD stars and the simulated merger example, we conclude that the Hercules-Aquila Cloud and the Virgo Overdensity are both parts of one ancient massive head-on collision.


3 Conclusions
Using a sample of 350 RR Lyrae with full 6-D phase space information, we have studied the orbital properties of the Hercules-Aquila and Virgo Clouds. Both Clouds appear dominated by stars on highly eccentric orbits. Assuming that the kinematics of each structure is well described by a single Gaussian, the orbital anisotropy of the HAC is and for the VOD, . Note, however that the original criteria applied to the CRTS RR Lyrae dataset to select targets for spectroscopic follow-up differ drastically between the HAC and the VOD datasets. The HAC sample covers a very limited region in the of space, while the VOD dataset spans a wide range of longitudes, latitudes and heliocentric distances. It is therefore likely that the VOD dataset contains a mixture of several halo sub-structures (see Vivas et al., 2016, for a detailed discussion). For the entirety of the analysis described here, we made sure to cull the probable Sgr stream members. Additionally, we explore how the VOD’s make-up changes with Galactic height and demonstrate that for kpc, the VOD orbital anisotropy is , while above this threshold, it quickly changes to . We conclude therefore, that an assumption of a single Gaussian for the entire VOD sample is likely not appropriate. Modeling the kinematics of the VOD stars with a mixture of 2 multivariate Gaussians, we show that the VOD can be separated into two components: one with two thirds of the stars and , and the other one with , in good agreement with the local measurement presented in Belokurov et al. (2018b).
As revealed by Gaia, the two structures are composed of stars on nearly radial orbits, with peaks in the eccentricity distribution at 0.95 (0.8) for the HAC (VOD). The distributions of the peri-centric and apo-centric distances also match: the stars in the Clouds turn around at and kpc. Not only the HAC and the VOD look alike kinematically, their orbital composition is in perfect agreement with the stellar halo properties as analysed locally by Belokurov et al. (2018b) and globally (out to 40 kpc) by Deason et al. (2018b). As these authors demonstrate, the inner halo is dominated by metal-rich debris from an old and massive accretion event. In particular, Belokurov et al. (2018b) use Cosmological simulations of the Milky Way halo formation, to bracket the time of the merger - between 8 and 11 Gyr ago - and its mass, which they show to be in excess of . The tell-tale sign of this dramatic head-on collision is the particular shape of the corresponding stellar velocity ellipsoid, which is stretched so much in the radial direction (compared to the tangential ones), that it resembles a sausage. An alternative view of this merger can be found in Myeong et al. (2018b), where the local stellar halo is mapped out in the action space. Here, the metal-rich stars are shown to have an extended radial action distribution in addition to a prominent spray of material on retrograde orbits. The high mass of the progenitor is evidenced not only by the metallicity distribution of its likely members or the numerical simulations of halo formation, but also by a sizeable number of Globular Clusters that could be attributed to the same event (see Myeong et al., 2018c; Kruijssen et al., 2018).
Our interpretation of the nature of the HAC and VOD is in broad agreement with the earlier studies of Johnston et al. (2012) and Carlin et al. (2012) whereby each group of authors have singled out a progenitor on a high eccentricity orbit as a culprit for the production of HAC and VOD respectively. However, for the first time, we connect both of the discussed debris Clouds to a single event with yet higher eccentricity and yet larger mass. Additionally, rather than being a recent accretion, the “sausage” merger likely happened around the epoch of the Galactic disc formation, i.e. between 8 and 11 Gyrs ago (see Belokurov et al., 2018b; Helmi et al., 2018). As seen by Gaia, the HAC and the VOD represent two poorly-mixed portions of the large amount of tidal material dumped onto the Milky Way in that event. While the two Clouds look remarkably similar in the space of the integrals of motion, their orbital properties are not exactly identical. Some of the mismatch could perhaps be attributed to the selection effects. However it is not impossible that the differences we are seeing are related to the details of the merger event itself, e.g. the effects of variable stripping time or the orbital evolution of the progenitor under the action of dynamical friction. Future models of the Clouds’ orbital properties (along the lines of the ideas laid out in e.g. Johnston et al., 2012; Sanderson & Helmi, 2013) will inform our understanding of this dramatic head-on collision that re-shaped the Galaxy.
Acknowledgements
We wish to thank Alis Deason, Kathryn Johnston and Wyn Evans for insightful comments that helped to improve the quality of the manuscript. The research leading to these results has received funding from the European Research Council under the European Union’s Seventh Framework Programme (FP/2007-2013), ERC Grant Agreement n. 308024 and PIFI Grant n. 2018PM0050. ITS and SEK thank the Center for Computational Astrophysics for hospitality.
References
- Amorisco (2015) Amorisco N. C., 2015, MNRAS, 450, 575
- Belokurov et al. (2018a) Belokurov V., Deason A. J., Koposov S. E., Catelan M., Erkal D., Drake A. J., Evans N. W., 2018a, MNRAS, 477, 1472
- Belokurov et al. (2018b) Belokurov V., Erkal D., Evans N. W., Koposov S. E., Deason A. J., 2018b, MNRAS, 478, 611
- Belokurov et al. (2007) Belokurov V., Evans N. W., Bell E. F., Irwin M. J. et al., 2007, ApJ, 657, L89
- Bergemann et al. (2018) Bergemann M., Sesar B., Cohen J. G., Serenelli A. M. et al., 2018, Nature, 555, 334
- Binney & Tremaine (2008) Binney J., Tremaine S., 2008, Galactic Dynamics: Second Edition. Princeton University Press
- Bonaca et al. (2012) Bonaca A., Jurić M., Ivezić Ž., Bizyaev D. et al., 2012, AJ, 143, 105
- Bovy (2015) Bovy J., 2015, ApJS, 216, 29
- Bovy et al. (2011) Bovy J., Hogg D. W., Roweis S. T., 2011, Annals of Applied Statistics, 5
- Bullock & Johnston (2005) Bullock J. S., Johnston K. V., 2005, ApJ, 635, 931
- Carlin et al. (2012) Carlin J. L., Yam W., Casetti-Dinescu D. I., Willett B. A., Newberg H. J., Majewski S. R., Girard T. M., 2012, ApJ, 753, 145
- Conroy et al. (2018) Conroy C., Bonaca A., Naidu R. P., Eisenstein D. J., Johnson B. D., Dotter A., Finkbeiner D. P., 2018, ArXiv e-prints
- de Boer et al. (2018) de Boer T. J. L., Belokurov V., Koposov S. E., 2018, MNRAS, 473, 647
- Deason et al. (2011) Deason A. J., Belokurov V., Evans N. W., 2011, MNRAS, 416, 2903
- Deason et al. (2013) Deason A. J., Belokurov V., Evans N. W., Johnston K. V., 2013, ApJ, 763, 113
- Deason et al. (2014) Deason A. J., Belokurov V., Hamren K. M., Koposov S. E. et al., 2014, MNRAS, 444, 3975
- Deason et al. (2018a) Deason A. J., Belokurov V., Koposov S. E., 2018a, MNRAS, 473, 2428
- Deason et al. (2018b) Deason A. J., Belokurov V., Koposov S. E., Lancaster L., 2018b, ArXiv e-prints
- Duffau et al. (2014) Duffau S., Vivas A. K., Zinn R., Méndez R. A., Ruiz M. T., 2014, A&A, 566, A118
- Duffau et al. (2006) Duffau S., Zinn R., Vivas A. K., Carraro G., Méndez R. A., Winnick R., Gallart C., 2006, ApJ, 636, L97
- Gaia Collaboration et al. (2018) Gaia Collaboration, Brown A. G. A., Vallenari A., Prusti T., de Bruijne J. H. J., Babusiaux C., Bailer-Jones C. A. L., 2018, ArXiv e-prints
- Gaia Collaboration et al. (2016) Gaia Collaboration, Prusti T., de Bruijne J. H. J., Brown A. G. A. et al., 2016, A&A, 595, A1
- Hayes et al. (2018) Hayes C. R., Majewski S. R., Hasselquist S., Beaton R. L. et al., 2018, ApJ, 859, L8
- Helmi et al. (2018) Helmi A., Babusiaux C., Koppelman H. H., Massari D., Veljanoski J., Brown A. G. A., 2018, ArXiv e-prints
- Hendel & Johnston (2015) Hendel D., Johnston K. V., 2015, MNRAS, 454, 2472
- Hildebrand et al. (1991) Hildebrand A. R., Penfield G. T., Kring D. A., Pilkington M., Camargo Z. A., Jacobsen S. B., Boynton W. V., 1991, Geology, 19, 867
- Johnston (2016) Johnston K. V., 2016, in Astrophysics and Space Science Library, Vol. 420, Tidal Streams in the Local Group and Beyond, Newberg H. J., Carlin J. L., eds., p. 141
- Johnston et al. (2008) Johnston K. V., Bullock J. S., Sharma S., Font A., Robertson B. E., Leitner S. N., 2008, ApJ, 689, 936
- Johnston et al. (2012) Johnston K. V., Sheffield A. A., Majewski S. R., Sharma S., Rocha-Pinto H. J., 2012, ApJ, 760, 95
- Jurić et al. (2008) Jurić M., Ivezić Ž., Brooks A., Lupton R. H. et al., 2008, ApJ, 673, 864
- Kruijssen et al. (2018) Kruijssen J. M. D., Pfeffer J. L., Reina-Campos M., Crain R. A., Bastian N., 2018, MNRAS
- Li et al. (2016) Li T. S., Balbinot E., Mondrik N., Marshall J. L. et al., 2016, ApJ, 817, 135
- Majewski et al. (2004) Majewski S. R., Ostheimer J. C., Rocha-Pinto H. J., Patterson R. J., Guhathakurta P., Reitzel D., 2004, ApJ, 615, 738
- Morgan et al. (2016) Morgan J. V., Gulick S. P. S., Bralower T., Chenot E. et al., 2016, Science, 354, 878
- Myeong et al. (2018a) Myeong G. C., Evans N. W., Belokurov V., Sanders J. L., Koposov S. E., 2018a, MNRAS
- Myeong et al. (2018b) Myeong G. C., Evans N. W., Belokurov V., Sanders J. L., Koposov S. E., 2018b, ApJ, 856, L26
- Myeong et al. (2018c) Myeong G. C., Evans N. W., Belokurov V., Sanders J. L., Koposov S. E., 2018c, ArXiv e-prints
- Newberg et al. (2002) Newberg H. J., Yanny B., Rockosi C., Grebel E. K. et al., 2002, ApJ, 569, 245
- Nie et al. (2015) Nie J. D., Smith M. C., Belokurov V., Fan X. H. et al., 2015, ApJ, 810, 153
- Price-Whelan et al. (2015) Price-Whelan A. M., Johnston K. V., Sheffield A. A., Laporte C. F. P., Sesar B., 2015, MNRAS, 452, 676
- Rocha-Pinto et al. (2004) Rocha-Pinto H. J., Majewski S. R., Skrutskie M. F., Crane J. D., Patterson R. J., 2004, ApJ, 615, 732
- Sanderson & Helmi (2013) Sanderson R. E., Helmi A., 2013, MNRAS, 435, 378
- Sesar et al. (2007) Sesar B., Ivezić Ž., Lupton R. H., Jurić M. et al., 2007, AJ, 134, 2236
- Sesar et al. (2011) Sesar B., Jurić M., Ivezić Ž., 2011, ApJ, 731, 4
- Sharma et al. (2010) Sharma S., Johnston K. V., Majewski S. R., Muñoz R. R., Carlberg J. K., Bullock J., 2010, ApJ, 722, 750
- Simion et al. (2014) Simion I. T., Belokurov V., Irwin M., Koposov S. E., 2014, MNRAS, 440, 161
- Simion et al. (2018) Simion I. T., Belokurov V., Koposov S. E., Sheffield A., Johnston K. V., 2018, MNRAS, 476, 3913
- The Astropy Collaboration et al. (2018) The Astropy Collaboration, Price-Whelan A. M., Sipőcz B. M., Günther H. M. et al., 2018, ArXiv e-prints
- Vanderplas et al. (2012) Vanderplas J., Connolly A., Ivezić Ž., Gray A., 2012, in Conference on Intelligent Data Understanding (CIDU), pp. 47 –54
- Vivas & Zinn (2006) Vivas A. K., Zinn R., 2006, AJ, 132, 714
- Vivas et al. (2001) Vivas A. K., Zinn R., Andrews P., Bailyn C. et al., 2001, ApJ, 554, L33
- Vivas et al. (2016) Vivas A. K., Zinn R., Farmer J., Duffau S., Ping Y., 2016, ApJ, 831, 165
- Watkins et al. (2009) Watkins L. L., Evans N. W., Belokurov V., Smith M. C. et al., 2009, MNRAS, 398, 1757