Systematic Studies of the Micro-Bunching Instability at Very Low Bunch Charges
Abstract
At KARA, the KArlsruhe Research Accelerator of the KIT synchrotron, the so called short bunch operation mode allows the reduction of the bunch length down to a few picoseconds. The micro-bunching instability resulting from the high degree of longitudinal compression leads to fluctuations in the emitted THz radiation, referred to as bursting. For extremely compressed bunches at KARA, bursting occurs not only in one but in two different bunch-current ranges that are separated by a stable region. This work presents measurements of the bursting behavior in both regimes. Good agreement is found between data and numerical solutions of the Vlasov-Fokker-Planck equation.
pacs:
no PACS numbers yetI Introduction
The KArlsruhe Research Accelerator (KARA) is the storage ring of the accelerator test facility and synchrotron light source of the Karlsruhe Institute of Technology (KIT) in Germany. A special short-bunch operation mode at 1.3 GeV allows the reduction of the momentum compaction factor and therefore reduces the electron bunch length down to a few picoseconds. The bunch-by-bunch feedback system Hertle et al. (2014) enables custom filling patterns from a single bunch to complex multi bunch patterns.
Coherent synchrotron radiation (CSR) is emitted for wavelengths in the order of or longer than the emitting structure. In the short-bunch operation mode the effect of CSR plays an important role in the beam dynamics. The compressed bunch length of a few picoseconds leads to the emission of CSR in the low THz frequency range, that is related to a modulation of the longitudinal phase space due to the CSR impedance. This modulation leads to substructures in the longitudinal particle distribution and is referred to as micro-bunching Stupakov and Heifets (2002). The time varying substructures lead to strong fluctuations of the emitted power in the THz range, the so-called bursting. The minimum bunch-current at which this phenomenon occurs is called the bursting threshold. It depends strongly on the natural bunch length and therefore on various machine parameters Bane et al. (2010).
At KARA at KIT Müller et al. (2013); Brosi et al. (2016a) as well as at MLS Ries et al. (2012), for very short bunches, bursting was additionally observed in a region below the main bursting threshold. Indications also can be seen in measurements at Diamond (see Shields et al. (2012) Fig. 6) though it was not discussed further. This instability is referred to as short bunch-length bursting (SBB) in the following.
II Theoretical description
The interaction of the electrons inside an electron bunch with their CSR radiation field, which causes the micro-bunching instability, can be described by the Vlasov-Fokker-Planck (VFP) equation Stupakov and Heifets (2002). The solution depends on how the effects of the conductive beam pipe are taken into account as boundary conditions for the emitted electromagnetic field. In this contribution, the model, to which the measurements will be compared to, treats the beam pipe as a pair of perfectly conducting parallel plates with a distance of . The resulting solution for the main threshold of the instability was published in 2010 by Bane, Stupakov and Cai Bane et al. (2010). Using the dimensionless quantities and to parametrize CSR strength and shielding, the main threshold can be described by the simple linear scaling law Bane et al. (2010)
| (1) | ||||
| (2) | ||||
| (3) |
Here is the natural bunch length, the bending radius, half of the spacing between the parallel plates and the normalized bunch current:
with the number of electrons, the bunch current, the classical electron radius, the nominal synchrotron tune, the natural energy spread, the momentum compaction factor, the Lorentz factor and the Alfvén current111Alfvén current . The natural bunch length is given by Wiedemann (2013)
with the synchrotron frequency , the beam energy , the RF frequency , the revolution frequency , the RF peak voltage and the radiated energy per particle and revolution .
Equation (1) was obtained from the results of a VFP-solver, based on an algorithm devised by Warnock and Ellison Warnock and Ellison (2000). It is the result of a linear fit to the simulated thresholds. This linear scaling law fits best for high values of (), however at lower values the simulated thresholds are significantly higher than the fit. Interestingly, the measured thresholds are described more accurately by the fit (see Brosi et al. (2016b)) than the thresholds obtained by the VFP simulations for these low values of . This is the case for the VFP simulations in Bane et al. (2010) as well as for the ones presented in the following and can be attributed to the simplicity of the parallel plates model.
The fit, leading to Eq. (1), ignores a dip around , where the calculated thresholds deviate from the simple linear scaling law Bane et al. (2010). A closer look Bane et al. (2010) at the calculated energy spread at this dip reveals a second unstable region in the bunch current, with a threshold below the one expected from the linear scaling law. For the values of accessible at KARA, it is separated by a stable region from the main instability starting at the threshold described by Eq. (1). This new region corresponds to the short bunch-length bursting studied in the following. The upper and lower limits of this additional region of instability are predicted to depend not only on the bunch length and thus the shielding parameter, but also on , which relates the synchrotron frequency and the longitudinal damping time Bane et al. (2010); Kuske (2013). It is therefore termed a weak instability.
III Measurements
III.1 Measurement Principle
The measurements presented in this paper were obtained with a broad-band quasi-optical Schottky barrier diode from ACST Advanced Compound Semiconductor Technologies GmbH() (ACST) sensitive in the spectral range from several 10 GHz up to 2 THz with the peak sensitivity around 80 GHz, which is operated at room temperature. The THz radiation was detected at the Infrared2 Beamline, which provides synchrotron radiation from the entry edge of a dipole magnet Mathis et al. (2003).
To detect the fluctuations in the emitted THz radiation for each bunch in a multi bunch filling pattern individually, the fast detector was combined with the ultra-fast DAQ system KAPTURE (KArlsruhe Pulse Taking and Ultrafast Readout Electronics) Caselle et al. (2014a). The KAPTURE system samples the detector response to the THz pulse of each bunch at four points Caselle et al. (2014b). In principle KAPTURE can sample the signal continuously with the rate of the RF frequency of KARA ( 500 MHz). For this publication, the signal was recorded for every bunch at every 10th revolution during a period of one second, to limit the acquired data volume.
Figure 1 shows the characteristic patterns of the fluctuation frequencies of the emitted THz radiation for different bunch currents. During the decay of the bunch current, the instability passes different regimes and ends at the main bursting threshold (in Fig. 1 at 0.2 mA).
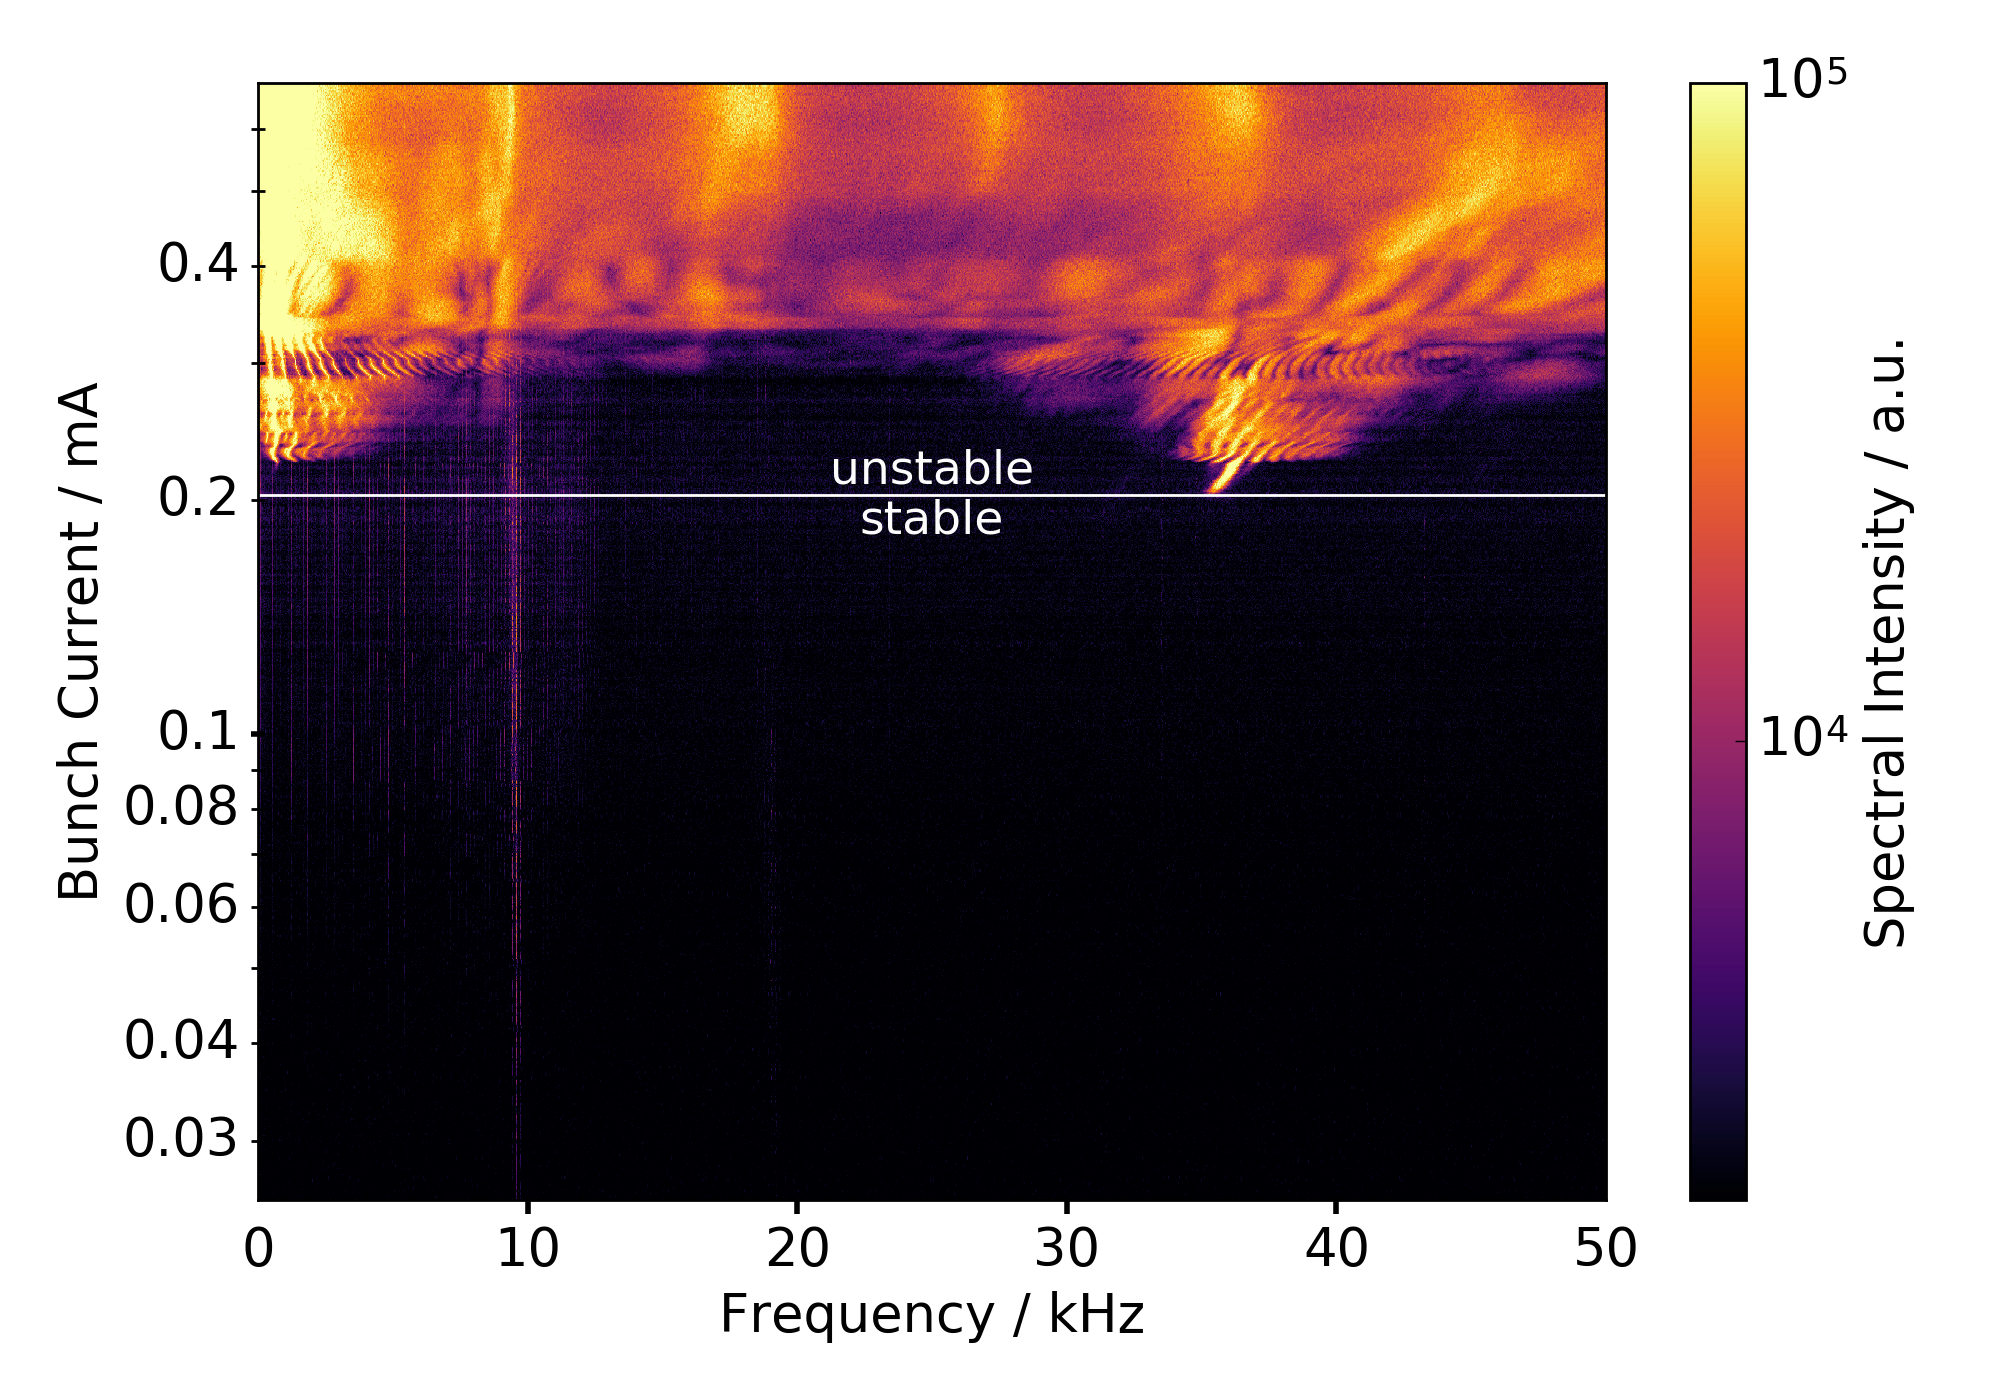
The combination of a custom filling pattern and a data acquisition system which facilitates the measurement of the THz signal of each bunch individually allows a reduction of the measurement time down to one second Brosi et al. (2016b). This so called snapshot measurement technique was used for measuring the bunch current dependence of the behavior as well as the threshold of the instability.
III.2 Short Bunch-Length Bursting
For most machine settings the beam is stable for all currents below the bursting threshold (see Fig. 1). Nevertheless, observations show, that at KARA a momentum compaction factor combined with high RF voltages () leading to a natural bunch length , an instability occurs again for bunch currents below the main bursting threshold, see Fig. 2. This spectrogram was obtained by a snapshot measurement within one second. To compensate for the limited current resolution of this measurement method, the filling pattern was chosen in such a way that the region of interest with small bunch currents is sampled with a sufficient resolution. This is visible in the limited bunch current resolution in the upper part of Fig. 2. The spectrogram shows the lower bound of the main bursting and the complete occurrence of the short bunch-length bursting. This second region of instability occurred at bunch currents between 0.038 mA and 0.016 mA for the measured machine settings.
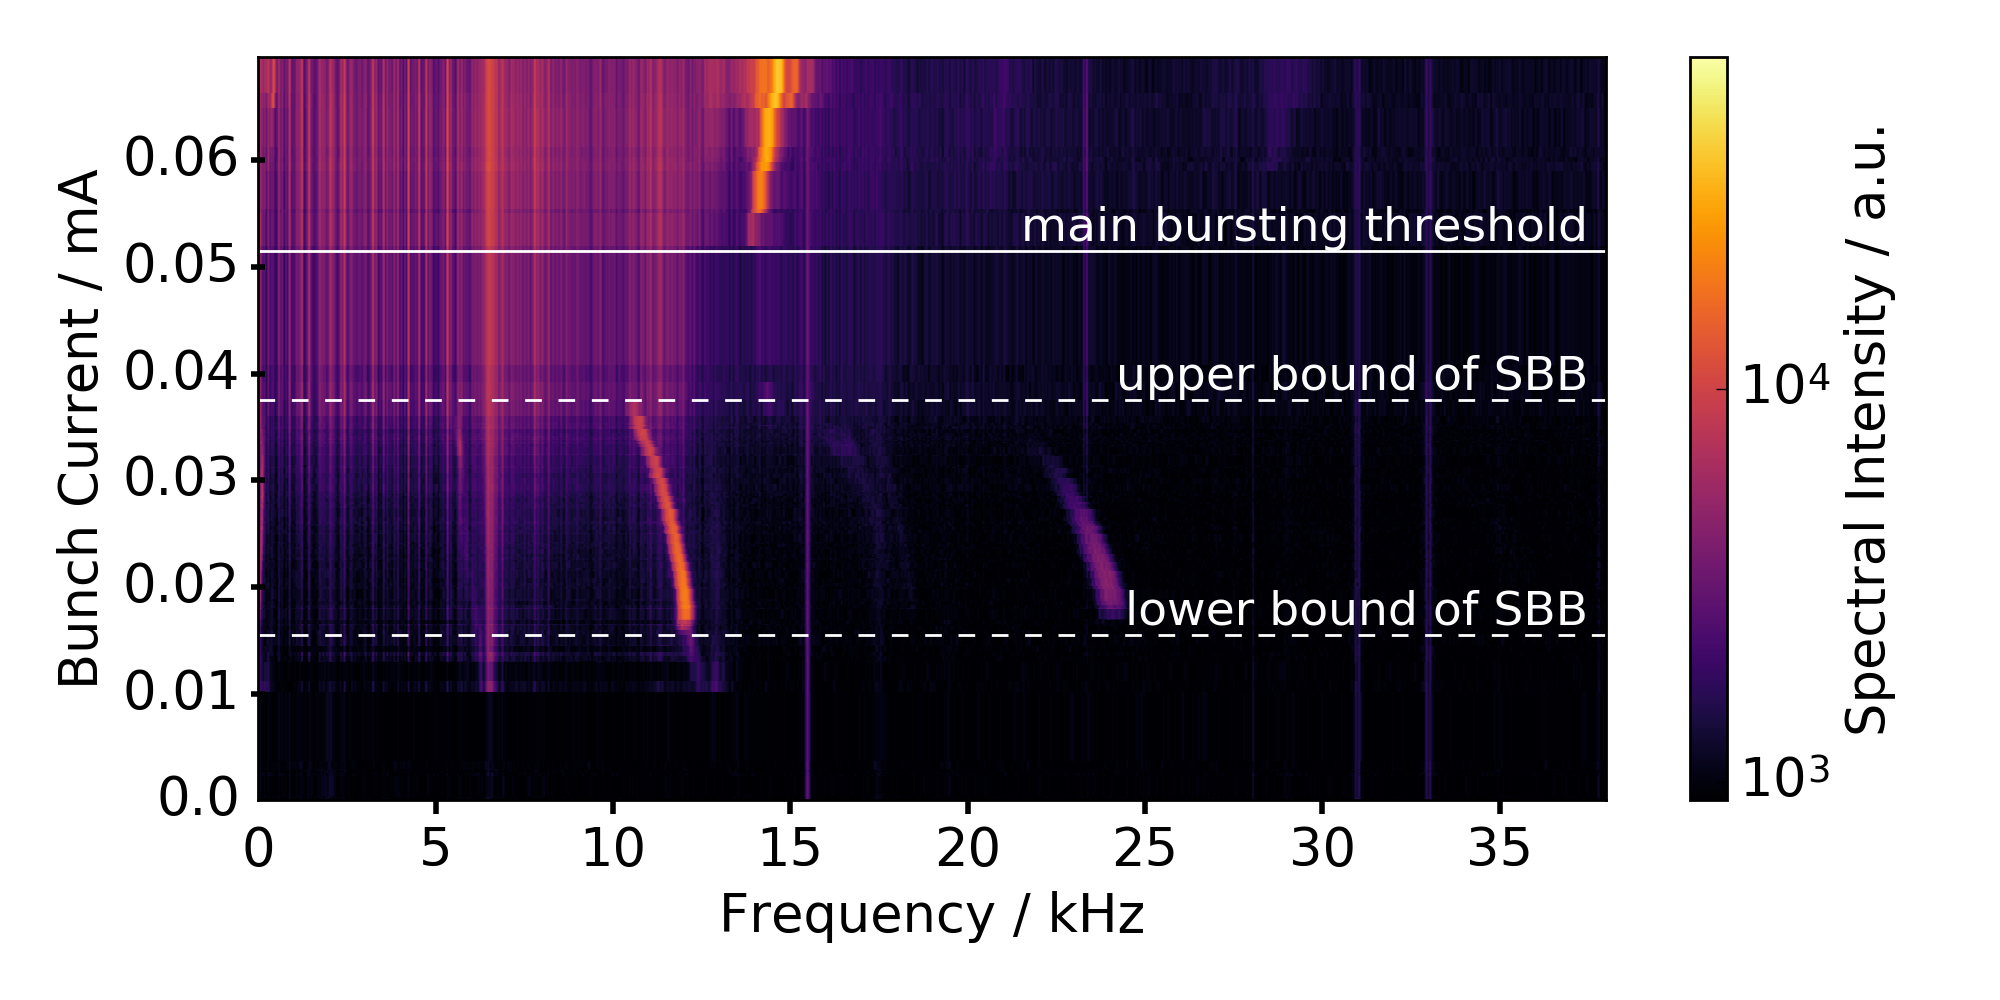
The frequencies of the intensity fluctuations are located below twice the synchrotron frequency ( in Fig. 2) and approach this frequency with decreasing bunch current. A second frequency line at the first harmonic of the intensity fluctuation is visible (below ).
III.3 Results
Snapshot measurements of the lower current range, similar to Fig. 2, were taken for different values of the momentum compaction factor and the natural bunch length by changing the magnet optics as well as the RF voltage. The scanned parameter range reached for from down to and for from up to .
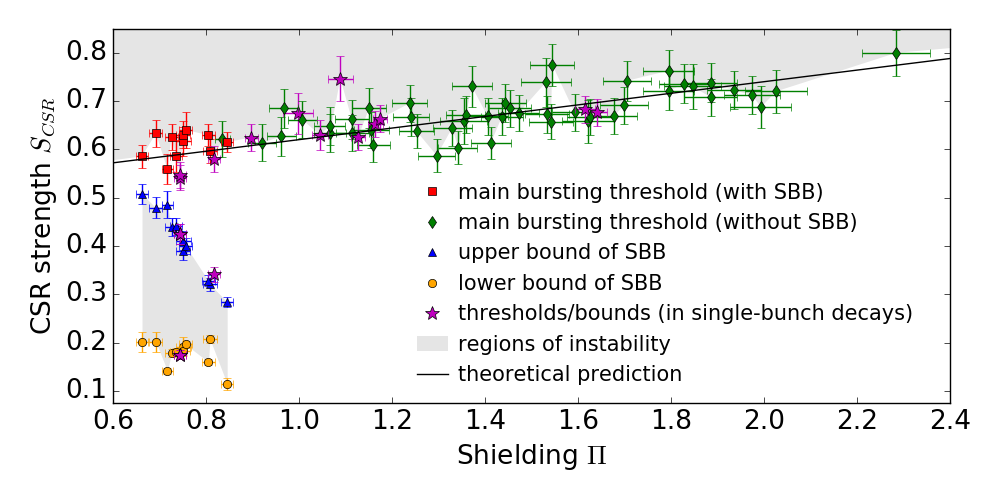
The bunch currents at the lower and upper bound of the short bunch-length bursting as well as the main bursting threshold for each measurement are displayed in Fig. 3 using the dimensionless parameters and (Eqs. (2) and (3)) following the notation of Bane et al. (2010).
Bursting thresholds measured at machine settings, where no short bunch-length bursting occurs (more details see Brosi et al. (2016b)), show that the main bursting threshold is described by Eq. (1) and is independent of the occurrence of short bunch-length bursting.
The highest value of the shielding parameter where the short bunch-length bursting occurs at KARA (right-most red square in Fig. 3) is . The smallest value of the shielding parameter where the short bunch-length bursting does not occur (left-most green diamond in Fig. 3) is at , and therefore smaller than . This small difference is expected and caused by the fact, that the two values ( and ) were obtained for different combinations of momentum compaction factor and RF voltage with similar values of , however, different values for ( and ). As described in Kuske (2017) the range of where the weak instability occurs is the bigger the smaller is.
The overall limit agrees within uncertainties with the results obtained by Bane, Stupakov and Cai using their VFP-solver Bane et al. (2010). There, the authors observed a dip around , while the threshold for is again on the theoretical calculated linear scaling law given by Eq. (1). Values below were not accessible for our measurements, which precludes the possibility to check if the short bunch-length bursting vanishes for even smaller values of the shielding parameter, as predicted by calculations in Bane et al. (2010).
IV Simulations
The upper and lower limits in bunch current of the short bunch-length bursting are expected to depend not only on the natural bunch length but also on which relates the longitudinal damping time and the synchrotron frequency . For the measurements presented here, the synchrotron frequency changes due to the different values of the RF-voltage and the momentum compaction factor, while the damping time stays constant. This means that is different for the different measurement points ranging in the presented measurements from to . As the simulations in Bane et al. (2010) were carried out only for the fixed value , new simulations were done for each measurement point using exactly the parameters of the respective measurement. The VFP-solver used for these additional simulations is presented in Kuske (2012) and a comparison between the simulation results and measurement done at MLS and BESSY is given in Kuske (2013).
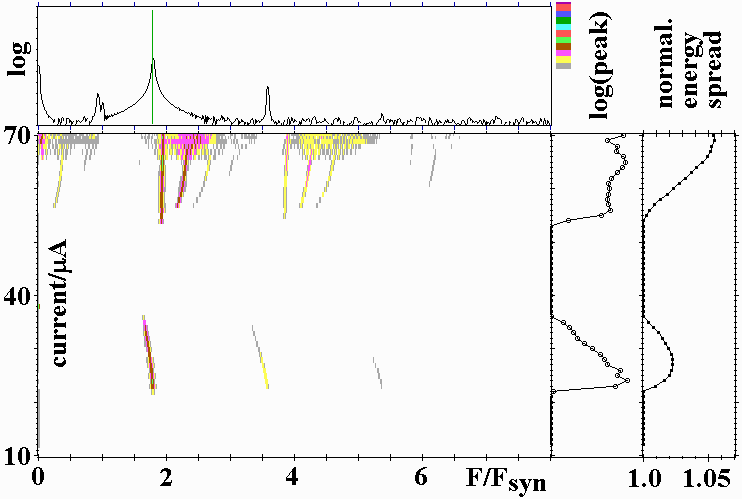
Figure 4 shows a spectrogram calculated from the simulated phase space. Similar to the measurements, a second region of instability corresponding to the short bunch-length bursting is visible between 20 A and 41 A, well below the main bursting threshold at 54 A. The dominant frequencies in this instability region are close to two and four times the synchrotron frequency, showing the same structure as the corresponding measurement (Fig. 2). The simulation also reveals that in the stable area between the short bunch-length bursting and the main bursting threshold, the energy spread equals the natural energy spread and is not increased as it is during the instability (see Fig. 4), confirming the first simulations done in Bane et al. (2010).
The simulations yield thresholds which are higher by about in comparison to the linear scaling law Bane et al. (2010) as discussed above (see Sec. II). The overall behavior is in good agreement with the measurements. The CSR strength at the thresholds obtained from the VFP solver are shown in Fig. 5 (red triangles) as a function of the shielding parameter.
V Comparison
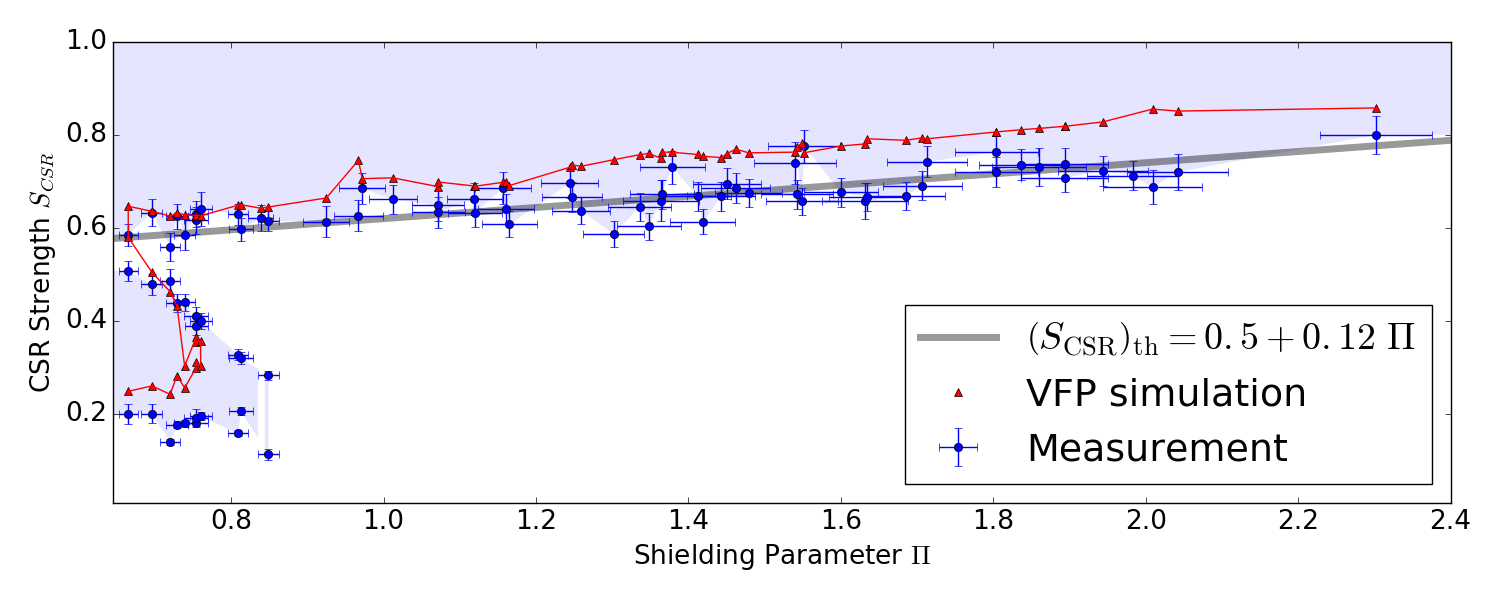
Figure 5 shows again clearly that in the measurement as well as in the new VFP calculations, a range of exists, where unstable THz emission also occurs below the threshold given by the simple linear scaling law (Eq. 3), as already shown by Bane et al. (2010). Our measurements as well as simulations show a stable area between the two regions of instability.
The range in as well as in where the short bunch-length bursting occurs depends on . For the parameters in our measurements, the simulations give an upper limit for the occurrence of short bunch-length bursting of . While the measurements show short bunch-length bursting up to , resulting in a small range of where short bunch-length bursting is observed by measurements and not in the simulations. Also the lower bound of the short bunch-length bursting in the CSR strength differs slightly between the calculations and the measurements. The measurements show instability at an even lower CSR strength (corresponding to a lower bunch current) than the calculations. This could be related to the fact that in general the threshold values obtained by the simulation are systematically slightly higher than the ones measured. The average difference is 7 A for the main threshold current ranging from 40 A to 400 A.
Lower values for the thresholds in the measurements can not be explained by too insensitive THz detectors as this would result in an overestimation of the measured thresholds. Also systematic influences on the measured thresholds due to multi bunch effects in the used snapshot measurements can be excluded, as thresholds measured in pure single-bunch decays agree with the ones from snapshot measurements (see Fig. 3).
A small discrepancy consistent with the one observed could be caused due to our measurement method. For small fluctuations of the machine settings the measurements would give the absolute floor of the corresponding thresholds. While the simulation gives a value corresponding more to the average threshold for the machine settings, leading to a small discrepancy. Such fluctuations in the machine could occur in the RF-voltage and the current in the magnets, and thus the magnet optics and the momentum compaction factor.
Another potential source for deviations could come from assumptions used in the simulation. For example, the longitudinal damping time, an essential component in the solution of the VFP-equation, was obtained by beam dynamics calculations which did not include CSR. Furthermore, as described above, the VFP calculations only consider the simple “parallel plates” model. The small discrepancy between the measured thresholds and the calculated ones could indicate additional impedance contributions. For example, considering an additional geometric impedance for an aperture like a scraper, leads to a slightly lower simulated threshold Schönfeldt (2018). Also the impedance of edge radiation is mainly resistive and would lead, if considered in the simulation, to a lower threshold. Last but not least, a stronger CSR-interaction than expected from the simple circular orbit simulated could be caused by an interaction extending into the straights behind the dipoles.
VI Summary
The short bunch-length bursting observed at KARA for certain machine settings, corresponds to the behavior observed in the results of the Vlasov-Fokker-Planck solver calculations first published by Bane, Stupakov and Cai Bane et al. (2010). This second region of instability below the bursting threshold of the main micro-bunching instability occurred in the measurements for values of the shielding parameter smaller than . As the occurrence of short bunch-length bursting depends not only on the natural bunch length but also on the ratio of the synchrotron frequency and the longitudinal damping time, new VFP solver calculations were performed at the exact conditions of the measurements. This simulation result shows slightly higher values for the thresholds with an average difference of 7 A but the overall behavior is in good agreement with the measurements. The small deviations might be caused by the floor in the determination of the thresholds from the measurements, which would lead to an underestimation in the presence of small parameter fluctuations of the machine settings. Another possible explanation is an additional impedance contribution or a stronger CSR interaction that is not covered by the simple model simulated. The latter could be caused by the interaction of the bunches with their CSR extending into the straights behind the dipoles.
Acknowledgements.
We thank Karl Bane for his questions concerning the presence of this second region of instability at KARA. We would like to thank the infrared group at KARA and in particular M. Süpfle for their support during the beam times at the Infrared2 beam line. Further, we would like to thank the THz group for inspiring discussions. This work has been supported by the German Federal Ministry of Education and Research (Grant No. 05K13VKA), the Helmholtz Association (Contract No. VH-NG-320) and by the Helmholtz International Research School for Teratronics (HIRST). E. Blomley and J. Gethmann acknowledge the support by the DFG-funded Doctoral School “Karlsruhe School of Elementary and Astroparticle Physics: Science and Technology”. M. Brosi, J. Steinmann, and P. Schönfeldt acknowledge the support of the Helmholtz International Research School for Teratronics (HIRST).*
References
- Hertle et al. (2014) E. Hertle, E. Huttel, A.-S. Müller, N. Smale, D. Teytelman, and M. Höner, in Proceedings of 2014 International Particle Accelerator Conference (2014) p. 1739.
- Stupakov and Heifets (2002) G. Stupakov and S. Heifets, Phys. Rev. ST Accel. Beams 5, 054402 (2002).
- Bane et al. (2010) K. L. F. Bane, Y. Cai, and G. Stupakov, Phys. Rev. ST Accel. Beams 13, 104402 (2010).
- Müller et al. (2013) A.-S. Müller, B. Balzer, C. Caselle, N. Hiller, M. Hofherr, K. Ilin, V. Judin, B. Kehrer, S. Marsching, S. Naknaimueang, M. Nasse, J. Raasch, A. Scheuring, M. Schuh, M. Schwarz, M. Siegel, N. Smale, J. Steinmann, P. Thoma, M. Weber, and S. Wuensch, in Proceedings of IPAC (2013) p. 109.
- Brosi et al. (2016a) M. Brosi, E. Blomley, E. Bründermann, N. Hiller, B. Kehrer, A.-S. Müller, M. Schedler, M. Schuh, P. Schönfeldt, and J. L. Steinmann, in Proc. of International Particle Accelerator Conference (IPAC’16), Busan, Korea, May 8-13, 2016, International Particle Accelerator Conference No. 7 (JACoW, Geneva, Switzerland, 2016) pp. 1662–1665, doi:10.18429/JACoW-IPAC2016-TUPOR006.
- Ries et al. (2012) M. Ries, J. Feikes, P. Schmid, G. Wüstefeld, and A. Hoehl, in Proceedings of 2012 International Particle Accelerator Conference (2012) p. 3030.
- Shields et al. (2012) W. Shields, R. Bartolini, G. Boorman, P. Karataev, A. Lyapin, J. Puntree, and G. Rehm, Journal of Physics: Conference Series 357, 012037 (2012).
- Wiedemann (2013) H. Wiedemann, “Handbook of accelerator physics and engineering,” (WORLD SCIENTIFIC, 2013) Chap. 3.1.4 Synchrotron Radiation in Storage Rings, pp. 220–223, 2nd ed.
- Warnock and Ellison (2000) R. L. Warnock and J. A. Ellison, in The physics of high brightness beams. Proceedings, 2nd ICFA Advanced Accelerator Workshop, Los Angeles, USA, November 9-12, 1999 (2000) pp. 322–348.
- Brosi et al. (2016b) M. Brosi, J. L. Steinmann, E. Blomley, E. Bründermann, M. Caselle, N. Hiller, B. Kehrer, Y.-L. Mathis, M. J. Nasse, L. Rota, M. Schedler, P. Schönfeldt, M. Schuh, M. Schwarz, M. Weber, and A.-S. Müller, Phys. Rev. Accel. Beams 19, 110701 (2016b).
- Kuske (2013) P. Kuske, in Proceedings, 4th International Particle Accelerator Conference (IPAC 2014): Shanghai, China (2013) p. WEOAB102.
- Advanced Compound Semiconductor Technologies GmbH() (ACST) Advanced Compound Semiconductor Technologies (ACST) GmbH, “UWB Quasi-optical Detectors up to 2THz,” Flyer.
- Mathis et al. (2003) Y.-L. Mathis, B. Gasharova, and D. Moss, “Terahertz radiation at anka, the new synchrotron light source in karlsruhe,” (2003).
- Caselle et al. (2014a) M. Caselle, M. Brosi, S. Chilingaryan, T. Dritschler, E. Hertle, V. Judin, A. Kopmann, A.-S. Müller, J. Raasch, M. Schleicher, M. Siegel, N. Smale, J. Steinmann, M. Vogelgesang, M. Weber, and S. Wuensch, in Proceedings of 2014 International Particle Accelerator Conference (2014) p. 3497.
- Caselle et al. (2014b) M. Caselle, M. Brosi, S. Chilingaryan, T. Dritschler, N. Hiller, V. Judin, A. Kopmann, A.-S. Müller, L. Petzold, J. Raasch, L. Rota, M. Siegel, N. Smale, J. Steinmann, M. Vogelgesang, M. Weber, and S. Wuensch, in IBIC’14 Monterey, CA, USA (2014).
- Kuske (2017) P. Kuske, in Proc. of International Particle Accelerator Conference (IPAC’17), Copenhagen, Denmark, 14-19 May, 2017, International Particle Accelerator Conference No. 8 (JACoW, Geneva, Switzerland, 2017) pp. 3696–3699, https://doi.org/10.18429/JACoW-IPAC2017-THPAB007.
- Kuske (2012) P. Kuske, in Proceedings of ICAP2012, Rostock-Warnemünde, Germany. , 2012 (2012) p. THSDC3.
- Schönfeldt (2018) P. Schönfeldt, Simulation and measurement of the dynamics of ultra-short electron bunch profiles for the generation of coherent THz radiation, Ph.D. thesis, in preparation, Karlsruhe Institute of Technology (2018).