A Computational Study of the Role of Tonal Tension in Expressive Piano Performance
Abstract
Expressive variations of tempo and dynamics are an important aspect of music performances, involving a variety of underlying factors. Previous work has showed a relation between such expressive variations (in particular expressive tempo) and perceptual characteristics derived from the musical score, such as musical expectations, and perceived tension. In this work we use a computational approach to study the role of three measures of tonal tension proposed by \citeAHerremans:2016vra in the prediction of expressive performances of classical piano music. These features capture tonal relationships of the music represented in Chew’s spiral array model, a three dimensional representation of pitch classes, chords and keys constructed in such a way that spatial proximity represents close tonal relationships. We use non-linear sequential models (recurrent neural networks) to assess the contribution of these features to the prediction of expressive dynamics and expressive tempo using a dataset of Mozart piano sonatas performed by a professional concert pianist. Experiments of models trained with and without tonal tension features show that tonal tension helps predict change of tempo and dynamics more than absolute tempo and dynamics values. Furthermore, the improvement is stronger for dynamics than for tempo.
Introduction
Expressive performance of music constitutes an important part of our enjoyment of several kinds of music, including Western art music and jazz. In these kinds of music, an expressive performance is not expected to be an exact mechanical rendition of what is written in the score, but a combination of the performer’s interpretation of both the intentions of the composer and its own expressive intentions that are conveyed to the listener through variations in dimensions such as tempo, dynamics and timbre. Previous work has showed a relation between such expressive variations and perceptual characteristics derived from the musical score, such as musical expectations, and perceived tension Chew (\APACyear2016); Farbood (\APACyear2012); Gingras \BOthers. (\APACyear2016).
The concept of musical tension is highly complex and multidimensional, and thus, difficult to formalize or quantify Farbood (\APACyear2012); Herremans \BBA Chew (\APACyear2016). Informally, “increasing tension can be described as a feeling of rising intensity or impending climax, while decreasing tension can be described as a feeling of relaxation or resolution” (Farbood, \APACyear2012, pp. 387). The music cognition literature has shown that aspects related to musical tension include both psychological factors such as expectation and emotion; and musical factors such as rhythm, timing and dynamics and tonality. For a more thorough description of aspects that contribute to musical tension, we refer the reader to Farbood (\APACyear2012) and references therein.
In this work we use a computational approach to study the role of tonal tension features –as proposed by Herremans \BBA Chew (\APACyear2016)– in the prediction of expressive performances of Classical piano music. Computational models of musical expression can be used to explain the way certain properties of a musical score relate to an expressive rendering of the music Widmer \BBA Goebl (\APACyear2004). The KTH model Friberg \BOthers. (\APACyear2006), one of the most important rule-based models of expressive performance includes rules that take into account tonal tension.
The rest of this paper is structured as follows: the Method section is divided into three subsections, the first of which describes the tonal tension and score features, followed by a brief description of the way expressive tempo and dynamics are quantified in this work; and finally, the recurrent neural network model relating the features to the expressive tempo and dynamics is presented. The Experiments section describes the evaluation of the methods using cross-validation experiments. Afterwards we discuss the results of these experiments and, finally, we present conclusions and future research directions.
Method
This section details the computational methodology we use in this study. It describes the features used to represent musical contexts – the inputs of the model, the expressive parameters used to represent tempo and dynamics – the outputs of the model, and the model itself.
Features
Tonal Tension Features (T)
In order to characterize tonal tension, we use a set of three quantities, which are computed using the method proposed by \citeAHerremans:2016vra. These features capture tonal relationships of the music represented in Chew’s \APACyear2000 spiral array model, a three dimensional representation of pitch classes, chords and keys constructed in such a way that spatial proximity represents close tonal relationships. The tonal tension features are:
-
1.
cloud diameter (), which estimates the maximal tonal distance between notes in a segment of music;
-
2.
cloud momentum () quantifies harmonic movement as the tonal distance from a section to the next; and
-
3.
tensile strain (), the relative tonal distance between the current segment and the center of effect of the key of the piece, i.e. the point in the spiral array mode that best represents the key of the piece.
Since distances in the spiral array are can be large (in this particular work, an order of magnitude larger than the score features defined below), we scale the tension features described above by dividing them by the distance between enharmonically equivalent notes (e.g. C and D). \citeAHerremans:2016vra evaluated these features by comparing them to the empirical study by \citeAFarbood:2012by, showing that these features correlate to human perception of tonal tension.
Score Features
Following \citeACancinoChacon:2017uh, we include two groups of low-level descriptors of a musical score that have been shown to predict characteristics of expressive performance. These features provide a baseline showing to what degree expressive variations can be explained only by the nominal information in the score.
-
1.
Pitch (P)
-
(a)
. Three features representing the chromatic pitch (as MIDI note numbers divided by ) of the highest note, the lowest note, and the melody note (if given, and zero otherwise) at each score position.
-
(b)
. Three features describing up to three vertical interval classes above the bass, i.e. the intervals between the notes of a chord and the lowest pitch, excluding pitch class repetition and octaves. For example, a major triad (, , ), starting at would be represented as , where denotes the absence of a third interval above , i.e. the absence of a fourth note in the chord.
-
(a)
-
2.
Metrical (M)
-
(a)
. The relative location of an onset within the bar, computed as , where is the temporal position of the onset measured in beats from the beginning of the score, and is the length of the bar in beats.
-
(b)
. Three binary features (taking values in ) encoding the metrical strength of the -th onset. is nonzero at the downbeat (i.e. whenever ); is nonzero at the secondary strong beat in duple meters (e.g. quarter-note 3 in , and eighth-note 4 in ), and is nonzero at weak metrical positions (i.e. whenever and are both zero).
-
(a)
Expressive Parameters
We consider an expressive parameter to be a numerical descriptor that corresponds to common concepts involved in expressive performance. In this section we briefly describe the parameters used to represent expressive tempo and dynamics.
-
1.
Tempo.
-
(a)
. We take the local beat period ratio as a proxy for musical tempo. In order to compute this parameter, we average the performed onset times of all notes occurring at the same score position and then compute the by taking the slope of the averaged onset times (in seconds) with respect to the score onsets (in beats) and dividing the resulting series by its average beat period.
-
(b)
. This parameter is computed as the first derivative of with respect to the score position, and corresponds to the relative acceleration, i.e. the relative changes in musical tempo.
-
(a)
-
2.
Dynamics.
-
(a)
. We treat the performed MIDI velocity as a proxy for the loudness of the note. This parameter computed by taking the maximal performed MIDI velocity per score position, divided by . We use the terms loudness and dynamics interchangeably to refer to this parameter.
-
(b)
. This parameter is computed as the first derivative of with respect to the score position, and corresponds to the relative changes in loudness from one time step to the next.
-
(a)
Model
We use recurrent neural networks (RNNs), a family of non-linear sequential models, to assess the contribution of the features described above to the prediction of expressive dynamics and tempo. RNNs are a state-of-the-art family of neural architectures for modeling sequential data Goodfellow \BOthers. (\APACyear2016). These models have been used to model expressive dynamics and tempo Cancino-Chacón, Gadermaier\BCBL \BOthers. (\APACyear2017); Grachten \BBA Cancino-Chacón (\APACyear2017). In this work, we use a simple architecture, which we will refer to as bRNN, consisting of a composite bidirectional long short-term memory layer (LSTM) with multiplicative integration Wu \BOthers. (\APACyear2016) with 10 units (5 units processing information forwards and 5 processing information backwards) and a linear dense layer with a single unit as output.
Experiments
In order to evaluate the contribution of the features described above to the prediction of expressive tempo and dynamics, we perform a cross-validation experiment to test the predictive quality of the model. For this study, we use the Batik/Mozart dataset Widmer \BBA Tobudic (\APACyear2002), which consists of recordings of 13 piano sonatas by W. A. Mozart performed by Austrian concert pianist Roland Batik which have been aligned to their scores. An important characteristic of this dataset is that the melody voices are manually identified. These performances were recorded on a Bösendorfer SE 290, a computer controlled grand piano.
For each expressive parameter, we perform eight 5-fold cross-validation experiments corresponding to models trained on all combinations of feature sets, i.e. all combinations of pitch features (P), metrical features (M) and tension features (T); as well as a feature set consisting of a selection of features using a univariate feature selection method (FS). Each 5-fold cross-validation experiment is conducted as follows: each model is trained/tested on 5 different partitions (folds) of the dataset, which is organized into training and test sets, such that each piece in the corpus occurs exactly one in the test set. For each fold, we use 80% of the pieces for training and 20% for testing the model. The parameters of the model are learned by minimizing the mean squared error on the training set using RMSProp, a variant of the stochastic gradient descent algorithm Tieleman \BBA Hinton (\APACyear2012).
The feature selection procedure computes the pairwise mutual information between each of the features and each of the expressive parameters. This information-theoretic measure expresses how much knowing the value of one variable reduces uncertainty about the value of the other variable Ross (\APACyear2014), and is a common way of determining the relevance of features in prediction tasks. Formally, the mutual information between two variables and is given by
where is the expectation operator, is the joint probability distribution of and , and are the marginal probability distributions of and , respectively. If and are statistically independent (i.e. they do not share information about each other), the mutual information is zero. In the FS scenario we select the 10 features with the largest mutual information for each expressive parameter. This procedure was performed on a small subset of the Batik/Mozart dataset (20% of the pieces selected randomly).
Discussion
Figure 1 shows the mutual information between each feature and the expressive parameters, normalized for each expressive parameter. In this plot, the height of a column (the value of the mutual information) signifies how closely related that feature is to the expressive parameter. The results in this plot suggest that the tension features, in particular the cloud diameter might be more related to the prediction of changes in tempo and dynamics, whereas the tensile strain might be more related to absolute tempo and dynamics than their changes. From a musical perspective, these findings seem plausible, since cloud diameter refers to melodic events, whose performance might be dependent on the character of the passage, whereas tensile strain depends on structural harmonic characteristics of the music.
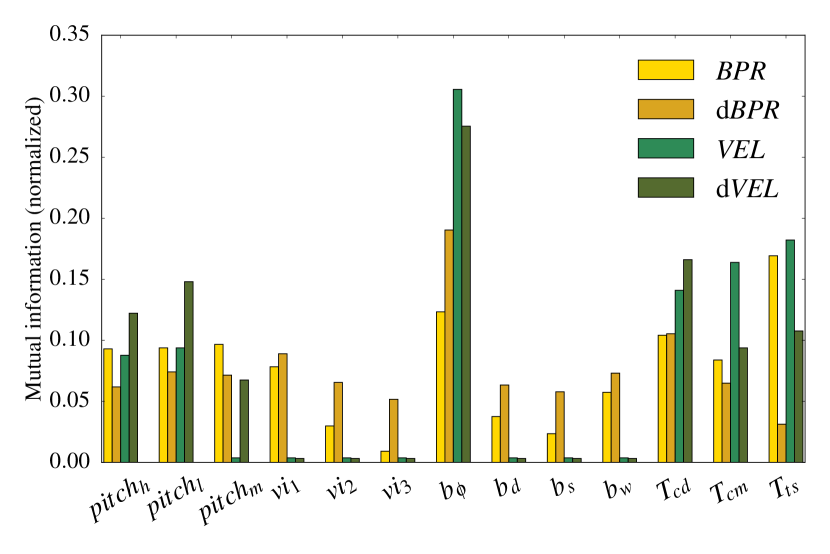
Note that the values in Figure 1 only measure the MI of the features and expressive parameters at isolated time instances, without context. Although this gives a good first impression of the relevance of features, the bRNN model presented above is specifically designed to take advantage of the temporal context to make predictions, implying that feature values at times before and after may also help to predict expressive parameters at . Therefore Figure 1 does not necessarily reflect the relevance of features when used as input to the bRNN.
Table 1 displays the results of the cross-validation experiments using the bRNN on different feature sets. We evaluate model accuracy with the coefficient of determination (). This measure expresses the proportion of variance of the expressive parameters that can be explained by the models as a function of the feature set. For each expressive parameter, we conducted a paired–samples two-tailed t-test at the level to compare the differences between the values of features sets with and without tension features (i.e. P vs. P + T, M vs. M + T, and M + P vs. M + P + T). The effect of including T was not significant for the prediction of and but it was significant for the prediction of in all cases. For including T was only beneficial in combination with P. Based on this result we hypothesize that the concept of tonal tension is relevant for changes in tempo, but the features used to represent tonal tension may not convey enough information by themselves and are therefore only advantageous in combination with more specific pitch information.
| Tempo | |||||
|---|---|---|---|---|---|
| Feature Set | + T | + T | |||
| - | 0.010 | - | 0.011 | ||
| P | 0.024 | 0.021 | 0.068 | 0.073 | (0.10) |
| M | 0.051 | 0.054 | 0.093 | 0.092 | |
| P + M | 0.056 | 0.054 | 0.105 | 0.110 | (0.06) |
| Dynamics | |||||
| Feature Set | + T | + T | |||
| - | 0.018 | - | 0.026 | ||
| P | 0.326 | 0.335 | 0.236 | 0.250 | (0.16) |
| M | 0.048 | 0.052 | 0.041 | 0.050 | (0.18) |
| P + M | 0.351 | 0.347 | 0.250 | 0.282 | (0.40) |
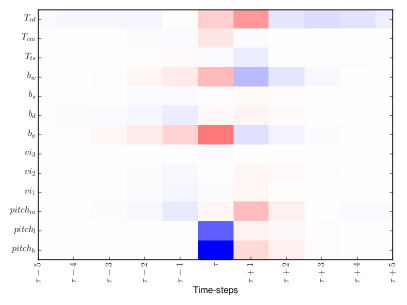
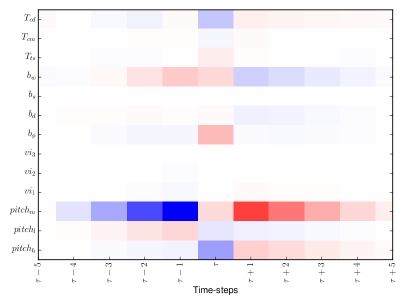
In order to visualize the contribution of each feature to the prediction of the changes in tempo and dynamics, we perform a differential sensitivity analysis111We use the definition of sensitivity analysis from the applied mathematics literature, not in the sense used in the psychology literature. of the models by computing a local linear approximation of the output of the bRNNs trained on all features (P + M + T). The resulting sensitivities are plotted in Figure 2. This figure can by roughly interpreted as follows: The color in the cell that corresponds to feature and time step represents the contribution of the value of at time to the prediction of the expressive parameter at time (the center column of the plot). Blue tones reflect feature values that negatively contribute to the predicted value (the higher the feature value the lower the predicted value), and red tones reflect feature values that positively contribute to the predicted value.
The plots follow a similar trend to the results showed in Figure 1, where the features with higher mutual information also have brighter colors in Figure 2, with the added benefit that the contribution of each feature at different time steps can be visualized.
The plots in Figure 2 suggest a tendency of the performer to emphasize melodic and harmonic events by slowing down. For example, a chromatic melody note in an otherwise tonally stable section of the piece, (like the presentation of the main theme during the exposition of a sonata) is emphasized by slowing down (see the reddish hue in for time-steps and in the left plot); while upcoming chromatic notes contribute to speeding up (the bluish hue in for time-steps ). On the other hand, chords that are tonally far from the current key are emphasized by slowing and an increase in loudness (the reddish hue for time-step in in the left plot and in in the right plot). Furthermore, upcoming sections with modulations to distant keys (like the more unstable parts of the development of a sonata) contribute to speeding up (the bluish hue in for time-steps in the left plot) These findings agree with common performance rules (c.f. the melodic charge and harmonic charge rules in the KTH model Friberg \BOthers. (\APACyear2006)).
Conclusions
In this work we have empirically investigated the role of tonal tension in shaping musical expression in classical piano performances. Our experimental results show that using tonal tension information improves predictions of change of tempo and dynamics, but not predictions of absolute tempo and dynamics. For predicting changes in tempo, using tonal tension features as defined in Herremans \BBA Chew (\APACyear2016) was only beneficial when low level pitch information was also available. This suggests that tonal tension features are potentially relevant for predicting tempo changes, but by themselves not sufficiently specific for that purpose.
Furthermore, an analysis of the trained models corroborates previously formulated relationships between performance and tension, as defined in the KTH model.
Future work may focus on a more explicit testing of the hypothesis that recurrent neural network models may learn features describing tonal characteristics from low level pitch information as a side effect of learning to predict expressive tempo and dynamics.
Acknowledgments.
Funding for this work was provided by the European Research Council (ERC) under the EU’s Horizon 2020 Framework Programme (ERC Grant Agreement number 670035, project “Con Espressione”).
References
- Cancino-Chacón, Gadermaier\BCBL \BOthers. (\APACyear2017) \APACinsertmetastarCancinoChacon:2017ht{APACrefauthors}Cancino-Chacón, C\BPBIE., Gadermaier, T., Widmer, G.\BCBL \BBA Grachten, M. \APACrefYearMonthDay2017. \BBOQ\APACrefatitleAn evaluation of linear and non-linear models of expressive dynamics in classical piano and symphonic music An evaluation of linear and non-linear models of expressive dynamics in classical piano and symphonic music.\BBCQ \APACjournalVolNumPagesMachine Learning1066887–909. \PrintBackRefs\CurrentBib
- Cancino-Chacón, Grachten\BCBL \BOthers. (\APACyear2017) \APACinsertmetastarCancinoChacon:2017uh{APACrefauthors}Cancino-Chacón, C\BPBIE., Grachten, M., Sears, D\BPBIR\BPBIW.\BCBL \BBA Widmer, G. \APACrefYearMonthDay2017\APACmonth10. \BBOQ\APACrefatitleWhat were you expecting? Using Expectancy Features to Predict Expressive Performances of Classical Piano Music What were you expecting? Using Expectancy Features to Predict Expressive Performances of Classical Piano Music.\BBCQ \BIn \APACrefbtitleProceedings of the 10th International Workshop on Machine Learning and Music (MML 2017). Proceedings of the 10th International Workshop on Machine Learning and Music (MML 2017). \APACaddressPublisherBarcelona, Spain. \PrintBackRefs\CurrentBib
- Chew (\APACyear2000) \APACinsertmetastarChew:2000wc{APACrefauthors}Chew, E. \APACrefYear2000. \APACrefbtitleTowards a Mathematical Model of Tonality Towards a Mathematical Model of Tonality \APACtypeAddressSchool\BUPhD. \APACaddressSchoolCambridge, MA, USAMassachusetts Institute of Technology. \PrintBackRefs\CurrentBib
- Chew (\APACyear2016) \APACinsertmetastarChew:2016ty{APACrefauthors}Chew, E. \APACrefYearMonthDay2016. \BBOQ\APACrefatitlePlaying with the Edge: Tipping Points and the Role of Tonality Playing with the Edge: Tipping Points and the Role of Tonality.\BBCQ \APACjournalVolNumPagesMusic Perception333344–366. \PrintBackRefs\CurrentBib
- Farbood (\APACyear2012) \APACinsertmetastarFarbood:2012by{APACrefauthors}Farbood, M\BPBIM. \APACrefYearMonthDay2012\APACmonth04. \BBOQ\APACrefatitleA Parametric, Temporal Model of Musical Tension A Parametric, Temporal Model of Musical Tension.\BBCQ \APACjournalVolNumPagesMusic Perception294387–428. \PrintBackRefs\CurrentBib
- Friberg \BOthers. (\APACyear2006) \APACinsertmetastarFriberg:2006hs{APACrefauthors}Friberg, A., Bresin, R.\BCBL \BBA Sundberg, J. \APACrefYearMonthDay2006. \BBOQ\APACrefatitleOverview of the KTH rule system for musical performance Overview of the KTH rule system for musical performance.\BBCQ \APACjournalVolNumPagesAdvances in Cognitive Psychology22-3145–161. \PrintBackRefs\CurrentBib
- Gingras \BOthers. (\APACyear2016) \APACinsertmetastarGingras:2016bm{APACrefauthors}Gingras, B., Pearce, M\BPBIT., Goodchild, M., Dean, R\BPBIT., Wiggins, G.\BCBL \BBA McAdams, S. \APACrefYearMonthDay2016. \BBOQ\APACrefatitleLinking melodic expectation to expressive performance timing and perceived musical tension. Linking melodic expectation to expressive performance timing and perceived musical tension.\BBCQ \APACjournalVolNumPagesJournal of Experimental Psychology: Human Perception and Performance424594–609. \PrintBackRefs\CurrentBib
- Goodfellow \BOthers. (\APACyear2016) \APACinsertmetastarGoodfellow-et-al-2016{APACrefauthors}Goodfellow, I., Bengio, Y.\BCBL \BBA Courville, A. \APACrefYear2016. \APACrefbtitleDeep Learning Deep Learning. \APACaddressPublisherMIT Press. \PrintBackRefs\CurrentBib
- Grachten \BBA Cancino-Chacón (\APACyear2017) \APACinsertmetastarGrachten:2017ub{APACrefauthors}Grachten, M.\BCBT \BBA Cancino-Chacón, C\BPBIE. \APACrefYearMonthDay2017. \BBOQ\APACrefatitleTemporal dependencies in the expressive timing of classical piano performances Temporal dependencies in the expressive timing of classical piano performances.\BBCQ \BIn M. Lessafre, P\BHBIJ. Maes\BCBL \BBA M. Leman (\BEDS), \APACrefbtitleThe Routledge Companion to Embodied Music Interaction The routledge companion to embodied music interaction (\BPGS 360–369). \APACaddressPublisherRoutledge. \PrintBackRefs\CurrentBib
- Herremans \BBA Chew (\APACyear2016) \APACinsertmetastarHerremans:2016vra{APACrefauthors}Herremans, D.\BCBT \BBA Chew, E. \APACrefYearMonthDay2016. \BBOQ\APACrefatitleTension ribbons: Quantifying and visualising tonal tension Tension ribbons: Quantifying and visualising tonal tension.\BBCQ \BIn \APACrefbtitleProceedings of the Second International Conference on Technologies for Music Notation and Representation (TENOR 2016). Proceedings of the Second International Conference on Technologies for Music Notation and Representation (TENOR 2016). \APACaddressPublisherCambridge, UK. \PrintBackRefs\CurrentBib
- Ross (\APACyear2014) \APACinsertmetastarRoss:2014kl{APACrefauthors}Ross, B\BPBIC. \APACrefYearMonthDay2014. \BBOQ\APACrefatitleMutual Information between Discrete and Continuous Data Sets Mutual information between discrete and continuous data sets.\BBCQ \APACjournalVolNumPagesPLOS ONE92e87357. \PrintBackRefs\CurrentBib
- Tieleman \BBA Hinton (\APACyear2012) \APACinsertmetastarTieleman:2012kl{APACrefauthors}Tieleman, T.\BCBT \BBA Hinton, G. \APACrefYearMonthDay2012. \BBOQ\APACrefatitleLecture 6.5-rmsprop: Divide the gradient by a running average of its recent magnitude Lecture 6.5-rmsprop: Divide the gradient by a running average of its recent magnitude.\BBCQ \BIn \APACrefbtitleCOURSERA: Neural Networks for Machine Learning. COURSERA: Neural Networks for Machine Learning. \PrintBackRefs\CurrentBib
- Widmer \BBA Goebl (\APACyear2004) \APACinsertmetastarWidmer:2004bh{APACrefauthors}Widmer, G.\BCBT \BBA Goebl, W. \APACrefYearMonthDay2004\APACmonth09. \BBOQ\APACrefatitleComputational Models of Expressive Music Performance: The State of the Art Computational Models of Expressive Music Performance: The State of the Art.\BBCQ \APACjournalVolNumPagesJournal of New Music Research333203–216. \PrintBackRefs\CurrentBib
- Widmer \BBA Tobudic (\APACyear2002) \APACinsertmetastarwidmer02playingmozart{APACrefauthors}Widmer, G.\BCBT \BBA Tobudic, A. \APACrefYearMonthDay2002. \BBOQ\APACrefatitlePlaying Mozart by Analogy: Learning Multi-Level Timing and Dynamics Strategies Playing Mozart by Analogy: Learning Multi-Level Timing and Dynamics Strategies.\BBCQ \APACjournalVolNumPagesJournal of New Music Research32259–268. \PrintBackRefs\CurrentBib
- Wu \BOthers. (\APACyear2016) \APACinsertmetastarWu:2016vm{APACrefauthors}Wu, Y., Zhang, S., Zhang, Y., Bengio, Y.\BCBL \BBA Salakhutdinov, R. \APACrefYearMonthDay2016. \BBOQ\APACrefatitleOn Multiplicative Integration with Recurrent Neural Networks On Multiplicative Integration with Recurrent Neural Networks.\BBCQ \BIn \APACrefbtitleProceedings of the 30th Conference on Neural Information Processing Systems (NIPS 2016). Proceedings of the 30th Conference on Neural Information Processing Systems (NIPS 2016). \APACaddressPublisherBarcelona, Spain. \PrintBackRefs\CurrentBib