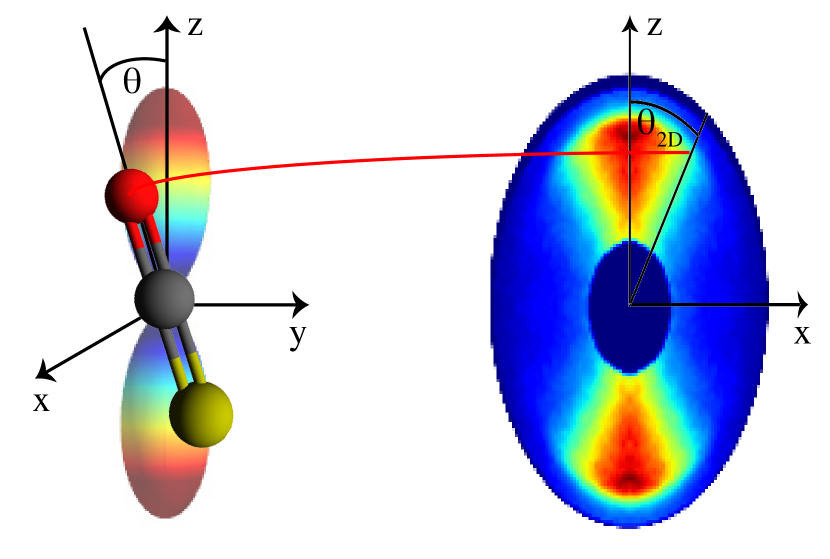
Molecular movie of ultrafast coherent rotational dynamics
Abstract
Recording molecular movies on ultrafast timescales has been a longstanding goal for unravelling detailed information about molecular dynamics. We present the direct experimental recording of very-high-resolution and -fidelity molecular movies over more than one-and-a-half periods of the laser-induced rotational dynamics of carbonylsulfide (OCS) molecules. Utilising the combination of single quantum-state selection and an optimised two-pulse sequence to create a tailored rotational wavepacket, an unprecedented degree of field-free alignment, () was achieved, exceeding the theoretical limit for single-pulse alignment. The very rich experimentally observed quantum dynamics is fully recovered by the angular probability distribution obtained from solutions of the time-dependent Schrödinger equation with parameters refined against the experiment. The populations and phases of rotational states in the retrieved time-dependent three-dimensional wavepacket rationalised the observed very high degree of alignment.
The filming of nuclear motion during molecular dynamics at relevant timescales, dubbed the “molecular movie”, has been a longstanding dream in the molecular sciences Zewail (2000); Ischenko et al. (2017). Recent experimental advances with x-ray-free-electron lasers and ultrashort-pulse electron guns have provided first glimpses of intrinsic molecular structures Ayyer et al. (2016); Küpper et al. (2014); Hensley et al. (2012) and dynamics Pande et al. (2016); Yang et al. (2016a); Ischenko et al. (2017). However, despite the spectacular progress, the fidelity of the recorded movies, in comparison to the investigated dynamics, was limited so far. Especially for high-precision studies of small molecules, typically only distances between a few atoms were determined Küpper et al. (2014); Hensley et al. (2012); Yang et al. (2016a).
Rotational quantum dynamics of isolated molecules provides an interesting and important testbed that provides and requires direct access to angular coordinates. Furthermore, different from most molecular processes, it can be practically exactly described by current numerical methods, even for complex molecules. Rotational wavepackets were produced through the interaction of the molecule with short laser pulses Felker et al. (1986); Rosca-Pruna and Vrakking (2001); Stapelfeldt and Seideman (2003), which couple different rotational states through stimulated Raman transitions. The resulting dynamics were observed, for instance, by time-delayed Coulomb-explosion ion imaging Rosca-Pruna and Vrakking (2001); Mizuse et al. (2015); Dooley et al. (2003), photoelectron imaging Marceau et al. (2017), or ultrafast electron diffraction Yang et al. (2016b). The rotational wavepackets were exploited to connect the molecular and laboratory frames through strong-field alignment Rosca-Pruna and Vrakking (2001); Stapelfeldt and Seideman (2003) and mixed-field orientation Ghafur et al. (2009); Trippel et al. (2015), as well as for the determination of molecular-structure information in rotational-coherence spectroscopy Felker (1992); Riehn (2002). Coherent rotational wavepacket manipulation using multiple pulses Lee et al. (2004) or appropriate turn-on and -off timing Trippel et al. (2014) allowed enhanced or diminished rephasing, and it was suggested as a realisation of quantum computing Lee et al. (2004). Furthermore, methods for rotational-wavepacket reconstruction of linear molecules Mouritzen and Mølmer (2006) and for benzene Hasegawa and Ohshima (2008) were reported.
Here, we demonstrate the direct experimental high-resolution imaging of the time-dependent angular probability-density distribution of a rotational wavepacket and its reconstruction in terms of the populations and phases of field-free rotor states. Utilising a state-selected molecular sample and an optimised two-laser-pulse sequence, a broad phase-locked rotational wavepacket was created. Using mid-infrared-laser strong-field ionisation and Coulomb-explosion ion imaging, an unprecedented degree of field-free alignment of , or , was obtained at the full revivals, whereas in between a rich angular dynamics was observed with very high resolution, from which the complete wavepacket could be uniquely reconstructed. While the dynamics has low dimensionality, The resulting — purely experimentally obtained — movie provides a most direct realisation of the envisioned “molecular movie”. We point out that the data also is a measurement of a complete quantum carpet Berry et al. (2001).
In order to achieve such a high degree of alignment, better than the theoretical maximum of for single-pulse alignment Leibscher et al. (2003); Guérin et al. (2008), we performed a pump-probe experiment with ground-state-selected OCS molecules Chang et al. (2015), with % purity, as a showcase. Two off-resonant near-IR pump pulses of nm central wavelength, separated by ps and with a pulse duration of fs, i. e., much shorter than the rotational period of OCS of ps, were used to create the rotational wavepacket. These pulses were linearly polarised parallel to the detector plane. The probe pulse with a central wavelength of was polarised perpendicularly to the detector plane to minimise the effects of geometric alignment and ensures that the observed degree of alignment was a lower boundary of the real value. The probe pulse multiply ionised the molecules, resulting in Coulomb explosion into ionic fragments. 2D ion-momentum distributions of O+ fragments, which reflect the orientation of the molecules in space at the instance of ionisation, were recorded by a velocity map imaging (VMI) spectrometer Eppink and Parker (1997) for different time delays between the alignment pulse sequence and the probe pulse. Further details of the experimental setup are presented in Methods.
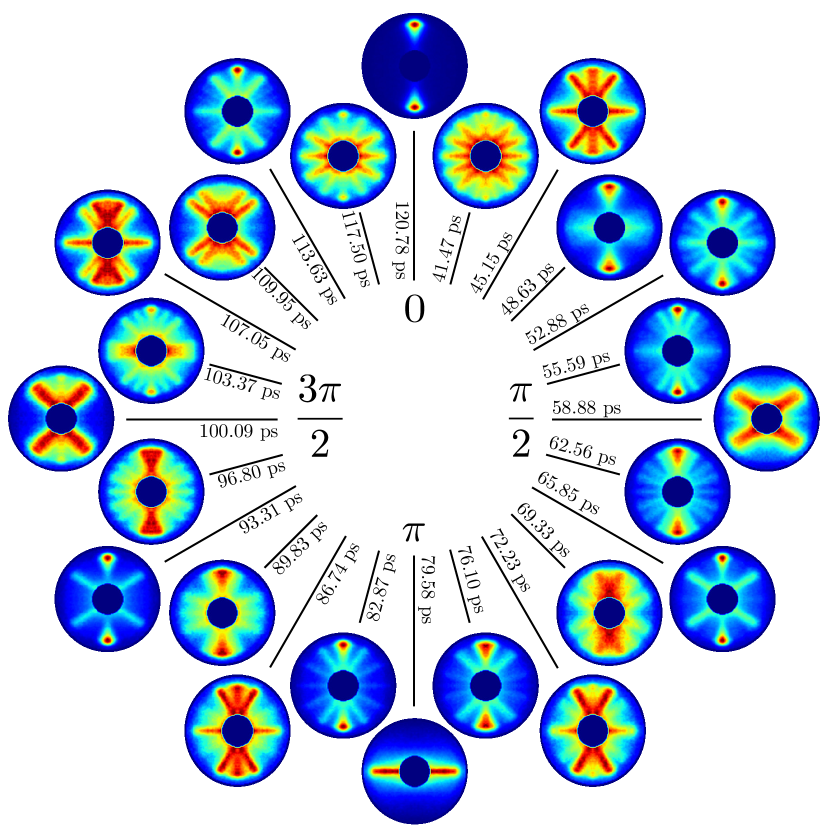
In Fig. 1 snapshots of the experimentally recorded molecular movie, i. e., 2D ion-momentum distributions, are shown for several probe times covering a whole rotational period. The phase of and correspond to ps and ps after the peak of the first alignment laser pulse at , respectively. The simplest snapshot-images, reflecting an unprecedented degree of field-free alignment , were obtained for the alignment revivals at phases of and , which correspond to the prompt alignment and its revival regarding the second laser pulse. Here, the molecular axes are preferentially aligned along the alignment-laser polarisation. For the anti-alignment at a phase of the molecules are preferentially aligned in a plane perpendicular to the alignment laser polarisation direction. Simple quadrupolar structures are observed at and . At intermediate times, e. g., at or , the images display rich angular structures, which could be observed due to the high angular experimental resolution of the recorded movie, which is as derived in the Supplementary Information. This rich structure directly reflects the strongly quantum-state selected initial sample exploited in these measurements, whereas the structure would be largely lost in the summation of wavepackets from even a few initially populated states.
The dynamics was analysed as follows: Through the interaction of the molecular ensemble with the alignment laser pulses, a coherent wavepacket was created from each of the initially populated rotational states. These wavepackets were expressed as a coherent superposition of eigenfunctions of the field-free rotational Hamiltonian, i. e.,
| (1) |
with the time-dependent complex amplitudes , the spherical harmonics , the quantum number of angular momentum , and its projection onto the laboratory-fixed axis defined by the laser polarisation. We note that was conserved and thus no dependence existed. The angular distribution is defined as the sum of the squared moduli of all weighted by the initial-state populations.
The degree of alignment was extracted from the VMI images using the commonly utilised expectation value . The maximum value observed at the alignment revival reached , which, to the best of our knowledge, is the highest degree of field-free alignment achieved to date. Comparing the angular distributions at different delay times with the degree of alignment , see Fig. S4 in the Supplementary Information, we observed the same degree of alignment for angular distributions that are in fact very different from each other. This highlights that much more information is contained in the angular distributions than in the commonly utilised expectation value Stapelfeldt and Seideman (2003). Indeed, merely describes the leading term in an expansion of the angular distribution, for instance, in terms of Legendre polynomials, see (1) in the Supplementary Information. In order to fully characterise the angular distribution a description in terms of a polynomial series is necessary that involves the same maximum order as the maximum angular momentum of the populated rotational eigenstates, which corresponds to, at most, lobes in the momentum maps.
As the probe laser is polarised perpendicularly to the detector plane, the cylindrical symmetry as generated by the alignment-laser polarisation was broken and an Abel inversion to retrieve the 3D angular distribution directly from the experimental VMI images was not possible. In order to retrieve the complete 3D wavepacket, the time-dependent Schrödinger equation (TDSE) was solved for a rigid rotor coupled to a non-resonant ac electric field representing the two laser pulses as well as the dc electric field of the VMI spectrometer. For a direct comparison with the experimental data the rotational wavepacket and thus the 3D angular distribution was constructed and, using a Monte-Carlo approach, projected onto a 2D screen using the radial distribution extracted from the experiment at the alignment revival at 120.78 ps. The relation between the 3D rotational wavepacket and the 2D projected density is graphically illustrated in Fig. S2 of the Supplementary Information. The anisotropic angle-dependent ionisation efficiency for double ionisation, resulting in a two-body breakup into O+ and CS+ fragments, was taken into account by approximating it by the square of the measured single-electron ionisation rate. Non-axial recoil during the fragmentation process is expected to be negligible and was not included in the simulations.
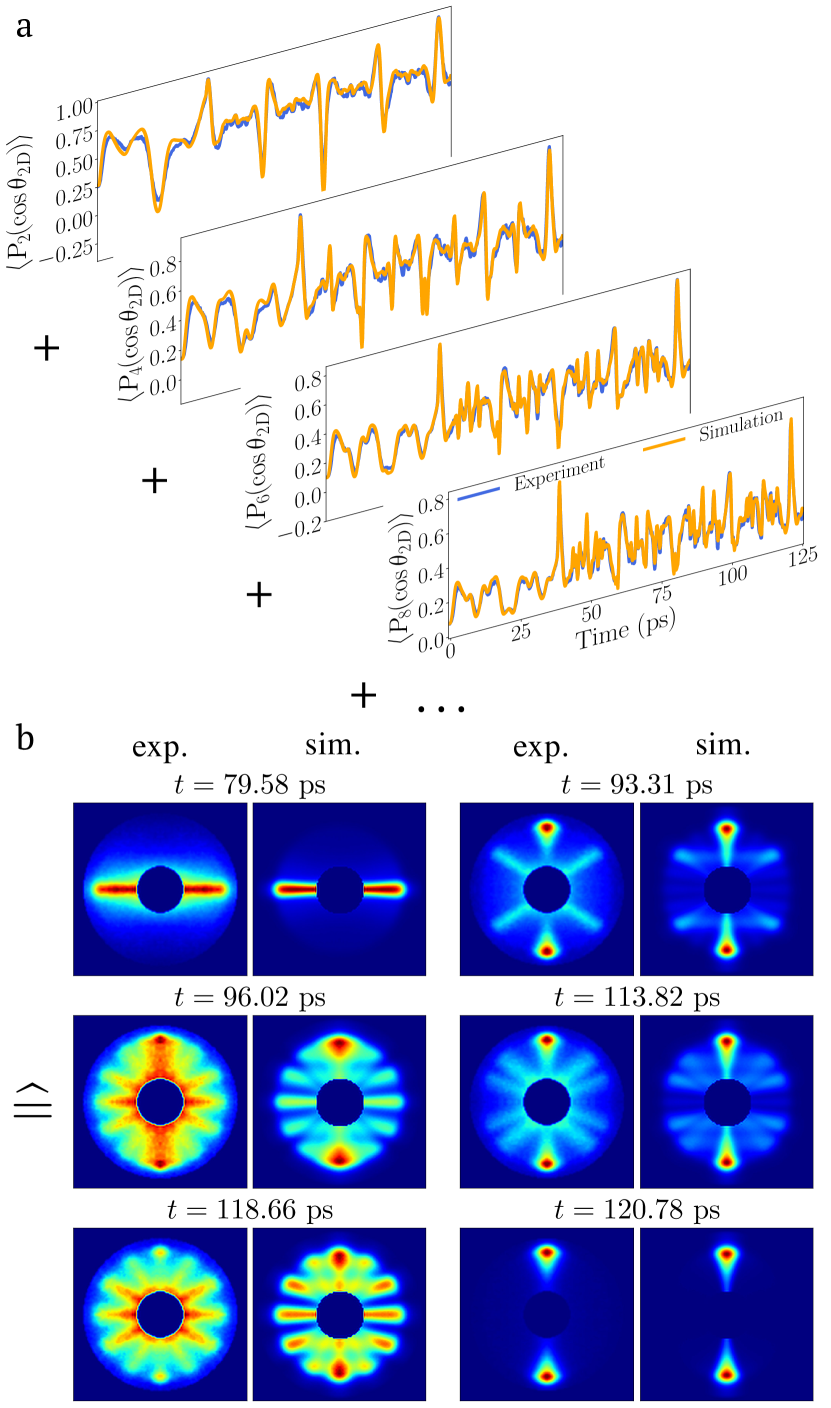
The initial state distribution in the quantum-state selected OCS sample as well as the interaction volume with the alignment and probe lasers were not known a priori and used as fitting parameters. For each set of parameters the TDSE was solved and the 2D projection of the rotational density, averaged over the initial state distribution and the interaction volume of the pump and probe lasers, was carried out. The aforementioned expansion in terms of Legendre polynomials was realised for the experimental and simulated angular distributions and the best fit was determined through least squares minimisation, see Supplementary Information. Taking into account the eight lowest even moments of the angular distribution allowed to precisely reproduce the experimental angular distribution. The results for the first four moments are shown in Fig. 6 a; the full set is given in Fig. S3 in the Supplementary Information as well as the optimal fitting parameters. The overall agreement between experiment and theory is excellent for all moments. Before the onset of the second pulse, centred around ps, the oscillatory structure in all moments is fairly slow compared to later times, which reflects the correspondingly small number of interfering states in the wavepacket before the second pulse, and the large number thereafter.
Theoretical images, computed for the best fit parameters, are shown in Fig. 6 b; a full movie is provided with the Supplementary Information. The theoretical results are in excellent agreement with the measured ion-momentum angular distributions at all times, see Supplementary Information, and prove that we were able to fully reconstruct the 3D rotational wavepacket with the amplitudes and phases of all rotational states included.
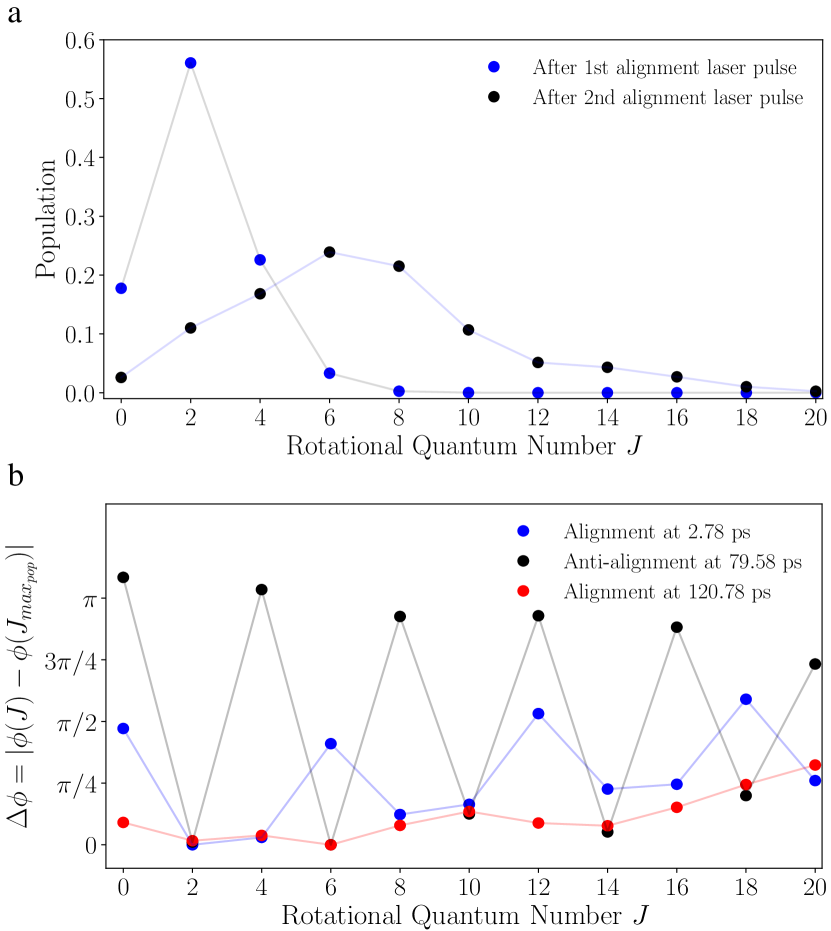
a Rotational-state populations and b phase-differences to the phase of the state with largest population, , respectively, at the alignment revival following a single-pulse excitation, ps (blue dots), and the two-pulse excitation, ps (red dots) as well as for the antialignment at ps (black dots, populations coincide with the red dots). Only states with even angular momentum are populated due to the Raman-transition selection rules .
In Fig. 3 a, the extracted rotational-state populations are shown for the wavepacket created from the rotational ground state after the first and the second alignment laser pulse. It clearly shows that the rotational-state distribution is broader after the second pulse, reaching up to . This also matches the convergence of the Legendre-polynomial series, with eight even terms, derived from the fit to the data above. In Fig. 3 b the corresponding phase differences for all populated states relative to the initial state with the largest population in the wavepacket are shown, where is the phase of the complex coefficient in (1). Combining these populations and phases it became clear that the very high degree of alignment after the second alignment pulse arises from the combination of the broad distribution of rotational states, reaching large angular momenta, and the very strong and flat rephasing of all significantly populated states at the revival at ps, Fig. 3 b (red). Similarly, the anti-alignment at ps occurs due to alternating phase differences of between adjacent populated rotational states, Fig. 3 b (black).
In conclusion, we were able to record a high-resolution molecular movie of the ultrafast coherent rotational motion of impulsively aligned OCS molecules. State-selection and an optimised two-pulse sequence yielded an unprecedented degree of field-free alignment of , with a very narrow angular confinement of FWHM. Limiting the analysis to a determination of , as it is common in experiments on time-dependent alignment, did not allow to capture the rich rotational dynamics, while the use of a polynomial expansion up to an appropriate order did. We reconstructed the rotational wavepacket, from which the complex coefficients and, hence, the full information about the rotational wavepacket under study was extracted. The 2D projection of the reconstructed rotational wavepacket allowed a direct comparison with the experimentally measured data.
Regarding the extension toward the investigation of chemical dynamics, we point out that strong-field-ionisation-induced Coulomb-explosion imaging can be used, for instance, to image the configuration of chiral molecules Pitzer et al. (2013) or internal torsional dynamics Christensen et al. (2014). Following the dynamics of such processes with the detail and quality presented here would directly yield a molecular movie of the chemical and, possibly, chirality dynamics Owens et al. (2018). Furthermore, the very high degree of field-free alignment achieved here would be extremely useful for stereochemistry studies Kuipers et al. (1988); Rakitzis et al. (2004) as well as for molecular-frame imaging experiments Itatani et al. (2004); Holmegaard et al. (2010); Filsinger et al. (2011); Hensley et al. (2012); Küpper et al. (2014); Yang et al. (2016b); Weber et al. (2013); Pullen et al. (2015); Barty et al. (2013).
I Methods
A cold molecular beam was formed by supersonic expansion of a mixture of OCS ( ppm) in helium, maintained at a backing pressure of bar from a pulsed Even-Lavie valve Hillenkamp et al. (2003) operated at Hz. After passing two skimmers, the collimated molecular beam entered the Stark deflector. The beam was dispersed according to quantum state by a strong inhomogeneous electric field Chang et al. (2015) with a nominal strength of kV/cm. Through a movable third skimmer, the molecular beam entered the spectrometer. Here, it was crossed at right angle by laser beams, where the height of the laser beams allowed to probe state-selected molecular ensembles, i. e., a practically pure rovibronic-ground-state sample of OCS Nielsen et al. (2011); Trippel et al. (2014, 2015).
The laser setup consisted of a commercial Ti:Sapphire laser system (KM labs) delivering pulses with mJ pulse energy, fs (FWHM) pulse duration, and a central wavelength of 800 nm at a kHz repetition rate. One part (20 mJ) of the laser output was used to pump a high-energy tunable optical parametric amplifier (HE-TOPAS, Light Conversion) to generate pulses with a central wavelengths of , a pulse duration of 60 fs, and a pulse energy of mJ. of the remaining nm laser output was used for the laser-induced alignment, i. e., the generation of the investigated rotational wavepackets. This beam was split into two parts with a 4:1 energy ratio using a Mach-Zehnder interferometer. A motorised delay stage in one beam path allowed for controlling the delay between the two pulses. This delay was optimised experimentally and maximum alignment was observed for ps, in perfect agreement with the theoretically predicted ps. The pulses were combined collinearly and passed through a 2 cm long optical glass to stretch them to fs pulse duration (FWHM). Then the alignment pulses were collinearly overlapped with the 1.75 µm mid-infrared pulses using a dichroic mirror. All pulses were focused into the velocity map imaging spectrometer (VMI) using a 25 cm focal-distance calcium fluoride lens.
At the center of the VMI the state-selected molecular beam and the laser beams crossed at right angle. Following strong-field multiple ionisation of the molecules, the generated charged fragments were projected by the VMI onto a combined multichannel-plate (MCP) phosphor-screen detector and read out by a CCD camera. The angular resolution of the imaging system is , limited by the 1 megapixel camera, see Supplementary Information. 2D ion-momentum distributions of O+ fragments were recorded as a function of the delay between the nm pulses and the ionising pulses in order to characterise the angular distribution of the molecules through Coulomb-explosion imaging. The polarisation of the nm alignment pulses was parallel to the detector screen whereas that of the ionising laser was perpendicular in order to avoid geometric-alignment effects in the angular distributions. For this geometry, unfortunately, it was not possible to retrieve 3D distributions from an inverse Abel transform. 651 images were recorded in steps of fs, covering the time interval from -0.7 ps up to 125 ps, which is more than one and a half times the rotational period of OCS of 82.2 ps.
II Optimisation of two-pulse field-free alignment
Optimisation calculations were performed in order to predict the optimal pulse parameter for single and two-pulse field-free alignment. In the simulations, the rotational part of the Schrödinger equation for a linear rigid rotor within the Born-Oppenheimer approximation coupled to non-resonant ac alignment laser pulses and a static electric field, as provided by the VMI in the interaction region, was used. The Hamiltonian of the system is described in detail in reference Omiste:PRA86:043437. The global differential-evolution-optimisation algorithm Storn:JGP11:341 was used to calculate the optimal alignment characterised through the expectation value in a closed-feedback-loop approach. The optimisation parameters used were the intensities and one common duration of Fourier-limited Gaussian pulses and the delay between the pulses in the case of two-pulse alignment. In the calculations a pure rotational ground state ensemble was assumed and no integration over the interaction volume was carried out. The former is justified as we know that the ground state contribution to alignment is dominant and the exact experimental conditions were not known a priori. Furthermore, exploiting the electrostatic deflector, as in our experiment, almost pure ground state ensembles can be prepared Nielsen et al. (2011); Chang et al. (2015). Including also thermally excited rotational states lead to an additional incoherent sum over all states present in the initial distribution of rotational states and in general to a decrease of the degree of alignment. The same holds for the interaction volume of the laser since only molecules at the center of the beam experience the optimal alignment intensity while molecules at some distance from the center interact with a lower field. In this sense the calculated values constitute an upper limit for the alignment under optimal conditions.
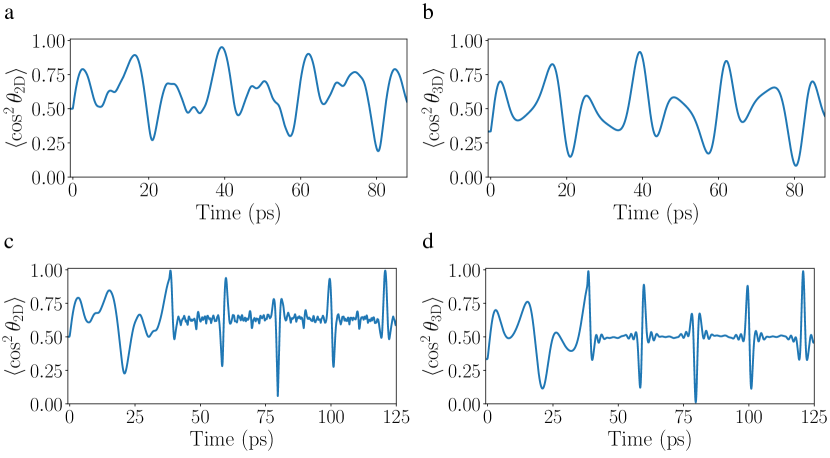
Time-evolution curves of the optimal two-dimensional (2D) and three-dimensional (3D) alignment are shown in Fig. 4 . The results for the single pulse optimisation yielded a pulse duration of fs and a maximum intensity of TW/cm2. The corresponding maximum degree of field-free 3D alignment was found to be , which is in agreement with an upper bound of derived previously Guérin et al. (2008); this corresponds to a 2D degree of alignment of .
The optimal parameters for the case of two alignment pulses were found to be a pulse duration of fs, a pulse separation between the two pulses of ps, and an intensity-ratio of with the first pulse being weaker than the second one, in agreement with previous results Bisgaard:PRL92:173004; Leibscher et al. (2003). The maximum intensity of the first pulse was determined to be TW/cm2 and that of the second pulse TW/cm2, which was the upper bound of intensities included in the calculations since for higher values at a wavelength of nm a non-negligible amount of ionisation of OCS sets in. The maximum degree of 3D field-free alignment calculated with these parameters were and , substantially higher than in the single pulse case. The experiment presented in the main paper was performed under experimental conditions approximating these optimised parameter. We note that the optimal pulse separation was calculated to be ps, which was confirmed in the experiment, for which a scan of the pulse separation yielded the best alignment revival for ps.
III Moments of angular distribution
There are several ways to expand the angular distribution of the wavepacket in a power series 111We had indeed originally performed the analysis in terms of squared Chebyshev polynomials for numerical convenience and the results of both approaches are identical., but a natural basis consists of the Legendre polynomials, as for the eigenstates are independent of and the spherical harmonics simplify to Legendre polynomials. Only even order polynomials appear in the expansion since for a ground-state-selected ensemble the odd order moments describe orientation of the molecular axes, which was not present. The expansion takes on the form
| (2) |
where the full time-dependent angular distribution is denoted as and () are the expansion coefficients corresponding to the -th Legendre polynomial ; is the angular momentum quantum number of the highest populated rotational state in the wavepacket.
In order to characterise the initial state distribution of rotational states in the molecular beam, the eight lowest even-order moments of the experimental angular distributions were fitted simultaneously using least squares minimisation. For each moment, squared differences were summed according to
| (3) |
where the sum runs over all measured delay times and . In order to compute , several steps were followed. First, the coherent wavepackets, created through the interaction with the alignment laser pulses, were for every initial state described in the basis of field-free eigenstates as
| (4) |
where are time-dependent complex coefficients with amplitude , phase , and initial condition , is the Kronecker delta, obtained from the solution of the time-dependent Schrödinger equation; are the spherical-harmonic functions and are the quantum numbers of the initial state from which the wavepacket is formed. The sum runs only over , since was a good quantum number due to cylindrical symmetry, as imposed by the linear polarisation of the alignment laser, and, hence, and was conserved. Furthermore, the selection rules for transitions between different rotational states were , since the population transfer is achieved via non-resonant two-photon Raman transitions. Moreover, the static VMI field was perpendicular to the alignment laser polarisation and does not mix different states. Since more than one rotational state were initially populated, the 3D rotational density was obtained through the incoherent average with statistical weights
| (5) |
which were not known a priori and used as fitting parameters. The function describes the angle-dependent ionisation probability, which was approximated through the square of the measured angular-dependent single-electron ionisation rate. Finally, a focal average over the interaction region with the alignment and probe laser beam profiles, assumed to be Gaussian, was performed. The average over intensities in the laser focus was calculated through integration
| (6) |
with radius at W/cm2 and a normalisation factor. The dependence of the rotational wavepackets on the alignment laser intensities is explicitly stated in (6). The widths of the laser beams were also not known a priori and were included as further fitting parameters. The resulting focal- and initial-state-averaged 3D rotational densities were projected onto a 2D plane using a Monte-Carlo sampling routine, which included the experimental radial distribution extracted at the full revival at a delay time of ps, yielding the simulated VMI images in Fig. 2 in the main paper. The relation between the 3D rotational density and the 2D projected density is graphically illustrated in Fig. 5 .
The Legendre moments of the angular distribution were then extracted from the 2D projected images and compared to experiment through , as described in (3). The statistical weights of the initial state distribution and the laser focal sizes were varied until converged to its minimum. The individual populations determined through the fitting procedure are , , , , and and the optimal focal parameter were determined to be for the alignment laser and for the probe laser. The results are consistent with the fact that the probe laser was tighter focused than the alignment laser such that only molecules exhibiting strong alignment, close to the beam center, are probed.
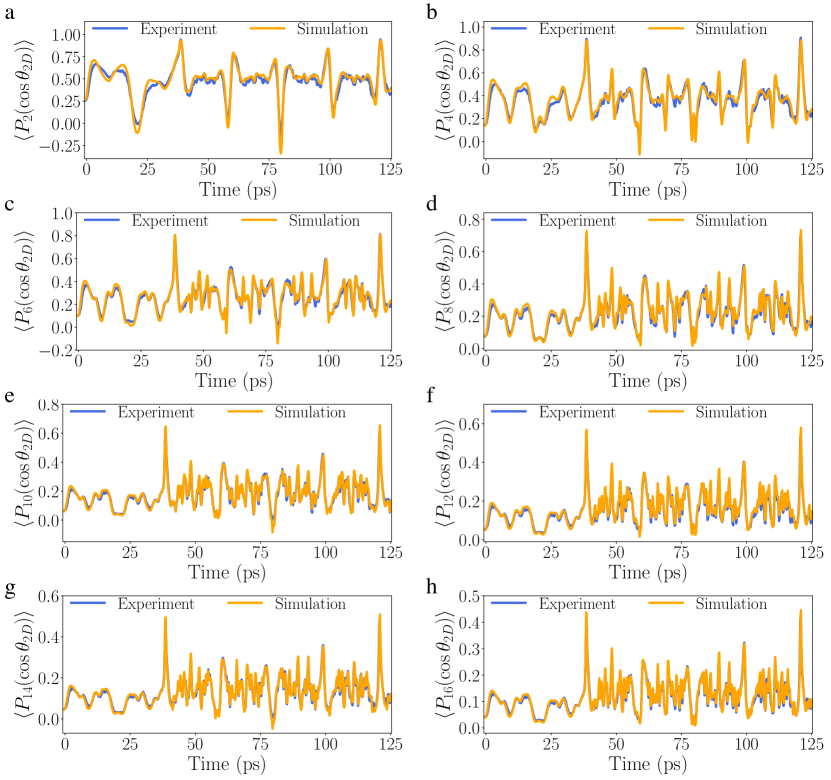
The final results of the fitting procedure are shown in Fig. 2 in the main paper and in Fig. 6 . The simulated angular distributions and the moments of the angular distribution are in excellent agreement with the experiment, in particular all oscillations are correctly captured, even for the highest-order moments. The experimental parameters used for the simulations were the peak intensities for the two alignment pulses of W/cm2 and W/cm2, the pulse duration of the alignment laser pulses fs, the time delay between the two alignment laser pulses ps, and the pulse duration of the probe laser fs. Calculations with 21 initial states, i. e., , included in the initial rotational state distribution were originally performed, but convergence was already reached for the 6 lowest-energy states and the fitting procedure was restricted to using these 6 lowest rotational states, i. e., , and the focal volume was averaged over 100 intensities in W/cm2. In all calculations the basis for each coherent wavepacket included all rotational states up to .
IV Angular distributions
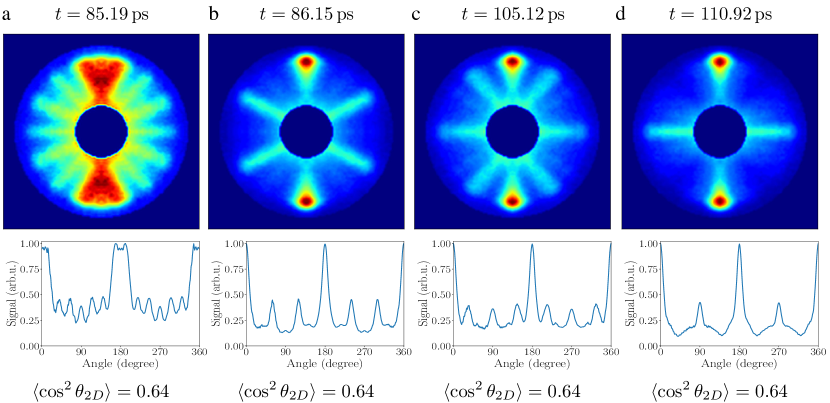
As pointed out in the main text, we observed angular probability distributions showing the very rich time evolution of the rotational wavepacket created by the two alignment laser pulses. When characterising the degree of alignment using the commonly used we observed that completely different angular distributions possess the same degree of alignment, which pointed out the need for higher order terms in the expansion of the total angular distribution, e. g., in the basis of Legendre polynomials, to be able to reconstruct the complete rotational wavepacket. In Fig. 7 we present O+ ion momentum distributions measured at four different delay times together with their corresponding angular distributions corroborating this observation. The delay times were chosen such that all distributions have the same , corresponding to the permanent alignment level. Although the degree of alignment is quite low compared to the maximum degree of alignment achieved, one clearly sees in particular in Fig. 7 b–d that nevertheless there is a substantial amount of molecules being strongly aligned. Thus it is clearly not sufficient to just use the degree of alignment in terms of to characterise the molecular alignment distribution, but the knowledge of the whole angular distribution is needed.
IV.1 Comparison of angular distributions from experiment and simulations
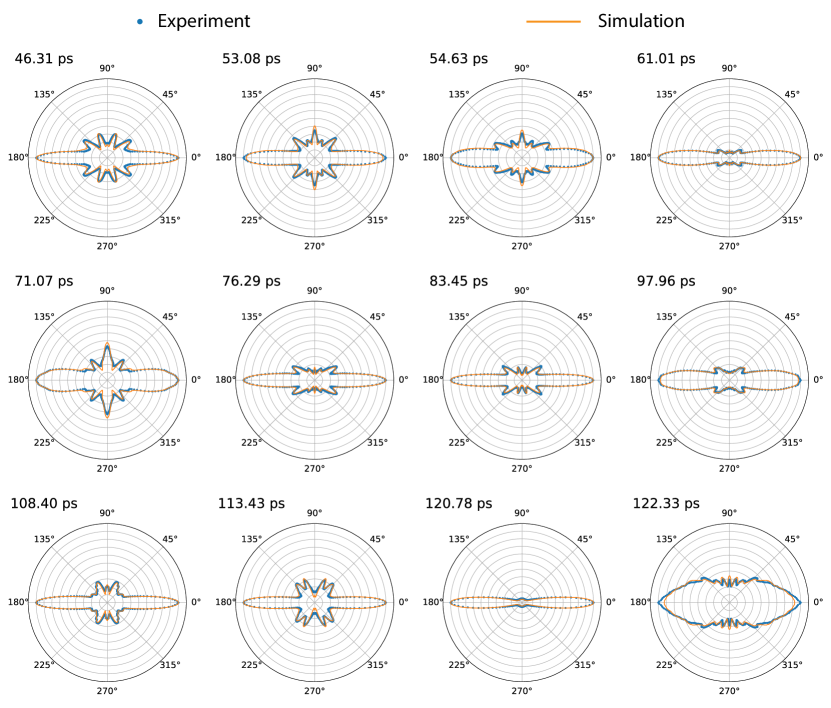
We show a comparison of angular distributions extracted from experiment and from the simulated, 2D projected rotational densities for selected times, starting after the arrival of the second alignment laser pulse in Fig. 8 . The angular distributions display rich features, the simplest one being the alignment revival at a delay time of ps. For better visibility the angular distributions have all been scaled up individually to maximise visibility, except for the alignment revival at ps.
V Angular resolution
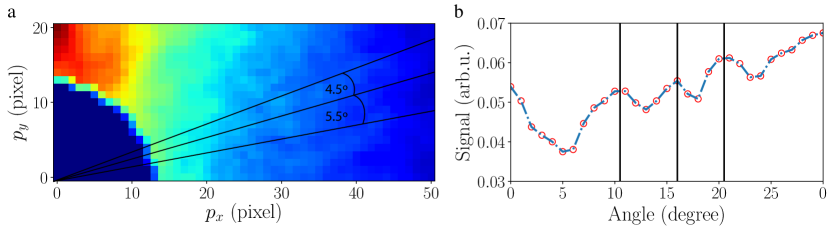
The angular resolution was defined by the radius of the Coulomb channel in the VMI image, at which the angular distribution was extracted, and the number of pixels needed to distinguish two successive maxima or minima. The center of the radial Coulomb channel was at a radius of pixel, which yielded an angle of per pixel, corresponding to a limit for the resolution to separate two maxima or minima of . In Fig. 9 a, a O+ ion momentum distribution recorded at a delay time of ps is shown with lines indicating the angles at which maxima in the angular distribution appear. In Fig. 9 b the corresponding angular distribution is shown, where the maxima are clearly visible and distinguishable.
VI Highest observed degree of alignment
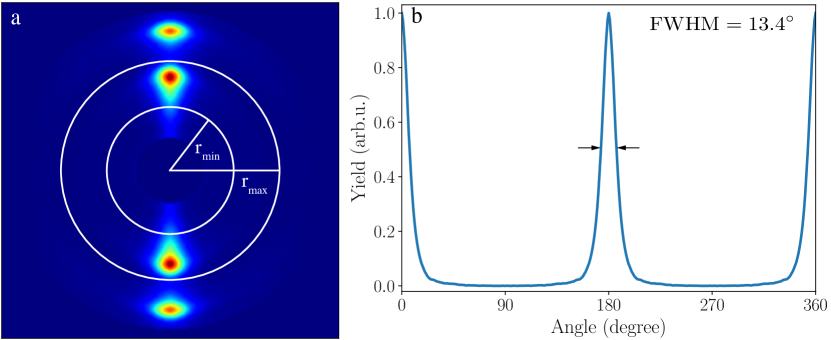
In Fig. 10 a the O+ ion momentum distribution of the strongest observed field-free alignment is shown. The image was recorded at a delay time of ps, which is the alignment revival, one rotational period after the arrival of the second alignment pulse. The degree of alignment was as stated in the main text. The value was obtained through integration in the shell between and . In Fig. 10 b the corresponding angular distribution is shown, which yielded an opening angle of .
Acknowledgments
This work has been supported by the Deutsche Forschungsgemeinschaft (DFG) through the priority program “Quantum Dynamics in Tailored Intense Fields” (QUTIF, SPP1840, KU 1527/3, RO4577/4) and by the Clusters of Excellence “Center for Ultrafast Imaging” (CUI, EXC 1074, ID 194651731) and “Advanced Imaging of Matter” (AIM, EXC 2056, ID 390715994) of the Deutsche Forschungsgemeinschaft (DFG), and by the European Research Council under the European Union’s Seventh Framework Programme (FP7/2007-2013) through the Advanced Grant “DropletControl” (ERC-320459-Stapelfeldt) and the Consolidator Grant “COMOTION” (ERC-614507-Küpper).
Author contributions
The project was conceived and coordinated by AR and JK. The experiment was designed by KD, JK, AR; set up by ETK, SR, KD, RRJ, and AR; and performed by ETK, SR, AT, ST, GG, PS, and AR. The data analysis and numerical simulations were performed by ETK, the results from theory and experiment were analyzed by ETK, TM, AT, ST, AR, and JK and discussed with HS and MJJV. The manuscript was prepared by ETK, ST, and JK and discussed by all authors.
Competing Interests
The authors declare that they have no competing financial interests.
Correspondence
Correspondence and requests for materials should be addressed to Jochen Küpper <jochen.kuepper@cfel.de> and Arnaud Rouzée <rouzee@mbi-berlin.de>.
References
- Zewail (2000) A. H. Zewail, “Femtochemistry: Atomic-scale dynamics of the chemical bond,” J. Phys. Chem. A 104, 5660–5694 (2000).
- Ischenko et al. (2017) A. A. Ischenko, P. M. Weber, and R. J. D. Miller, “Capturing chemistry in action with electrons: Realization of atomically resolved reaction dynamics,” Chem. Rev. 117, 11066–11124 (2017).
- Ayyer et al. (2016) K. Ayyer, O. M. Yefanov, D. Oberthür, S. Roy-Chowdhury, L. Galli, V. Mariani, S. Basu, J. Coe, C. E. Conrad, R. Fromme, A. Schaffer, K. Dörner, D. James, C. Kupitz, M. Metz, G. Nelson, P. L. Xavier, K. R. Beyerlein, M. Schmidt, I. Sarrou, J. C. H. Spence, U. Weierstall, T. A. White, J.-H. Yang, Y. Zhao, M. Liang, A. Aquila, M. S. Hunter, J. S. Robinson, J. E. Koglin, S. Boutet, P. Fromme, A. Barty, and H. N. Chapman, “Macromolecular diffractive imaging using imperfect crystals,” Nature 530, 202–206 (2016).
- Küpper et al. (2014) J. Küpper, S. Stern, L. Holmegaard, F. Filsinger, A. Rouzée, A. Rudenko, P. Johnsson, A. V. Martin, M. Adolph, A. Aquila, S. Bajt, A. Barty, C. Bostedt, J. Bozek, C. Caleman, R. Coffee, N. Coppola, T. Delmas, S. Epp, B. Erk, L. Foucar, T. Gorkhover, L. Gumprecht, A. Hartmann, R. Hartmann, G. Hauser, P. Holl, A. Hömke, N. Kimmel, F. Krasniqi, K.-U. Kühnel, J. Maurer, M. Messerschmidt, R. Moshammer, C. Reich, B. Rudek, R. Santra, I. Schlichting, C. Schmidt, S. Schorb, J. Schulz, H. Soltau, J. C. H. Spence, D. Starodub, L. Strüder, J. Thøgersen, M. J. J. Vrakking, G. Weidenspointner, T. A. White, C. Wunderer, G. Meijer, J. Ullrich, H. Stapelfeldt, D. Rolles, and H. N. Chapman, “X-ray diffraction from isolated and strongly aligned gas-phase molecules with a free-electron laser,” Phys. Rev. Lett. 112, 083002 (2014), arXiv:1307.4577 [physics] .
- Hensley et al. (2012) C. J. Hensley, J. Yang, and M. Centurion, “Imaging of isolated molecules with ultrafast electron pulses,” Phys. Rev. Lett. 109, 133202 (2012).
- Pande et al. (2016) K. Pande, C. D. M. Hutchison, G. Groenhof, A. Aquila, J. S. Robinson, J. Tenboer, S. Basu, S. Boutet, D. P. DePonte, M. Liang, T. A. White, N. A. Zatsepin, O. Yefanov, D. Morozov, D. Oberthuer, C. Gati, G. Subramanian, D. James, Y. Zhao, J. Koralek, J. Brayshaw, C. Kupitz, C. Conrad, S. Roy-Chowdhury, J. D. Coe, M. Metz, P. L. Xavier, T. D. Grant, J. E. Koglin, G. Ketawala, R. Fromme, V. Šrajer, R. Henning, J. C. H. Spence, A. Ourmazd, P. Schwander, U. Weierstall, M. Frank, P. Fromme, A. Barty, H. N. Chapman, K. Moffat, J. J. van Thor, and M. Schmidt, “Femtosecond structural dynamics drives the trans/cis isomerization in photoactive yellow protein,” Science 352, 725–729 (2016).
- Yang et al. (2016a) J. Yang, M. Guehr, X. Shen, R. Li, T. Vecchione, R. Coffee, J. Corbett, A. Fry, N. Hartmann, C. Hast, K. Hegazy, K. Jobe, I. Makasyuk, J. Robinson, M. S. Robinson, S. Vetter, S. Weathersby, C. Yoneda, X. Wang, and M. Centurion, “Diffractive imaging of coherent nuclear motion in isolated molecules,” Phys. Rev. Lett. 117, 153002 (2016a).
- Felker et al. (1986) P. M. Felker, J. S. Baskin, and A. H. Zewail, “Rephasing of collisionless molecular rotational coherence in large molecules,” J. Phys. Chem. 90, 724–728 (1986).
- Rosca-Pruna and Vrakking (2001) F. Rosca-Pruna and M. J. J. Vrakking, “Experimental observation of revival structures in picosecond laser-induced alignment of I2,” Phys. Rev. Lett. 87, 153902 (2001).
- Stapelfeldt and Seideman (2003) H. Stapelfeldt and T. Seideman, “Colloquium: Aligning molecules with strong laser pulses,” Rev. Mod. Phys. 75, 543–557 (2003).
- Mizuse et al. (2015) K. Mizuse, K. Kitano, H. Hasegawa, and Y. Ohshima, “Quantum unidirectional rotation directly imaged with molecules,” Science Advances 1, e1400185 (2015).
- Dooley et al. (2003) P. W. Dooley, I. V. Litvinyuk, K. F. Lee, D. M. Rayner, M. Spanner, D. M. Villeneuve, and P. B. Corkum, “Direct imaging of rotational wave-packet dynamics of diatomic molecules,” Phys. Rev. A 68, 023406 (2003).
- Marceau et al. (2017) C. Marceau, V. Makhija, D. Platzer, A. Y. Naumov, P. B. Corkum, A. Stolow, D. M. Villeneuve, and P. Hockett, “Molecular frame reconstruction using time-domain photoionization interferometry,” Phys. Rev. Lett. 119, 083401 (2017).
- Yang et al. (2016b) J. Yang, M. Guehr, T. Vecchione, M. S. Robinson, R. Li, N. Hartmann, X. Shen, R. Coffee, J. Corbett, A. Fry, K. Gaffney, T. Gorkhover, C. Hast, K. Jobe, I. Makasyuk, A. Reid, J. Robinson, S. Vetter, F. Wang, S. Weathersby, C. Yoneda, M. Centurion, and X. Wang, “Diffractive imaging of a rotational wavepacket in nitrogen molecules with femtosecond megaelectronvolt electron pulses,” Nat. Commun. 7, 11232 (2016b).
- Ghafur et al. (2009) O. Ghafur, A. Rouzée, A. Gijsbertsen, W. K. Siu, S. Stolte, and M. J. J. Vrakking, “Impulsive orientation and alignment of quantum-state-selected NO molecules,” Nat. Phys. 5, 289–293 (2009).
- Trippel et al. (2015) S. Trippel, T. Mullins, N. L. M. Müller, J. S. Kienitz, R. González-Férez, and J. Küpper, “Two-state wave packet for strong field-free molecular orientation,” Phys. Rev. Lett. 114, 103003 (2015), arXiv:1409.2836 [physics] .
- Felker (1992) P. M. Felker, “Rotational coherence spectroscopy: studies of the geometries of large gas-phase species by picosecond time-domain methods,” J. Phys. Chem. 96, 7844–7857 (1992).
- Riehn (2002) C. Riehn, “High-resolution pump-probe rotational coherence spectroscopy - rotational constants and structure of ground and electronically excited states of large molecular systems,” Chem. Phys. 283, 297–329 (2002).
- Lee et al. (2004) K. Lee, D. Villeneuve, P. Corkum, and E. Shapiro, “Phase control of rotational wave packets and quantum information,” Phys. Rev. Lett. 93, 233601 (2004).
- Trippel et al. (2014) S. Trippel, T. Mullins, N. L. M. Müller, J. S. Kienitz, J. J. Omiste, H. Stapelfeldt, R. González-Férez, and J. Küpper, “Strongly driven quantum pendulum of the carbonyl sulfide molecule,” Phys. Rev. A 89, 051401(R) (2014), arXiv:1401.6897 [quant-ph] .
- Mouritzen and Mølmer (2006) A. S. Mouritzen and K. Mølmer, “Quantum state tomography of molecular rotation,” J. Chem. Phys. 124, 244311 (2006).
- Hasegawa and Ohshima (2008) H. Hasegawa and Y. Ohshima, “Quantum state reconstruction of a rotational wave packet created by a nonresonant intense femtosecond laser field,” Phys. Rev. Lett. 101, 053002 (2008).
- Berry et al. (2001) M. Berry, I. Marzoli, and W. Schleich, “Quantum carpets, carpets of light,” Phys. World 14, 39–46 (2001).
- Leibscher et al. (2003) M. Leibscher, I. Averbukh, and H. Rabitz, “Molecular alignment by trains of short laser pulses,” Phys. Rev. Lett. 90, 213001 (2003).
- Guérin et al. (2008) S. Guérin, A. Rouzée, and E. Hertz, “Ultimate field-free molecular alignment by combined adiabatic-impulsive field design,” Phys. Rev. A 77, 041404 (2008).
- Chang et al. (2015) Y.-P. Chang, D. A. Horke, S. Trippel, and J. Küpper, “Spatially-controlled complex molecules and their applications,” Int. Rev. Phys. Chem. 34, 557–590 (2015), arXiv:1505.05632 [physics] .
- Eppink and Parker (1997) A. T. J. B. Eppink and D. H. Parker, “Velocity map imaging of ions and electrons using electrostatic lenses: Application in photoelectron and photofragment ion imaging of molecular oxygen,” Rev. Sci. Instrum. 68, 3477–3484 (1997).
- Pitzer et al. (2013) M. Pitzer, M. Kunitski, A. S. Johnson, T. Jahnke, H. Sann, F. Sturm, L. P. H. Schmidt, H. Schmidt-Böcking, R. Dörner, J. Stohner, J. Kiedrowski, M. Reggelin, S. Marquardt, A. Schießer, R. Berger, and M. S. Schöffler, “Direct determination of absolute molecular stereochemistry in gas phase by coulomb explosion imaging,” Science 341, 1096–1100 (2013).
- Christensen et al. (2014) L. Christensen, J. H. Nielsen, C. B. Brandt, C. B. Madsen, L. B. Madsen, C. S. Slater, A. Lauer, M. Brouard, M. P. Johansson, B. Shepperson, and H. Stapelfeldt, “Dynamic stark control of torsional motion by a pair of laser pulses,” Phys. Rev. Lett. 113, 073005 (2014).
- Owens et al. (2018) A. Owens, A. Yachmenev, S. N. Yurchenko, and J. Küpper, “Climbing the Rotational Ladder to Chirality,” Phys. Rev. Lett. 121, 193201 (2018), arXiv:1802.07803 [physics] .
- Kuipers et al. (1988) E. W. Kuipers, M. G. Tenner, A. Kleyn, and S. Stolte, “Observation of steric effects in gas-surface scattering,” Nature 334, 420–422 (1988).
- Rakitzis et al. (2004) T. P. Rakitzis, A. J. van den Brom, and M. H. M. Janssen, “Directional dynamics in the photodissociation of oriented molecules,” Science 303, 1852–1854 (2004).
- Itatani et al. (2004) J. Itatani, J. Levesque, D. Zeidler, H. Niikura, H. Pépin, J. C. Kieffer, P. B. Corkum, and D. M. Villeneuve, “Tomographic imaging of molecular orbitals,” Nature 432, 867–871 (2004).
- Holmegaard et al. (2010) L. Holmegaard, J. L. Hansen, L. Kalhøj, S. L. Kragh, H. Stapelfeldt, F. Filsinger, J. Küpper, G. Meijer, D. Dimitrovski, M. Abu-samha, C. P. J. Martiny, and L. B. Madsen, “Photoelectron angular distributions from strong-field ionization of oriented molecules,” Nat. Phys. 6, 428 (2010), arXiv:1003.4634 [physics] .
- Filsinger et al. (2011) F. Filsinger, G. Meijer, H. Stapelfeldt, H. Chapman, and J. Küpper, “State- and conformer-selected beams of aligned and oriented molecules for ultrafast diffraction studies,” Phys. Chem. Chem. Phys. 13, 2076–2087 (2011), arXiv:1009.0871 [physics] .
- Weber et al. (2013) S. J. Weber, M. Oppermann, and J. P. Marangos, “Role of rotational wave packets in strong field experiments,” Phys. Rev. Lett. 111, 263601 (2013).
- Pullen et al. (2015) M. G. Pullen, B. Wolter, A.-T. Le, M. Baudisch, M. Hemmer, A. Senftleben, C. D. Schroter, J. Ullrich, R. Moshammer, C. D. Lin, and J. Biegert, “Imaging an aligned polyatomic molecule with laser-induced electron diffraction,” Nat. Commun. 6, 7262 (2015).
- Barty et al. (2013) A. Barty, J. Küpper, and H. N. Chapman, “Molecular imaging using x-ray free-electron lasers,” Annu. Rev. Phys. Chem. 64, 415–435 (2013).
- Hillenkamp et al. (2003) M. Hillenkamp, S. Keinan, and U. Even, “Condensation limited cooling in supersonic expansions,” J. Chem. Phys. 118, 8699–8705 (2003).
- Nielsen et al. (2011) J. H. Nielsen, P. Simesen, C. Z. Bisgaard, H. Stapelfeldt, F. Filsinger, B. Friedrich, G. Meijer, and J. Küpper, “Stark-selected beam of ground-state OCS molecules characterized by revivals of impulsive alignment,” Phys. Chem. Chem. Phys. 13, 18971–18975 (2011), arXiv:1105.2413 [physics] .