A JND-based Video Quality Assessment Model and Its Application
Abstract
Based on the Just-Noticeable-Difference (JND) criterion, a subjective video quality assessment (VQA) dataset, called the VideoSet, was constructed recently. In this work, we propose a JND-based VQA model using a probabilistic framework to analyze and clean collected subjective test data. While most traditional VQA models focus on content variability, our proposed VQA model takes both subject and content variabilities into account. The model parameters used to describe subject and content variabilities are jointly optimized by solving a maximum likelihood estimation (MLE) problem. As an application, the new subjective VQA model is used to filter out unreliable video quality scores collected in the VideoSet. Experiments are conducted to demonstrate the effectiveness of the proposed model.
Index Terms:
Video Quality Assessment, Subjective Viewing Model, Just Noticeable Difference.I Introduction
Subjective quality evaluation is the ultimate means to measure quality of experience (QoE) of users. Formal methods and guidelines for subjective quality assessments are specified in various ITU recommendations, such as ITU-T P.910 [1], ITU-R BT.500 [2], etc. Several datasets on video quality assessment were proposed, such as the LIVE dataset [3], the Netflix Public dataset [4], the VQEG HD3 dataset [5] and the VideoSet [6]. Furthermore, efforts have been made in developing objective quality metrics such as VQM-VFD [7], MOVIE [8] and VMAF [4].
Machine learning-based video quality assessment (VQA) systems rely heavily on the quality of collected subjective scores. A typical pipeline consists of three main steps. First, a group of human viewers are recruited to grade video quality based on individual perception. Second, noisy subjective data should be cleaned and combined to provide an estimate of the actual video quality. Third, a machine learning model was trained and tested on the calibrated datasets, and the performance was reported in terms of evaluation criteria. They are called the data collection, cleaning and analysis steps, respectively. In this work, we propose a novel method for the data cleaning step, which is essential for a variety of video contents viewed by different individuals. This is a challenging problem due to the following variabilities.
-
•
Inter-subject variability. Subjects may have a different vision capability.
-
•
Intra-subject variability. The same subject may have different scores against the same content in multiple rounds.
-
•
Content variability. Video contents have varying characteristics.
When each content is evaluated several times by different subjects, a straightforward approach is to use the most common label as the true label [9]. This problem was examined more carefully in [10], which verified the distribution assumptions required for parametric testing. Furthermore, it discussed practical considerations and made recommendations in the testing procedure. Based on the Just-Noticeable-Difference (JND) criterion, a VQA dataset, called the VideoSet [6], was constructed recently. Being motivated by [11], we develop a probabilistic VQA model to quantify the influence of subject and content factors on JND-based VQA scores. Furthermore, we show that our model is more robust than the MOS-based model in [11] for noisy measurements cleaning.
The rest of this work is organized as follows. Related previous work is reviewed in Sec. II. The proposed JND-based VQA model is introduced in Sec. III. The parameters inference problem is examined in Sec. IV. Experimental results in data cleaning are shown in Sec. V. Concluding remarks are given in Sec. VI.
II Review of Related Work
The impacts of subject and content variabilities on video quality scores are often analyzed separately. A -score consistency test was used as a preprocessing step to identify unreliable subjects in the VideoSet. Another method was proposed in [12], which built a probabilistic model for the quality evaluation process and then estimated model parameters with a standard inference approach. A subject model was proposed in [13] to study the influence of subjects on test scores. An additive model was adopted and model parameters were estimated using real data obtained by repetitive experiments on the same content. More recently, a generative model was proposed in [11] that treated content and subject factors jointly by solving a maximum likelihood estimation (MLE) problem. Their model was developed targeting on the traditional mean-opinion-scores (MOS) data acquisition process with continuous degradation category rating.
The JND-based VOA methodology provides a new framework for fine-grained video quality scores acquisition. Several JND-based VQA datasets were constructed [6, 14, 15], and JND location prediction methods were examined in [16, 17]. Being inspired by [11], we develop a JND-based VQA model that considers subject and content variabilities jointly in this work. Then, we will show that this new method provides a powerful data cleaning tool for JND-based VQA datasets.
III Derivation of JND-based VQA Model
Consider a VQA dataset containing video contents, where each source video clip is denoted by , . Each source clip is encoded into a set of coded clips , , where is the quantization parameter (QP) index used in the H.264/AVC standard. By design, clip has a higher PSNR value than clip , if , and is the losslessly coded copy of . The JND of this set of coded clips characterizes the distortion visibility threshold with respect to a given anchor, . Through subjective experiments, JND points can be obtained from a sequence of consecutive noticeable/unnoticeable difference tests between clips pair , where .
III-A Binary Decisions in Subjective JND Tests
The anchor, , is fixed while searching for the JND location. With a binary search procedure to update , it takes at most rounds to find the JND location. Here, we use , , to indicate the round number and , , to indicate the subject index, respectively. The test result obtained from subject at round on content is a binary decision - noticeable or unnoticeable differences. This is denoted by random variable . If the decision is unnoticeable difference, we set . Otherwise, . The probability of can be written as
| (1) |
where random variable is used to model the probability of making the “unnoticeable difference” decision at a given comparison.
We say that a decision was made confidently if all subjects made the same decision, no matter it was “noticeable difference” or “unnoticeable difference”. One the other hand, a decision was made least confidently if two decisions had equal sample size. In light of these observations, should be closer to zero for smaller since the quality difference between two clips is more obvious in earlier test rounds. It is close to 0.5 for larger as the coded clip approaches the final JND location.
III-B JND Localization by Integrating Multiple Binary Decisions
During the subjective test, a JND sample was obtained through multiple binary decisions. Let denote a sequence of decisions made by subject on content . Random variable is assumed to be independently identically distributed (i.i.d) in subject index . Furthermore, is independent of content index since the binary search approaches the ultimate JND location at the same rate regardless of the content. The search interval at round , denoted by , can be expressed as
| (2) |
where is the initial JND interval for the first JND. The anchor location is , i.e. the reference and the JND is searched between . We skip comparison between clips pair since it is a trivial one.
By definition, the JND location is the coded clip that is the transition point from the unnoticeable difference to the noticeable difference against the anchor. It is located at the last round after a sequence of “noticeable difference” decisions. Thus, the JND location on content for subject can be obtained by integrating searching intervals based on decision sequences as
| (3) |
since we need to add to the offset (or the left ending) point of the current searching interval if and keep the same offset if . The distance between the left end point of the search interval and the JND location is no larger than one QP when the search procedure converges. Then, the JND location could be expressed as a function of the confidence of subject on content :
| (4) |
III-C Decomposing JND into Content and Subject Factors
The JND locations depend on several causal factors: 1) the bias of the subject, 2) the consistency of a subject, 3) the averaged JND location, 4) the difficulty of a content to evaluate. To provide a closed-form expression of the JND location, we adopt the following probabilistic model for the confidence random variable:
| (5) |
where is the averaged confidence, and are two Gaussian random variables to capture content and subject factors, respectively. and are weights to control the effects of mentioned factors. We set , and empirically.
By plugging Eq. (5) into Eq. (4), we can express the JND location as
| (6) |
where and are content factors. and are subject factors. is a constant.
The JND-based VQA model in Eq. (6) decomposes the JND location into the content term and the subject term. The difficulty of a content is modeled by . A larger value means that its masking effect is stronger and the most experienced experts still have difficulty in spotting artifacts in compressed clips. The bias of a subject is modeled by parameter . If , the subject is more sensitive to quality degradation in compressed video clips. If , the subject is less sensitive to distortions. The sensitivity of an averaged subject has a bias around . Moreover, the subject variance, , captures the consistency of subject . A consistent subject evaluates all sequences deliberately.


IV Parameter Estimation
The JND-based VQA model in Eq. (6) has a set of parameters to determine; namely, with and . Under the assumption that contents and subjects are independent factors on perceived video quality, the JND location can be expressed by the Gaussian distribution in form of
| (7) |
where and . The task is to estimate unknown parameters jointly given observations on a set of contents from a group of subjects. A standard inference method to recover the true MOS score was studied in [11]. Here, we extend the procedure to estimate the parameters in the JND-based VQA model.
Let be the log-likelihood function. One can show that the optimal estimator of is given by . By omitting constant terms, we can express the log-likelihood function as
| (8) | ||||
The first and second order derivatives of with respect to each parameter can be derived. They are used to update the parameters at each iteration according to the Newton-Raphson rule, i.e. .
V Experimental Results
In this section, we evaluate the performance of the proposed model using real JND data from the VideoSet and compare it with another commonly used method. For reproducibility, the source code of the proposed model is available at: https://github.com/JohnhqWang/sureal.

V-A Experiment Settings
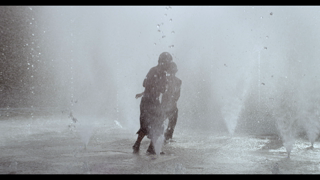
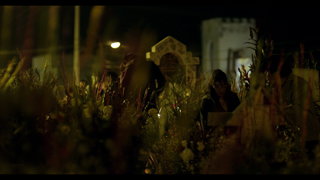
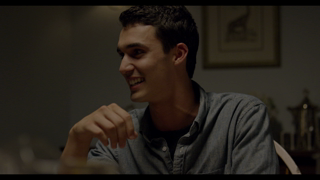
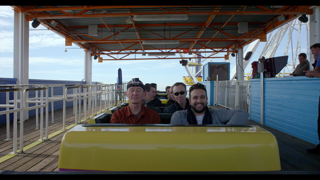
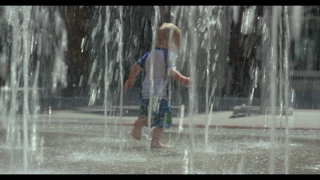
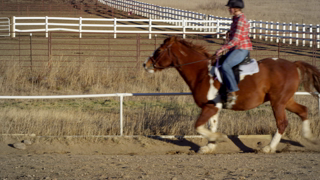
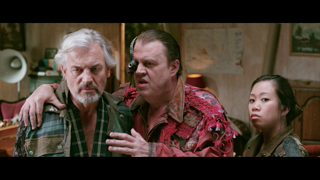
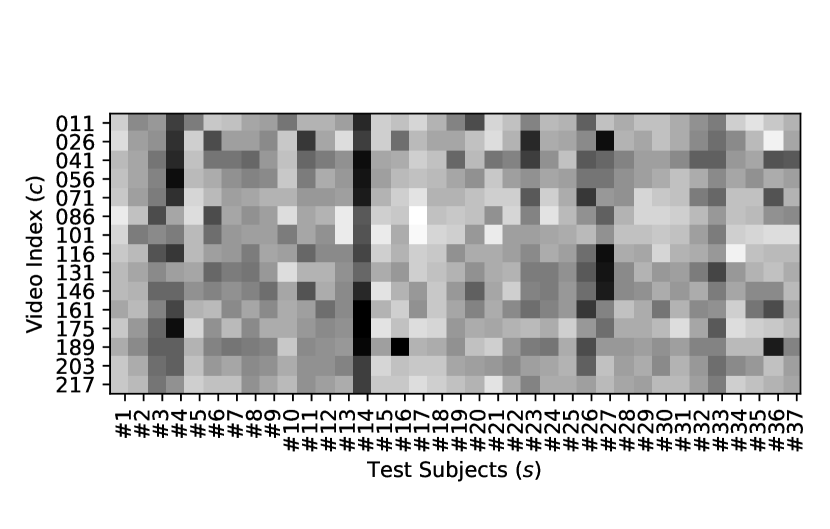
The VideoSet contains 220 video contents in 4 resolutions and three JND points per resolution per content. During the subjective test, the dataset was split into 15 subsets and each subset was evaluated independently by a group of subjects. We adopt a subset of the first JND points on 720p video in the experiment. The subset contains 15 video contents evaluated by 37 subjects. One representative frame from each of the 15 video clips is shown in Fig. 1. The measured raw JND scores are shown in Fig. 2(a).
Standard procedures have been provided by the ITU for subject screening and data modeling. For example, a subject rejection method was proposed in the ITU-R BT.500 Recommendation [2]. The differential MOS was defined in the ITU-T P.910 Recommendation [1] to alleviate the influence of subject and content factors. However, these procedures do not directly apply to the collected JND VQA data due to a different methodology. Traditional VQA subjective tests evaluate video quality by a score while the JND-based VQA subjective tests target at the distortion visibility threshold.
Here, we compare the proposed VQA model whose parameters are estimated by the MLE method with those estimated by the standard MOS approach [11] in two different settings. First, we compare them based on raw JND data without any cleaning process. Second, we clean unreliable data using the proposed VQA model and compare these two models with the cleaned JND data.
V-B Experiments on Raw JND Data
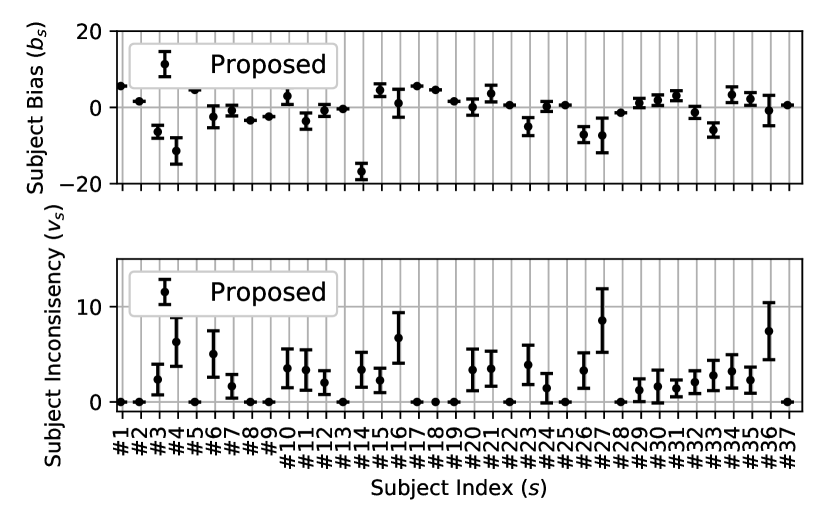
The first experiment was conducted on the raw JND data without outlier removal. Some subjects completed the subjective test hastily without sufficient attention. By jointly estimating the content and subject factors, a good VQA data model can identify such outlying quality ratings from unreliable subjects. The estimated subject bias and inconsistency are shown in Fig. 2(b). The proposed JND-based VQA model indicates that the bias of subjects #04 and #16 is very significant (more than 10 QPs) as compared with others. Furthermore, the proposed model suggests that subjects #16, #26 and #36 exhibit large inconsistency. The observation was evidenced by the noticeable dark dots on some contents.
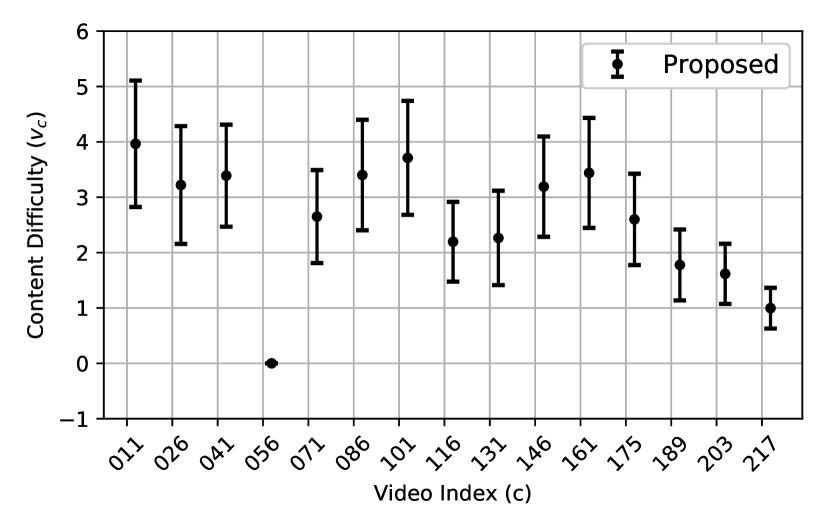
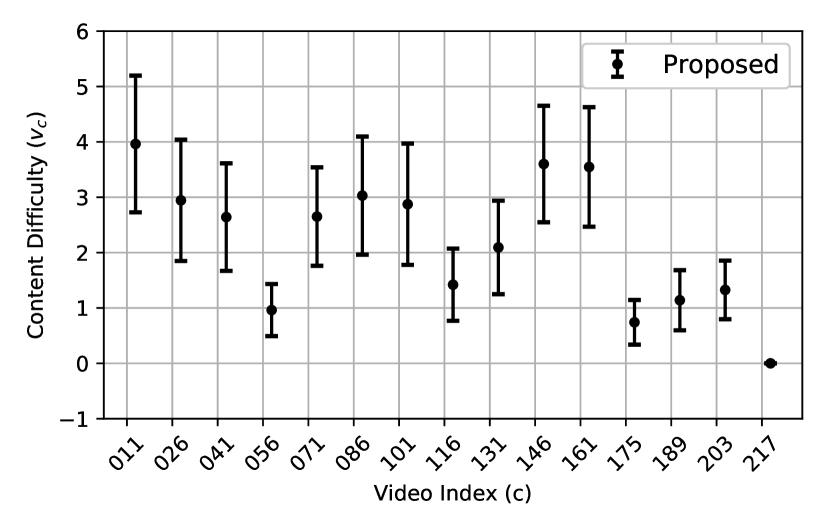
Fig. 2(c) shows the estimated content difficulty. Content #11 is a scene about toddlers playing in a fountain. The masking effect is strong due to water drops in the background and moving objects. Thus, compression artifacts are difficult to perceive and it has the highest content difficulty. On the other hand, content #203 is a scene captured with still camera. It focuses on speakers with still blurred background. The content difficulty is low as the masking effect is weak and compression artifacts are more noticeable.
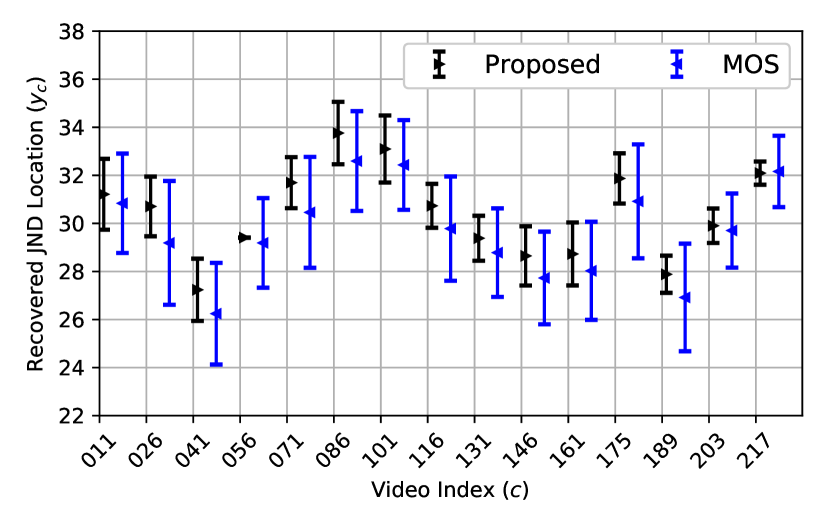
The estimated JND locations using the proposed VQA+MLE method and the MOS method are compared in Fig. 2(e). The proposed method offers more confident estimates as its confidence intervals are much tighter than those estimated by the MOS method. More importantly, the estimates by the proposed method are significantly different from those by the MOS method. It is well known that the mean value is vulnerable to outliers for a fixed sample size. The proposed method is more robust to noisy subjective scores, which tend to have a negative bias in general.
V-C Experiments on Cleaned JND Data
Here, we remove the outlying JND samples detected by the proposed model. They are from subjects with a larger bias value or inconsistent measures. We show the estimated content difficulty in Fig. 2(d) and compare the estimated JND locations of the proposed method and the MOS method in Fig. 2(f) on the cleaned dataset. We see that the proposed VQA+MLE method can estimate the relative content difficulty accurately. We also notice that the estimation changed a lot for some contents. The reason is that considerable portion () of the subjects were removed. The bias and inconsistency of the removed scores have great influence on the conclusion of these contents.
By comparing Figs. 2(e) and 2(f), we observe that outlying samples changed the distribution of recovered JND locations in both methods. First, the confidence intervals of the MOS method decrease a lot. It reflects the vulnerability of the MOS method due to noisy samples. In contrast, the proposed VQA+MLE method is more robust. Second, the recovered JND location increases by 0.5 to 1 QP in both methods after removing noisy samples. It demonstrates the importance of building a good VQA model and using it to filter out noisy samples.
VI Conclusion and future work
A JND-based VQA model was proposed to analyze measured JND-based VQA data. The model considered subject and content variabilities, and determined its parameters by solving an MLE problem iteratively. The technique can be used to remove biased and inconsistent samples and estimate the content difficulty and JND locations. It was shown by experimental results that the proposed methodology is more robust to noisy subjects than the traditional MOS method.
The MLE optimization problem may have multiple local maxima and the iterative optimization procedure may not converge to the global maximum. We would like to investigate this problem deeper in the future. Also, we may look for other parameter estimation methods that are more efficient and robust.
References
- [1] ITU-T P.910, “Subjective video quality assessment methods for multimedia applications,” 1999.
- [2] ITU-R BT. 500, “Methodology for the subjective assessment of the quality of television pictures,” 2003.
- [3] K. Seshadrinathan, R. Soundararajan, A. C. Bovik, and L. K. Cormack, “Study of subjective and objective quality assessment of video,” IEEE transactions on image processing, vol. 19, no. 6, pp. 1427–1441, 2010.
- [4] Z. Li, A. Aaron, I. Katsavounidis, A. Moorthy, and M. Manohara, “Toward a practical perceptual video quality metric,” The Netflix Tech Blog, vol. 6, 2016.
- [5] V. Q. E. Group et al., “Report on the validation of video quality models for high definition video content,” VQEG, Geneva, Switzerland, Tech. Rep.[Online]. Available: http://www. its. bldrdoc. gov/vqeg/projects/hdtv/hdtv. aspx, 2010.
- [6] H. Wang, I. Katsavounidis, J. Zhou, J. Park, S. Lei, X. Zhou, M.-O. Pun, X. Jin, R. Wang, X. Wang et al., “Videoset: A large-scale compressed video quality dataset based on jnd measurement,” Journal of Visual Communication and Image Representation, vol. 46, pp. 292–302, 2017.
- [7] S. Wolf and M. Pinson, “Video quality model for variable frame delay (vqm-vfd),” National Telecommunications and Information Administration NTIA Technical Memorandum TM-11-482, 2011.
- [8] K. Seshadrinathan and A. C. Bovik, “Motion tuned spatio-temporal quality assessment of natural videos,” IEEE transactions on image processing, vol. 19, no. 2, pp. 335–350, 2010.
- [9] J. Whitehill, T.-f. Wu, J. Bergsma, J. R. Movellan, and P. L. Ruvolo, “Whose vote should count more: Optimal integration of labels from labelers of unknown expertise,” in Advances in neural information processing systems, 2009, pp. 2035–2043.
- [10] M. Narwaria, L. Krasula, and P. Le Callet, “Data analysis in multimedia quality assessment: Revisiting the statistical tests,” IEEE Transactions on Multimedia, 2018.
- [11] Z. Li and C. G. Bampis, “Recover subjective quality scores from noisy measurements,” in Data Compression Conference (DCC), 2017. IEEE, 2017, pp. 52–61.
- [12] Q. Liu, J. Peng, and A. T. Ihler, “Variational inference for crowdsourcing,” in Advances in neural information processing systems, 2012, pp. 692–700.
- [13] L. Janowski and M. Pinson, “The accuracy of subjects in a quality experiment: A theoretical subject model,” IEEE Transactions on Multimedia, vol. 17, no. 12, pp. 2210–2224, 2015.
- [14] L. Jin, J. Y. Lin, S. Hu, H. Wang, P. Wang, I. Katasvounidis, A. Aaron, and C.-C. J. Kuo, “Statistical study on perceived JPEG image quality via MCL-JCI dataset construction and analysis,” in IS&T/SPIE Electronic Imaging. International Society for Optics and Photonics, 2016.
- [15] H. Wang, W. Gan, S. Hu, J. Y. Lin, L. Jin, L. Song, P. Wang, I. Katsavounidis, A. Aaron, and C.-C. J. Kuo, “MCL-JCV: A JND-based H.264/AVC video quality assessment dataset,” in 2016 IEEE International Conference on Image Processing (ICIP), Sept 2016, pp. 1509–1513.
- [16] Q. Huang, H. Wang, S. C. Lim, H. Y. Kim, S. Y. Jeong, and C.-C. J. Kuo, “Measure and prediction of hevc perceptually lossy/lossless boundary qp values,” in Data Compression Conference (DCC), 2017. IEEE, 2017, pp. 42–51.
- [17] H. Wang, I. Katsavounidis, Q. Huang, X. Zhou, and C.-C. J. Kuo, “Prediction of satisfied user ratio for compressed video,” arXiv preprint arXiv:1710.11090, 2017.