ANALYSIS AND PREDICTION OF JND-BASED VIDEO QUALITY MODEL
Abstract
The just-noticeable-difference (JND) visual perception property has received much attention in characterizing human subjective viewing experience of compressed video. In this work, we quantify the JND-based video quality assessment model using the satisfied user ratio (SUR) curve, and show that the SUR model can be greatly simplified since the JND points of multiple subjects for the same content in the VideoSet can be well modeled by the normal distribution. Then, we design an SUR prediction method with video quality degradation features and masking features and use them to predict the first, second and the third JND points and their corresponding SUR curves. Finally, we verify the performance of the proposed SUR prediction method with different configurations on the VideoSet. The experimental results demonstrate that the proposed SUR prediction method achieves good performance in various resolutions with the mean absolute error (MAE) of the SUR smaller than 0.05 on average.
Index Terms:
Video Quality Assessment, Satisfied User Ratio, Just Noticeable DifferenceI Introduction
Real-time video streaming contributed to the largest amount of Internet traffic in both fixed and mobile networks according to the global Internet phenomena report in 2016 [1]. It accounted for 71% downstream bytes of fixed access and 40% of downstream bytes of mobile access, respectively. The streaming service providers, such as Netflix, YouTube, and Amazon, strive to provide users with the best viewing experience given the constraints of network bandwidth and viewing device resolutions. For example, a Per-Title encode optimization technique [2] was proposed to run analysis on an individual content to determine the optimal encoding recipe based on its complexity. However, due to diversity of the video content and display devices, it is a very challenging problem to develop a Video Quality Metric (VQM) that can accurately and consistently measure human perceptual quality of a video stream.
In the past decades, there has been a large amount of efforts in developing new visual quality metrics to address this problem, including SSIM [3], FSIM [4], DLM [5], etc. These methods have been evaluated on several public databases and achieve high consistency with the calibrated scores by human. In the existing databases, the distorted images and videos are assigned a set of discrete or continuous values called opinion scores; and the typical opinion scores in the range [1,5], with 5 being the best quality and 1 denoting the worst quality. The quality of the images/videos are acquired by averaging these subjects’ opinion scores, named mean opinion scores (MOS). However, there is one shortcoming with these calibrated databases. That is, the difference of selected contents for ranking is sufficiently obvious for a great majority of subjects and easy to distinguish.
In fact, humans cannot perceive small pixel variation in coded images/videos until the difference reaches a certain level, which is denoted as just-noticeable-difference (JND). There is a recent trend to measure the JND threshold directly for each individual subject. The idea was first proposed in [6]. An assessor is asked to compare a pair of coded image/video contents and determine whether they are the same or not in the subjective test, and a bisection search is adopted to reduce the number of comparisons. Two small-scale JND-based image/video quality datasets were built by the Media Communications Lab at the University of Southern California, i.e., MCL-JCI dataset [7] and MCL-JCV dataset [8]. They target at the JND measurement of JPEG coded images and H.264/AVC coded videos, respectively. More recently, a large-scale JND-based video quality dataset, called the VideoSet, was built and reported in [9]. The VideoSet consists of 220 5-second sequences, each at four resolutions (i.e., , , and ). Each of these 880 video clips was encoded by the x264 encoder implementation [10] of the H.264/AVC standard with and the first three JND points were evaluated by 30+ subjects.
The JND reflects the boundary of perceived quality changes, which is well suitable to determine the optimal image/video quality with minimum bit rates. There are also several JND prediction methods based on the these JND-based datasets proposed in literatures. Huang et al. [11] proposed a JND prediction method by utilizing the masking effect related features, and designed a spatial-temporal sensitive map (STSM) to capture the unique characteristics of the source content. In [12], a machine learning framework was proposed to predict the Satisfied User Ratio (SUR) curve of the first JND. It took both the local quality degradation as well as the masking effect into consideration and extracted a compact feature vector to feed it into the support vector regressor to obtain the predicted SUR curve.
In this paper, we revisit the JND modeling problem with an in-depth analysis on practical compressed video. Based on the analysis, we propose to model the JND samples of multiple subjects by normal distribution. Furthermore, we extend our previous work in [12] to predict the second and the third JND points under the normal distribution assumption of JND samples. We validate the proposed JND point prediction method on the VideoSet under different test settings, and conclude that the proposed method can well predict the JND points. On the other hand, the prediction accuracy is sensitive to the QP value of anchor clips. Finally, we show possible applications of the proposed JND/SUR model in adaptive video streaming services.
The rest of the paper is organized as follows. The JND and SUR curve models are introduced in Sec. II. The proposed SUR prediction method for multiple JND points is introduced in Sec. III. Experimental results are provided in Sec. IV. Finally, concluding remarks and future research direction are given in Sec. V.
II Just-Noticeable-Difference (JND) and Satisfied User Ratio (SUR) Modeling
For a source video clip denoted by , it can be compressed into a set of clips , , where is the quantization parameter (QP) index used in H.264/AVC. Typically, clip has a higher PSNR value than clip , if , and is the losslessly coded copy of . The JND of coded clips characterizes the distortion visibility threshold with respect to a given anchor, . Through the subjective experiment, JND points can be obtained from a sequence of consecutive Noticeable/Unnoticeable difference tests between clips pair .
The anchor, , is fixed while searching for the JND location. We adopt a binary search procedure and it takes at maximum rounds to find the JND location. We use , , to indicate the round number and , , to indicate the subject index, respectively. The result is denoted by a random variable . If a pair has noticeable difference, we set . Otherwise, . The JND test outcome obtained from the subject at the round is
| (1) |
where indicates the confidence of making the “noticeable difference” decision of the subject at the round.
The probability is close to one for smaller since the quality difference between two clips in comparison is clearer in early test rounds. It is close to 0.5 for larger as the coded clip approaches the final JND location. It is assumed that is identically distributed for a specific . Meanwhile, is independently distributed because subjects are randomly recruited. The JND interval at round , denoted by , can be expressed as
| (2) |
where is the initial JND interval. Finally, the JND location for subject can be written as
| (3) |
since we need to add to the offset (or left) point of the current JND interval if and keep the same offset if . Then, Eq. (4) can be simplified to
| (4) |
where the first term is a constant. We are not able to find a closed form for the second term. For this reason, we plan to study the relationship between this term and the probability model in Eq. (1) by numerical simulation in the future.
On the other hand, we have verified the JND normal distribution assumption by the standard normality test [13] in Table I. We see from the table that there is a high probability for the measured JND samples to pass the standard normality test.
| Resolution | The first JND | The second JND | The third JND |
|---|---|---|---|
| 1080p | |||
| 720p | |||
| 540p | |||
| 360p |
It is worth mentioning that the JND is flexible in modeling the subjective viewing experience because the anchor clip can be any coded clip. For simplicity, we use the first JND to demonstrate the methodology to predict the QoE. The same methodology applies to other JND points as well. The first JND location is the transitional index that lies on the boundary of perceptually lossless and lossy visual experience for a subject. We first transfer the QoE measure to the satisfied user ratio (SUR) prediction. A viewer is satisfied for a compressed video if it appears to be perceptually the same as its reference/anchor. Mathematically, the satisfied user ratio (SUR) of video clip can be expressed as
| (5) |
where is the total number of subjects and is the indicator function. or if the subject can or cannot see the difference between compressed clip and its reference, respectively. The summation term in the right-hand-side of Eq. (5) is the empirical cumulative distribution function (CDF) of JND samples. Then, we can obtain a compact formula for the SUR curve as
| (6) |
where is the Q-function of a Normal distribution. and are the sample mean and variance of JND samples, respectively.
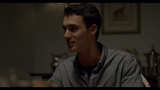
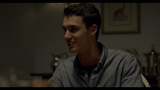
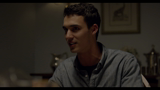
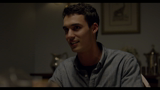
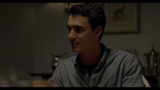
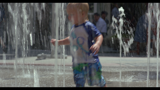
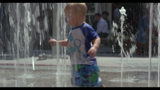
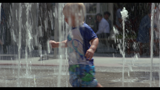
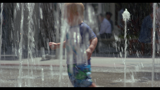
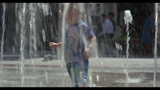
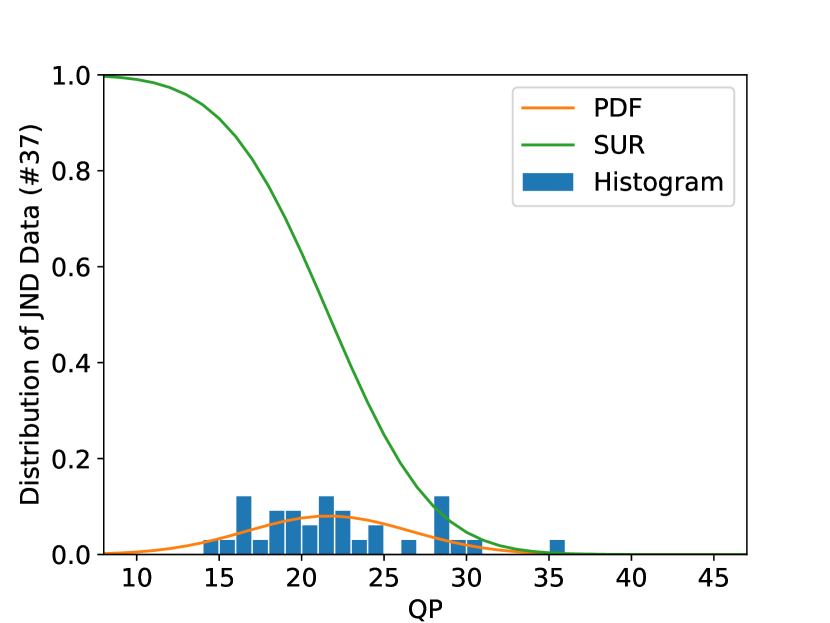
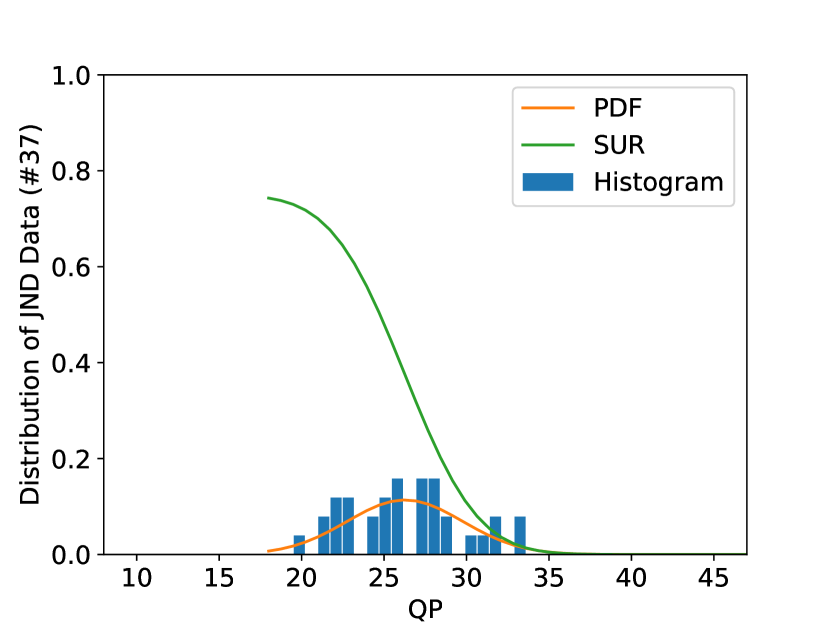
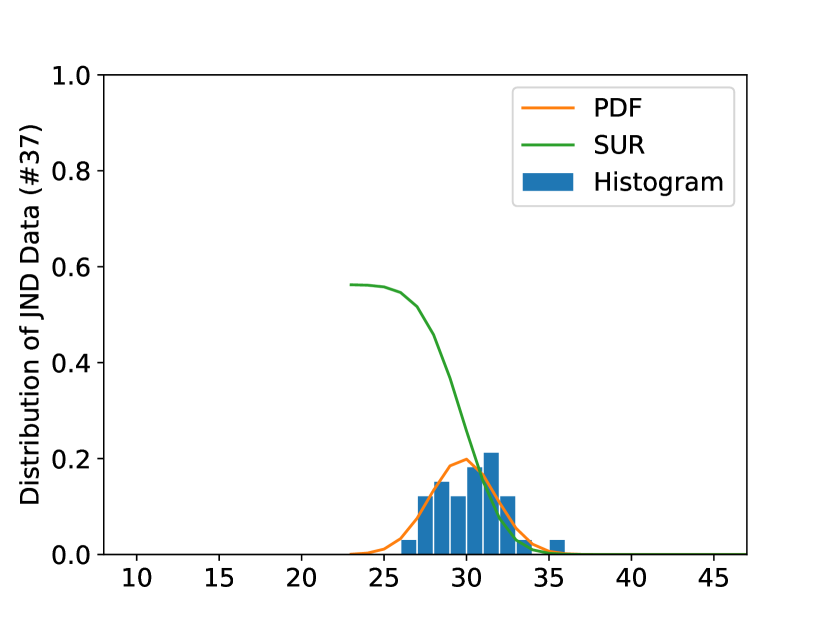
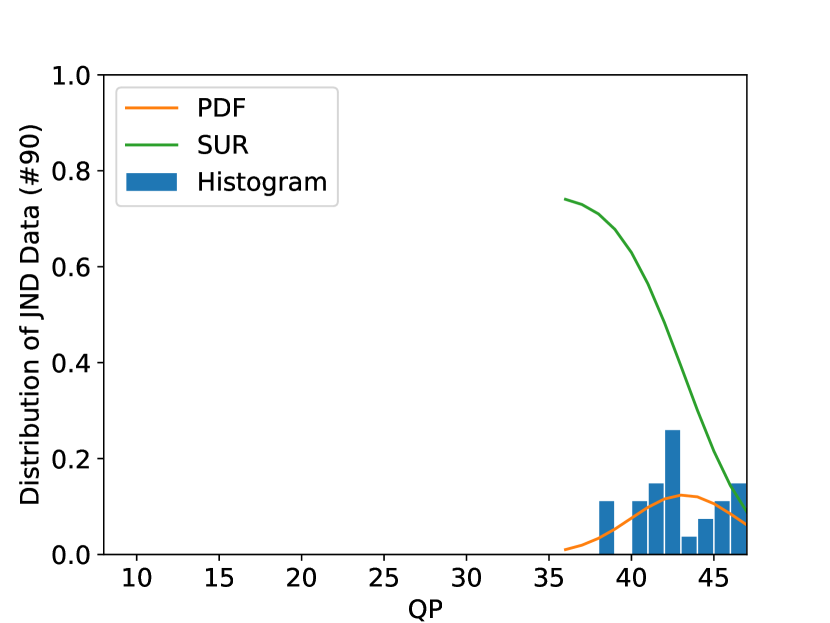
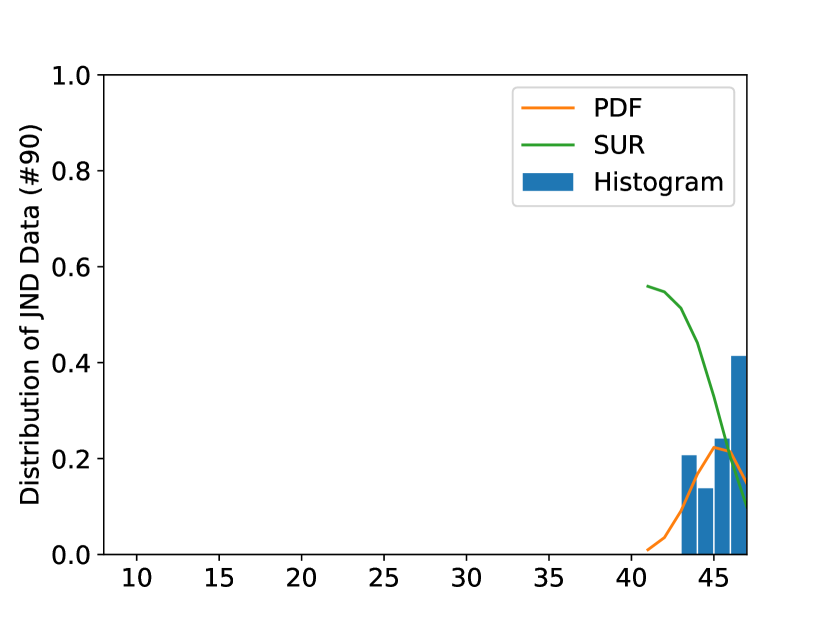
Fig. 1 gives representative thumbnails of two sequences, and their corresponding SUR curves for three JND points are illustrated in Fig. 2. Taking sequence (a) as an example to illustrate the modeling process of multiple JND points. The reference for the first JND is perceptually lossless coded clip and the location of the SUR point is . Then, we use as the reference for the second JND and get a bunch of JND samples as the histogram of the second JND point, each of which is the result of one test subject. The location of the SUR point for the 2nd JND is . Finally, the third JND location can be derived using as its reference for quality comparison.
III SUR Prediction for Multiple JND Points
| Models | Order | Reference | Samples | JND |
|---|---|---|---|---|
| 1st | ||||
| Subjective Test | 2nd | [+1, 51] | ||
| 3rd | [+1, 51] | |||
| 1st | ||||
| Setting 1 | 2nd | [+1, 51] | ||
| Ground truth reference | 3rd | [+1, 51] | ||
| Setting 2 | 2nd | [+1, 51] | ||
| Predicted reference | 3rd | [+1, 51] | ||
| Setting 3 | 2nd | |||
| Same reference | 3rd |
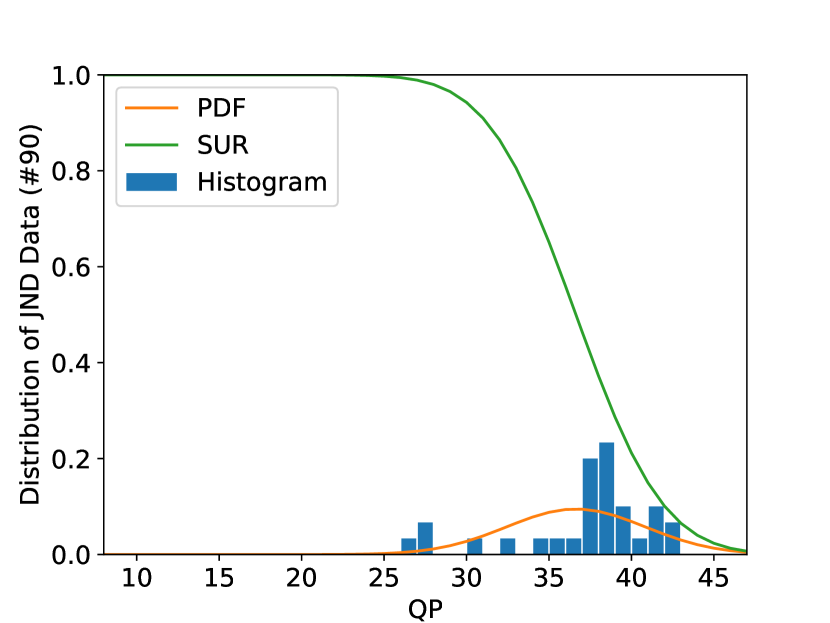
Apparently, the modeling JND/SUR curves exhibit differences in different video sequences due to unique characteristics of each source content. To predict the SUR curve, we mainly focus on the two factors in this work: 1) quality degradation due to compression, and 2) the masking effect due to source content characteristics. To shed light on the impact of the masking effect, we use sequences #37 (DinnerTable) and #90 (TodderFountain) as examples. Their representative frames are shown in Fig. 1 (a) and (b), and the histogram of their first JND locations are given in Fig. 2 (a) and (d), respectively. Sequence #37 is a scene captured around a dining table. It focuses on a male speaker with still dark background. The speaker’s face is the visual salient region that attracts people’s attention. The masking effect is weak and, as a result, the JND point arrives earlier (i.e. a smaller value in ). On the other hand, sequence #90 is a scene about a toddler playing in a fountain. The masking effect is strong due to water drops in background and fast object movement. As a result, compression artifacts are difficult to perceive and the JND point arrives later.
The masking effect has significant impacts on the second and the third JND. This phenomenon can be observed by comparing the second SUR curves between sequence #37 in Fig. 2 (b) and sequence #90 in Fig. 2 (e), where DinnerTable has much smaller JND points than that of TodderFountain. Indeed, even the collected third JND points of DinnerTable as shown in Fig. 2 (c) are smaller than that of the collected first JND points of ToddlerFountain as shown in Fig. 2 (d). Thus, we need to pay special attention to the masking effect when predicting the SUR curves.
A SUR prediction system was proposed in [12], which focuses on the first JND. Here, we extend the framework further to the second and third JND point prediction. We briefly review the prediction method in [12] for the purpose of completeness. The quality of Spatial-Temporal Segments is first evaluated by aggregating the similarity indices of local segments to form a compact global index for each segment by using the VMAF metric [14]. Then, significant segments are selected based on the slope of quality scores between neighboring coded clips. After that, we extract the masking effect that reflects the unique characteristics of each video clip, and use the support vector regression (SVR) to minimize the distance from the SUR curves, and derive the JND point accordingly.
Since the JND point is reference dependent, we need to pin down the reference clips in order to predict the second and the third JND points. We evaluate the proposed system on different settings as shown in Table II. There are three different settings based on the reference clips used to predict the second and the third JND.
-
•
Setting 1: ground truth references without calibration errors.
-
•
Setting 2: predicted references from the previous SUR curve. It is the practical scenario when no subjective data is available.
-
•
Setting 3: the same reference as the first JND point to verify the robustness of the proposed method to the reference in a practical prediction system.
IV Experimental Results
| 1080p | 720p | 540p | 360p | |
|---|---|---|---|---|
| SUR | 0.039 | 0.038 | 0.037 | 0.042 |
| QP | 1.218 | 1.273 | 1.345 | 1.605 |
In this section, we present the prediction results of the proposed SUR prediction method on the VideoSet. It consists of 220 videos in 4 resolutions and three JND points per resolution per video clip. Here, we focus on the SUR prediction of all the three JND points and conduct this task for each video resolution independently. For each prediction task, we train and test 220 video clips using the 5-fold validation. That is, we choose 80% (i.e. 176 video clips) as the training set and the remaining 20% (i.e., 44 video clips) as the testing set. Since the JND location is chosen to be the QP value when the SUR value is equal to 75% in the VideoSet, we adopt the same rule here so that the JND point can be easily computed from the predicted SUR curve.
The average prediction errors of the first SUR curve and the first JND position for video clips in four resolutions are summarized in Table III. Furthermore, Table IV and Table V show SUR and QP for the second and the third JND under different settings, respectively, where the SUR value is the sum of absolute area differences between the predicted SUR curve and the ground-truth SUR curve. We see that prediction errors increase as the resolution decreases for the first JND point. This is probably due to the use of fixed and values in generating spatial-temporal segments. The parameter influence on prediction accuracy will be further investigated in the future. Moreover, the results in Table V show that Setting 1 always achieves the best performance while Setting 3 gets the largest QP. However, we did not observe the same phenomena in SUR in Table IV. The reason is that the third JND point (predicted) is the point on the curve which makes the remaining QP range limited and SUR tends to be close to zero for large QP, e.g., .
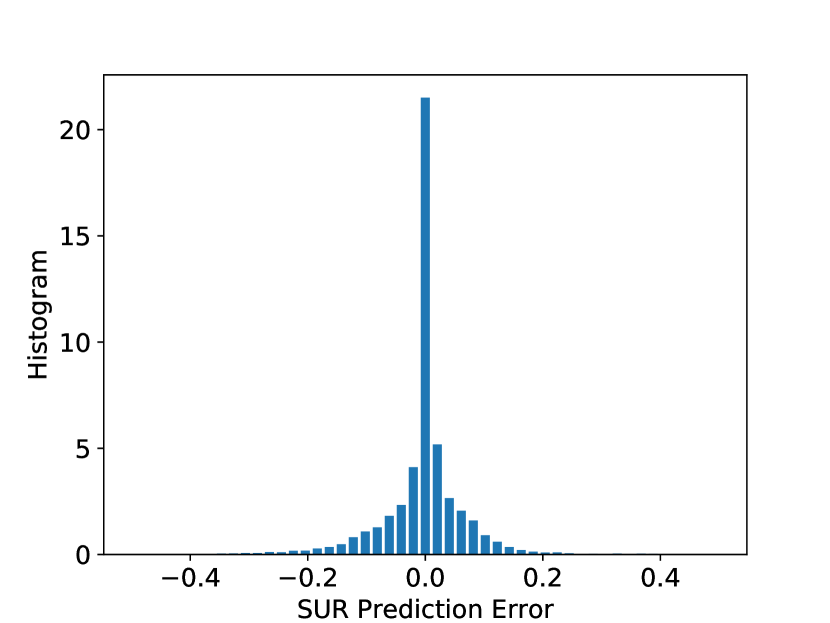
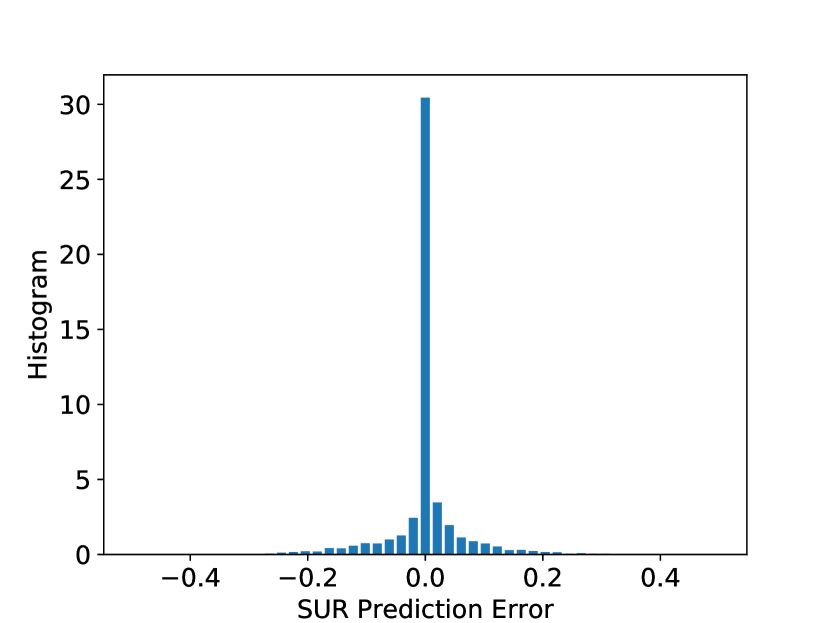
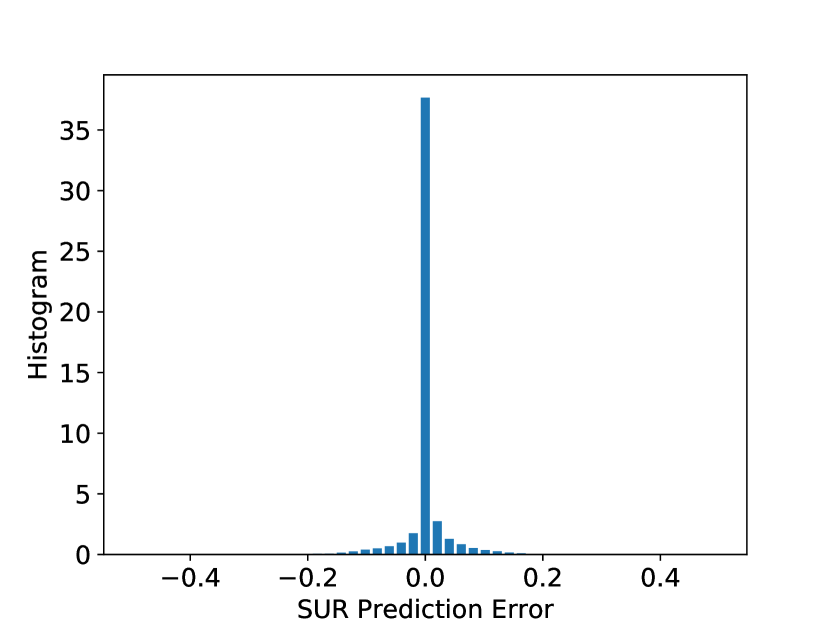
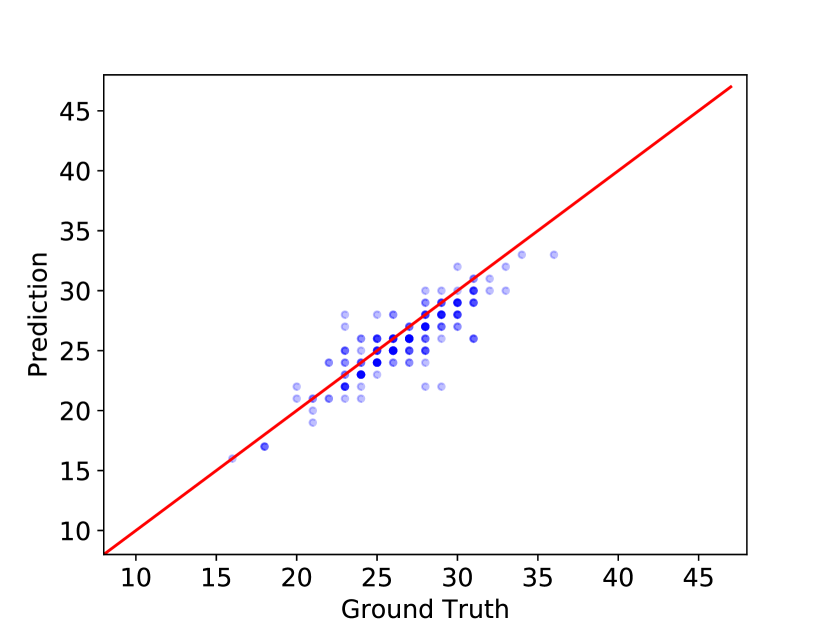
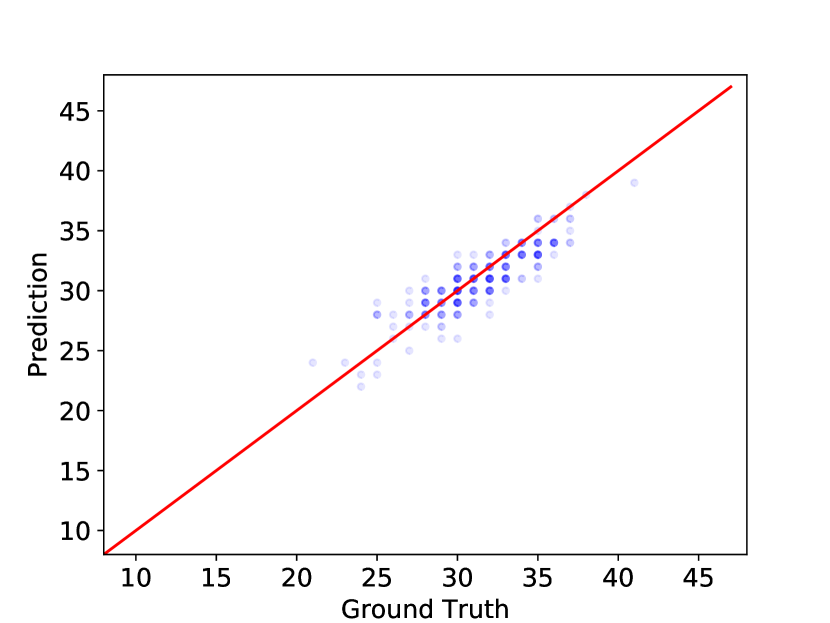
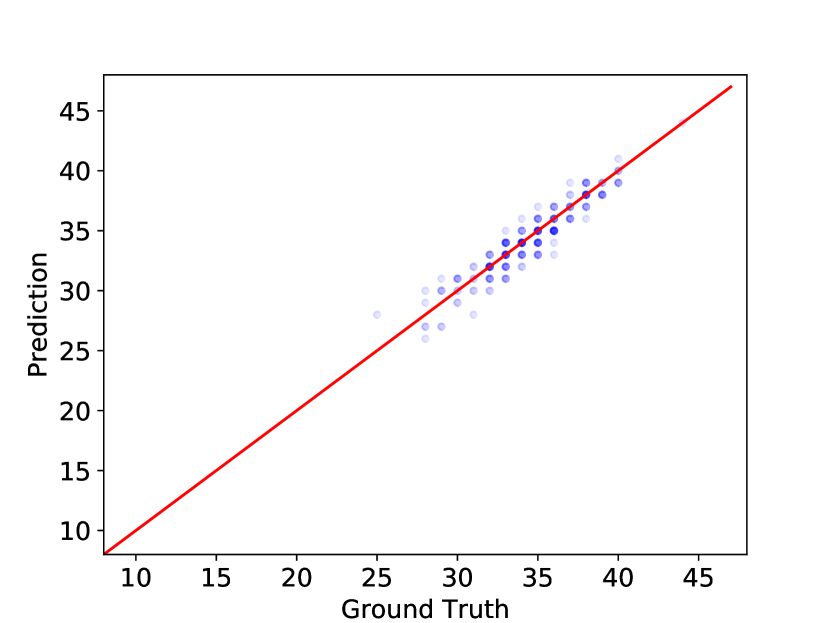
We use 720p video as an example to demonstrate the prediction performance of individual clips. The histograms of the SUR prediction errors are shown in Fig. 3 (a)-(c) for the first three SUR curves, where the mean absolute error (MAE) are 0.038, 0.054, and 0.032, respectively. The predicted JND locations versus the ground-truth JND locations are plotted in Fig. 3 (d)-(f), where each dot denotes one video clip. As shown in the figure, most dots are distributed along the 45-degree line, which indicates that the predicted JND is very close to the ground truth JND for most sequences.
| Setting 1 | Setting 2 | Setting 3 | ||||
|---|---|---|---|---|---|---|
| Resolution | 2nd | 3rd | 2nd | 3rd | 2nd | 3rd |
| 1080p | 0.062 | 0.029 | 0.063 | 0.065 | 0.057 | 0.056 |
| 720p | 0.054 | 0.032 | 0.057 | 0.060 | 0.055 | 0.056 |
| 540p | 0.050 | 0.030 | 0.054 | 0.052 | 0.046 | 0.049 |
| 360p | 0.052 | 0.030 | 0.058 | 0.056 | 0.048 | 0.053 |
| Setting 1 | Setting 2 | Setting 3 | ||||
|---|---|---|---|---|---|---|
| Resolution | 2nd | 3rd | 2nd | 3rd | 2nd | 3rd |
| 1080p | 1.618 | 0.709 | 2.009 | 2.245 | 2.364 | 2.445 |
| 720p | 1.227 | 0.750 | 1.709 | 1.927 | 2.209 | 2.227 |
| 540p | 1.223 | 0.773 | 1.523 | 1.700 | 1.873 | 2.009 |
| 360p | 1.341 | 0.745 | 1.750 | 1.836 | 1.923 | 2.105 |
V Conclusion and Future Work
A JND-based video quality model was proposed in this paper. The proposed video quality index, i.e. the SUR, seamlessly reflects the perceived quality of compressed video clips. We presented a SUR prediction framework for the first three JND points and the efficiency of the proposed SUR prediction method is verified on the VideoSet in different settings, especially for the second and the third JND points. The proposed method achieves good performance in all video sequences with different resolutions. In the future, we would like to investigate the influence of different parameters in the proposed method, e.g., the dimension of segment, percentage of key segments and other sophisticated spatial-temporal pooling method, to improve the performance of the JND point prediction.
References
- [1] I. SANDVINE, “Global internet phenomena report,” 2016.
- [2] Netflix, “Per-title encode optimization,” The Netflix Tech Blog, 2015.
- [3] Z. Wang, A. C. Bovik, H. R. Sheikh, and E. P. Simoncelli, “Image quality assessment: from error visibility to structural similarity,” IEEE Transactions on Image Processing, vol. 13, no. 4, pp. 600–612, 2004.
- [4] L. Zhang, L. Zhang, X. Mou, and D. Zhang, “Fsim: A feature similarity index for image quality assessment,” IEEE Transactions on Image Processing, vol. 20, no. 8, pp. 2378–2386, 2011.
- [5] S. Li, F. Zhang, L. Ma, and K. N. Ngan, “Image quality assessment by separately evaluating detail losses and additive impairments,” IEEE Transactions on Multimedia, vol. 13, no. 5, pp. 935–949, 2011.
- [6] J. Y. Lin, L. Jin, S. Hu, I. Katsavounidis, Z. Li, A. Aaron, and C.-C. J. Kuo, “Experimental design and analysis of JND test on coded image/video,” in SPIE Optical Engineering+ Applications. International Society for Optics and Photonics, 2015, pp. 95 990Z–95 990Z.
- [7] L. Jin, J. Y. Lin, S. Hu, H. Wang, P. Wang, I. Katsavounidis, A. Aaron, and C.-C. J. Kuo, “Statistical study on perceived JPEG image quality via MCL-JCI dataset construction and analysis,” Electronic Imaging, vol. 2016, no. 13, pp. 1–9, 2016.
- [8] H. Wang, W. Gan, S. Hu, J. Y. Lin, L. Jin, L. Song, P. Wang, I. Katsavounidis, A. Aaron, and C.-C. J. Kuo, “MCL-JCV: a JND-based H.264/AVC video quality assessment dataset,” in Image Processing (ICIP), 2016 IEEE International Conference on. IEEE, 2016, pp. 1509–1513.
- [9] H. Wang, I. Katsavounidis, J. Zhou, J. Park, S. Lei, X. Zhou, M.-O. Pun, X. Jin, R. Wang, X. Wang et al., “VideoSet: A large-scale compressed video quality dataset based on JND measurement,” Journal of Visual Communication and Image Representation, no. 46, pp. 292–302, 2017.
- [10] L. Aimar, L. Merritt, E. Petit, M. Chen, J. Clay, M. Rullgrd, C. Heine, and A. Izvorski, “X264-a free H.264/AVC encoder,” http://www.videolan.org/developers/x264.html, 2005, accessed: 04/01/07.
- [11] Q. Huang, H. Wang, S. C. Lim, H. Y. Kim, S. Y. Jeong, and C.-C. J. Kuo, “Measure and prediction of HEVC perceptually lossy/lossless boundary QP values,” in Data Compression Conference (DCC), 2017. IEEE, 2017, pp. 42–51.
- [12] H. Wang, I. Katsavounidis, Q. Huang, X. Zhou, and C.-C. J. Kuo, “Prediction of satisfied user ratio for compressed video,” arXiv preprint arXiv:1710.11090, 2017.
- [13] C. M. Jarque and A. K. Bera, “A test for normality of observations and regression residuals,” International Statistical Review/Revue Internationale de Statistique, pp. 163–172, 1987.
- [14] Z. Li, A. Aaron, I. Katsavounidis, A. Moorthy, and M. Manohara, “Toward a practical perceptual video quality metric,” The Netflix Tech Blog, vol. 6, 2016.