FOPI Collaboration
Wide acceptance measurement of the K ratio from Ni+Ni collisions at 1.91A GeV
Abstract
The FOPI Collaboration at the GSI SIS-18 synchrotron measured charged kaons from central and semi-central collisions of Ni+Ni at a beam energy of 1.91A GeV. We present the distribution of the K ratio on the energy vs polar angle plane in the nucleon-nucleon center-of-mass frame, with and without subtraction of the contribution of (1020) meson decays to the K- yield. The acceptance of the current experiment is substantially wider compared to the previous measurement of the same colliding system. The ratio of K- to K+ energy spectra is expected to be sensitive to the in-medium modifications of basic kaon properties like mass. Recent results obtained by the HADES Collaboration at 1.23A and 1.76A GeV indicate that after inclusion of the meson decay contribution to the K- production no difference between the slopes of the K- and K+ energy spectra is observed within uncertainties. For our data a linear fit to this ratio obtained after subtraction of the meson contribution still shows a decrease with kinetic energy, although a constant value cannot be rejected. The contribution of decays estimated from fitting the thermal model to the experimental yields appears to be another factor of moderate relevance.
pacs:
25.75.Dw, 13.60.LeI Introduction
Modifications of the basic properties of kaons (like mass or decay constant) inside a hot and dense nuclear medium have been the subject of intensive study and debate throughout the last 30 years Kapl86 ; Brow91 ; Weis96 ; Scha97 ; Cass97 ; Ramo00 ; Tolo02 ; Lutz04 ; Fuch06 ; Hart12 . It is predicted that under such conditions the system should tend toward the partial restoration of chiral symmetry.
In the earlier approaches these modifications were parameterized in terms of the kaon-nucleus potential and the effective mass Weis96 ; Scha97 ; Cass97 ; Fuch06 ; Hart12 . While there are no universal definitions of these quantities, in this paper we follow a practical approach, where is the energy of a particle at rest in nuclear matter at normal density and is the difference between and mass in vacuum (). Calculations predicted that the potential for a kaon should be positive and that for an antikaon negative. Within the latter approaches it is still predicted that kaons (K+ and K0) remain “good” quasiparticles with narrow width. However, the antikaons (K- and ) exhibit a non-trivial structure of self-energy, and the potential should be only approximately understood as the average of this structure Ramo00 ; Tolo02 ; Lutz04 . In particular, the most probable K- production channel around threshold is N, where Y denotes the hyperon ( or ). This channel is predicted to have an intermediate step in medium involving or , where the production of the latter particle under these conditions was experimentally confirmed Lope07 .
If nuclei are collided at beam energies around the thresholds for the production of the respective K mesons in a nucleon-nucleon (NN) collision (about 1.6 GeV for K+ and 2.5 GeV for K-), the probability of producing a kaon per event is around 1% Fors07 . Thus, events with open-strangeness production usually contain only one kaon, which can be used as a probe of the dynamics in the nuclear medium. These collisions have been intensively studied in particular at the SIS-18 accelerator, delivering heavy-ion beams up to an energy of 2A GeV.
When the kaon leaves the hot and condensed collision zone, where it was produced, its effective mass must return to the vacuum value. As the simplest energy reservoir is the kinetic energy, it is predicted that K+ leaving the centers of density should accelerate, and K- should decelerate. Thus, the ratio of K as a function of kinetic energy is expected to become steeper if the in-medium effects occur as predicted. Also, the attraction toward centers of density should cause K- to exhibit a flow pattern similar to that of protons, whereas for K+ the effect is predicted to be opposite Liko95 .
However, in course of the propagation of kaons in the heavy-ion collision zone, the effects of modifications of basic kaon properties compete with other phenomena like absorption (affecting mainly K- via KY) or rescattering from surrounding nucleons. In addition, the K- spectra are fed by the dominant (1020) meson decay channel, (BR = 48.9% PDG ), as the threshold for production is very close to that for the K+K- pair.
A search for in-medium effects in the flow pattern was recently reported Ziny14 . A comparison of the rapidity dependence of the coefficient of charged kaons emitted from Ni+Ni collisions at 1.9A GeV to the predictions of the IQMD and HSD transport models IQMD ; HSD pointed to rather small values of , between 0 and 20 MeV. For K- the IQMD prediction with MeV reproduced the pattern, whereas the HSD calculations employing the G-Matrix formalism corresponding to MeV overestimated the experimental values. Concerning the comparison of the transverse momentum dependence of for K+, the transport model predictions again pointed to values between 0 and 20 MeV, although none of these models reproduced the trend of the data points in full.
Studies of in-medium effects via the experimentally measured K ratio were presented in Laue00 ; Wisn00 ; Gasi16 . Whereas these analyses demonstrated the sensitivity of this observable to in-medium effects, they were hampered either by low statistics, lack of (or insufficient) inclusion of the (1020) meson decay feeding, or very narrow acceptance. A comparison of four data points for the energy dependence of the K ratio from Al+Al collisions at 1.9A GeV to the HSD transport model calculations with U MeV and U MeV Gasi16 initially appeared to reproduce the data successfully. However, they did not account for the feeding from mesons. The available samples of in its dominant decay channel, (BR = 48.9% PDG ), were quite scarce (100-170 events Agak09 ; Pias15 ; Gasi16 ; Pias16 ). Despite this, the contribution of their decays to the K- spectra was found significantly to reduce the slope of the energy spectrum Lore10 ; Pias15 ; Gasi16 ; Adam18 and therefore compete with the effect of the attractive N potential. After correcting for the meson contribution to the K- spectra, the HSD prediction with non-vanishing KN potentials seemed to overestimate the data.
On the other hand, one may put forward the hypothesis, that the difference between the slopes of the energy distributions of K- and K+ mesons can be fully explained by feeding of meson decays to the K- meson distribution. This approach was considered by the HADES Collaboration for Ar+KCl at 1.76A GeV Lore10 and for Au+Au at 1.23A GeV Adam18 , and was found to be consistent with the experimental data within errors.
The distributions of the kaon polar angle, the second phase space dimension, were often found to deviate from isotropy Fors07 ; Gasi16 . For most of the investigated systems the anisotropy coefficients for K+ and K- were found to be equal within 3 standard deviations. However, globally the values of for K+ appear to be somewhat larger than those for K-. Thus, in the phase space distribution of the K ratio, the anisotropy effects for K+ and K- may not cancel out. Additionally, analysis of the polar distribution within the IQMD transport model showed that the degree of anisotropy should be sensitive to both the potential and rescattering effects Hart12 . Thus, a measurement of this ratio not only as a function of energy but also of polar angle could deliver a more precise probe of these phenomena. It should also be supplemented by a measurement of the contribution of (1020) mesons to the K- spectrum obtained for the same reaction.
The FOPI collaboration has addressed this goal, in particular benefitting from the MMRPC detector, a Time-of-Flight device characterized by high granularity and excellent timing properties Kis11 . In this paper we present the kinematic distributions and production ratio of charged kaons emitted from central and semi-central Ni+Ni collisions at a beam kinetic energy of 1.91A GeV (the same experiment as for the K± flow study Ziny14 and meson analysis in Pias15 ). The advantages of this data sample with respect to earlier analyses of the K ratio are the considerably wider acceptance and the additional experimental information on the meson production.
II Experiment
A detailed description of the FOPI spectrometer was given in FOPI , and the experiment was reported in Ziny14 ; Pias15 . Here we highlight only those features most relevant to the present analysis.
The innermost detector of the FOPI apparatus is the Central Drift Chamber (CDC) covering the polar angles () 111The angles are given with respect to the target position. It is encircled by two time-of-flight (ToF) devices, the Plastic Scintillation Barrel (PSB), spanning , and the Multi-strip Multi-gap Resistive Plate Counter Kis11 (MMRPC), mounted at . This setup is surrounded by a magnet generating a solenoidal field of B = 0.617 T. The forward polar angles, , are covered by the Plastic Wall (PlaWa) detector.
A 58Ni beam with a kinetic energy of 1.91A GeV was incident on a 58Ni target of 1% interaction probability. The medium-bias trigger required the minimum multiplicity of charged hits in the PlaWa (PSB) to be 5 ( 1). This allowed us to select the sample of central and semi-central collisions corresponding to of the total geometrical cross section. Within these conditions events were collected. Assuming the sharp cut-off approach and the geometrical model, the average number of participant nucleons was estimated to be (c.f. Appendix A of Pias16 ).
III Phase Space Distributions
III.1 Raw kaon spectra
The particle identification methods used in our experiment were described in Refs. Ziny14 ; Pias15 . Here only the key points are highlighted. For each event the tracks of particles traversing the CDC are reconstructed from the activated wires (“hits”). A reconstruction of the vertex position allows us to reject reactions occurring outside the target. In the next step, “good track candidates” are selected by requiring a minimum multiplicity of hits in a track and a maximum distance between the track and the vertex. Fitting a helical curve to the series of hits marked by a particle in a solenoidal magnetic field allows us to obtain the momentum vector . The amplitude of the signals from activated wires is used to measure the specific energy loss. Correlating these two observables allows us to identify many of the charged emission products and extract the CDC-based mass parameter, . This procedure is, however, insufficient for most of the investigated K± mesons. Additional information is obtained from either of the two installed ToF devices: PSB and MMRPC. A combination of time of flight and path length allows us to obtain the velocity of the particle emitted from the target. A histogram of identified tracks on the plane is shown in Fig. 1 of Ref. Pias15 . Substituting and into the relativistic dependency , where is the Lorentz factor, allows us to extract the particle mass parameter, . The distributions of , shown for the same data in Fig. 1c,d of Ref. Ziny14 , clearly exhibit a peak around the nominal mass of charged kaon.
To minimize edge effects, the range of accepted polar angles was trimmed down to . In addition, to account for the limits of detection of low-p particles by the CDC-ToF pair of detectors and some slight inconsistency in the reproduction of the detection capability within the GEANT3 GEANT environment in this region, the K+ (K-) candidates were required to have a transverse momentum of at least 0.18 (0.14) GeV/.
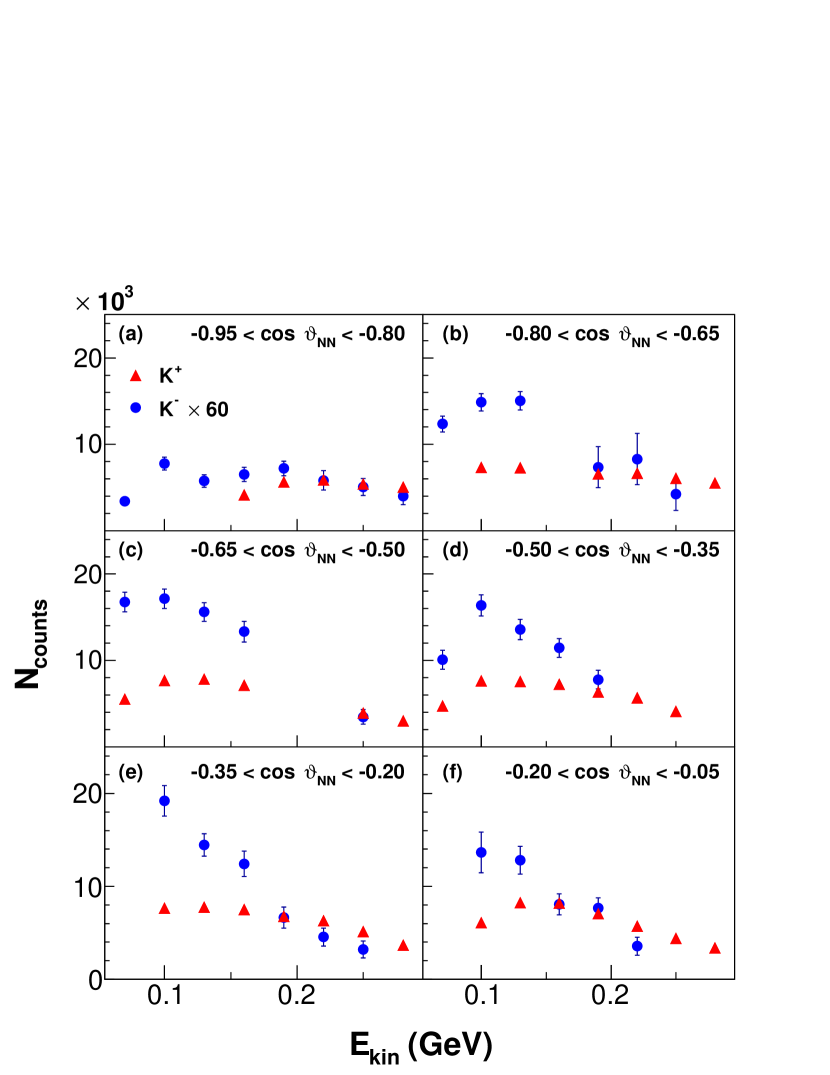
The raw spectrum of measured kaons, shown in Fig. 1, was obtained with 232300 measured K+ and 5660 K- mesons. A common multiplicative factor of 60 was applied to the K- data points in order to present both profiles on one plot.
III.2 Efficiency determination
The efficiency correction for charged kaons on the plane was obtained in two stages: via GEANT3-based simulations and an additional procedure intended to extract and apply the internal efficiency of the ToF detectors.
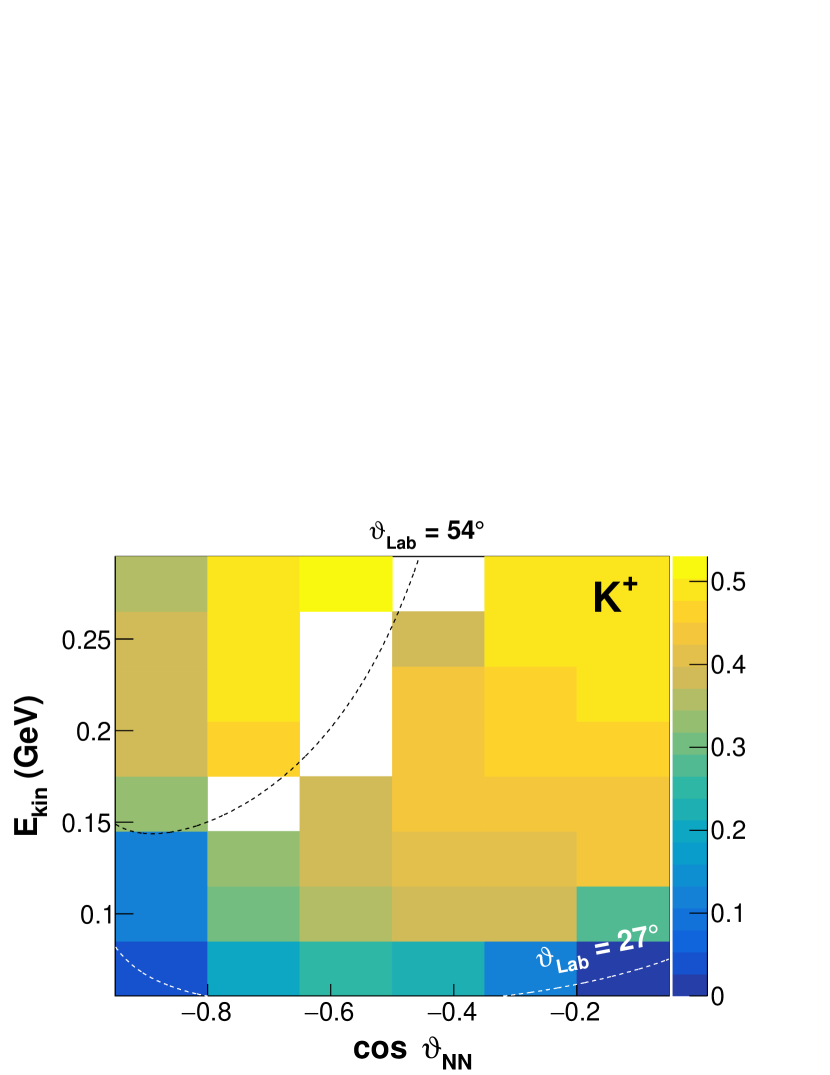
In the first stage kaons were sampled from the homogeneous distribution on this plane. They were subsequently added to the events of Ni+Ni collisions generated within the IQMD transport code IQMD , which aims to reproduce the realistic background of particles emitted from the heavy-ion collisions. Within the GEANT3 environment particles were transported to the detection modules of the virtual FOPI setup. The hadronic interactions of kaons with the traversed medium were switched on. After the detector responses were simulated, the events were processed by the same tracking and matching routines as for the true experimental data. The resulting efficiency maps are shown in Fig. 2. The elongated drop of efficiency toward lower kinetic energy and is due to the decay of kaons in flight.
However, the digitization routines of the GEANT3 package did not account for the intrinsic efficiency of the ToF devices. A determination of this efficiency was made by a dedicated procedure, described in Sect. IV B of Ref. Pias15 , where the maps are shown in the lower panels of Fig. 3. This efficiency component was included by weighting the experimental kaon signal with the appropriate factors.
IV Results
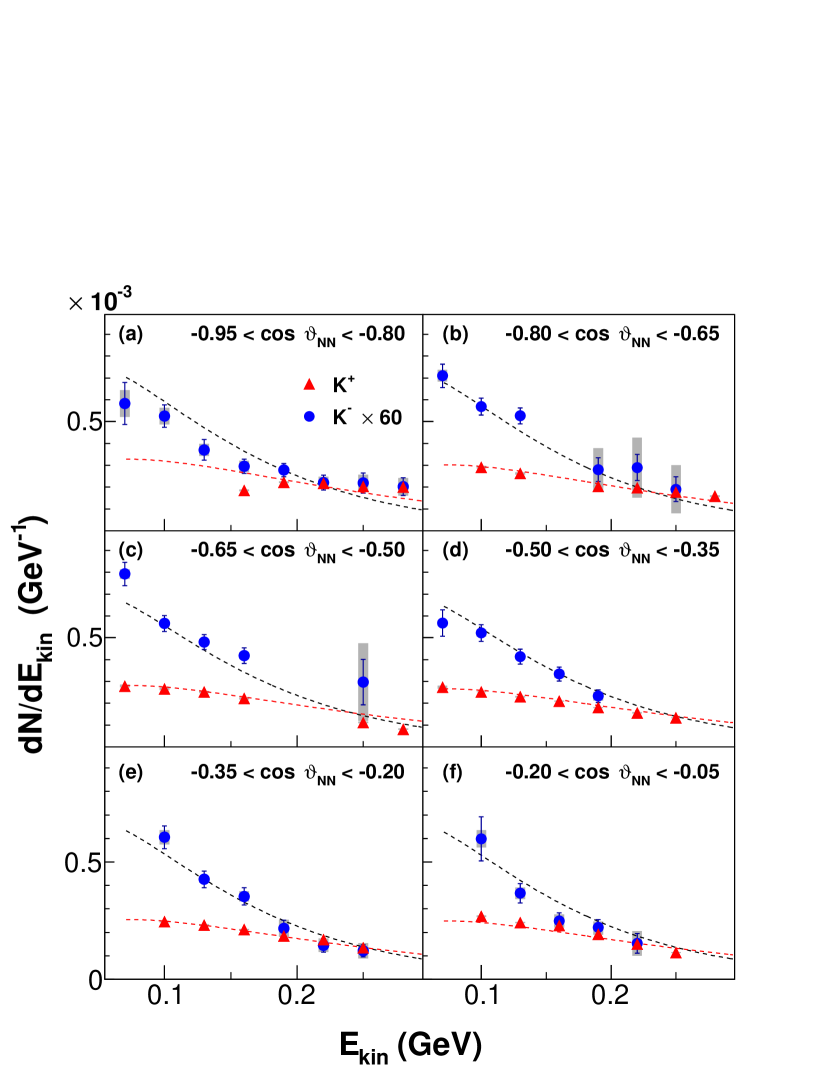
The distributions of charged kaons on the - plane are shown in Fig. 3 (note the factor of 60 multiplying the K-, as mentioned in Sect. III). The same binning was used as for Fig. 1. The K- kinetic energy spectra appear to be softer than those of K+. This finding is very common for charged kaons emitted from heavy-ion collisions at similar energies Fors07 . The distribution of the K ratio obtained is presented in Fig. 4.
The leading contributions to the systematic errors were found to be:
-
•
sensitivity to the selection of the minimum number of CDC hits forming a “good track”,
-
•
choice of the background function (linear or exponential) under the kaon peak in the mass spectrum,
-
•
minimum cutoff value of the parameter in the case of tracks matched with Plastic Barrel hits,
-
•
binning of the spectrum of .
By varying these conditions, slightly different values for the distributions of the K+ and K- yields and the K ratio were obtained. In this way for each i-th point on the plane a distribution of values of an investigated quantity was generated. The final result for each i-th point was determined by averaging the values of . This approach also allowed us to select the confidence level (CL) at which the systematic errors were estimated. In this analysis we chose CL = 68.3% (corresponding to 1 of the Gaussian distribution), based directly on the distributions . It should be noted, that this procedure was applied independently for the kaon yields and the K ratio.
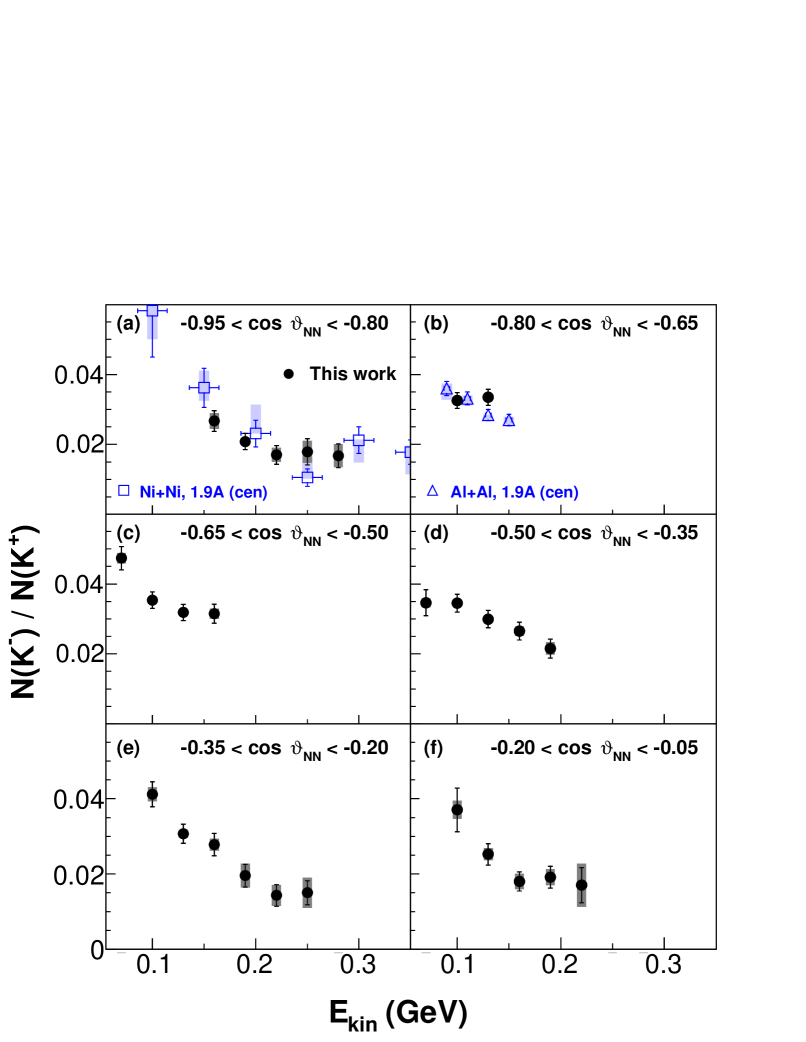
Previously, two kinetic energy distributions of the K ratio were measured at 1.9A GeV within narrow ranges. The distribution for the previous experiment with Ni+Ni with a slightly different FOPI setup and ToF detectors was measured within Wisn00 , and is shown in panel (a) of Fig. 4. The data from Al+Al collisions, obtained within Gasi16 , are also plotted placed in panel (b). We find our data consistent with the previously obtained results, but covering a much broader acceptance. The complete data set for the phase space distributions of the charged kaons and the K ratio is listed in Table A.1 in Appendix A.

V Discussion
V.1 Phase space analysis of charged kaons
The efficiency-corrected phase space distribution of K± mesons, reported in Sect. IV was fitted with the following ansatz,
| (1) | ||||
which consists of the Boltzmann-like kinetic term parameterized by the effective temperature , multiplied by the angular anisotropy term, where is the polar anisotropy coefficient. is the yield of emitted kaons per triggered collision, and is the normalization constant, defined so that the integral of Eq. 1 yields . Since the energy and polar angle are not correlated in this formula, the fit to the data shown in Fig. 3 also allows us to extract directly, with an uncertainty free from correlation terms. The results of this procedure, shown in Table V.1, confirm that the inverse slope of the energy spectrum of K- is smaller than that of K+. Despite the fact that the parameterization of the distribution by Eq. 1 is not the same as that of Eq. 3 in Ref. Pias15 applied to the same K- data, the slope obtained here is in agreement with the profile of slopes shown in Fig. 6 of that paper. It also agrees within 2 with the slope obtained by the KaoS Collaboration for the inclusive reactions Fors07 . Concerning the coefficients, they appear to be somewhat smaller than the values for inclusive Ni+Ni collision, obtained by KaoS (c.f. Table II of Ref. Fors07 ), however, the minimum bias triggers were not defined identically. It also has to be noted that the value for our fit to the K+ distribution is considerably higher. Turning to the yields obtained with Eq. 1, the result for K- agrees well with that presented in Pias15 and obtained with a different model. The novelty is the yield for K+, obtained for the first time for this colliding system and centrality. Due to the similarity of to the data from Al+Al collisions at the same beam energy ( for Ni+Ni vs 42.5 for Al+Al Gasi16 ; Pias16 ), these data sets may be juxtaposed. Despite somewhat different acceptances and spectator sizes, all the parameters obtained in our procedure are in good agreement with those shown in Tab. 2 of Ref. Gasi16 , if the systematic errors are included.
The ratio of kaon yields was extracted from the above fit results, and was found to be:
| (2) |
This value is in good agreement with the result obtained by the KaoS collaboration Menz00 , measured within a narrower and more forward-shifted acceptance. Our result is obtained within a wider acceptance and at higher precision.
| Particle | (mul. per triggered event) | [MeV] | ||||
|---|---|---|---|---|---|---|
| K+ | 36.2 | |||||
| K- | 2.5 |
V.2 Subtraction of the meson contribution from the K- spectra
For the analysed experiment mesons were found to be produced with a yield comparable to that of K-: Pias15 . Assuming that the vacuum value of PDG remains the same for mesons produced in the collision zone of heavy ions, this means that about 22% of negative kaons originate from decays of . The kinematic properties of these K- mesons are different to these for K-s emitted directly from the collision zone. Also, some transport models aiming at extraction of kaon in-medium effects may not reproduce the meson contribution well. Therefore, it might be of interest to obtain the ratio of charged kaon yields unaffected by the contribution from mesons. This procedure was performed as for the case of Al+Al collisions at 1.9A GeV, described in Sect. 6.2 of Ref. Gasi16 . In brief, the mesons were sampled within the PLUTO package PLUTO from the isotropic thermal distribution characterized by a temperature of MeV, as reported in Pias15 . They decayed into K+K- pairs, from which the phase space distribution of negative kaons was obtained. This was subsequently subtracted from the experimental spectrum, shown in Fig. 3, with values of BR and as described earlier. The resulting distribution of the ratio of yields of charged kaons without the meson contribution is presented in the right-hand panels of Fig. 4. Within the subtraction procedure the statistical and systematic uncertainties of the meson yield and temperature were accounted for. In order to check whether the obtained distribution of the ratio of yields exhibits some drop with kinetic energy it was fitted with: (a) constant and (b) linear functions of this quantity. The fit was applied globally to all the points. For scenario (a) was found to be (syst). For the linear approach (b) the slope was found to be , at (syst). The contributions to the systematic errors comprised all the factors specifed in case of the evaluation of the K ratio, and the systematic uncertainties associated with the yield and inverse slope of the meson emission. Although the average value of is better for the linear scenario, the assumption of a constant ratio cannot be rejected based on the current data.
V.3 contribution
Recently, it has been conjectured Lore17 that the relevant contribution to the K- spectrum at SIS18 energies might be the decays (BR = 22.5% PDG ). A contribution from this channel has not yet been analysed by FOPI, but it can be estimated with the help of the Statistical Hadronization Model (SHM) Andr10 ; Beca01 . Six ratios of particle production yields have been selected (c.f. Table V.2) taking care that they were obtained at the same centrality as the data presented in this paper. A least-squares fit of the SHM to these ratios and the value was performed using the THERMUS code THERMUS . Particles with non-zero strangess were treated within the canonical ensemble, and the grand canonical approach was applied to the other hadrons. To stabilize the procedure the volume was fixed by an arbitrary value of the radius (3 fm), whereas the canonical radius was subject to free fitting. The algorithm resulted in the following values of the parameters: temperature MeV, baryo-chemical potential MeV, and fm, found at . As the procedure aimed only at estimating the yield, the systematic errors were not investigated. Our result is compatible at the 1 level with the values obtained for Ar+KCl at 1.76A GeV Agak11 . However, both these results are slightly above the general trend of the data observed in Fig. 7 of Ref. Agak11 .
Within this calculation the ratio of yields was found to be 0.46, which translates into a 10% contribution of decays to the spectrum of negative kaons. Comparing with the 22% contribution from meson decays, one may conclude that the channel may have moderate relevance. An experimental investigation of this channel is advisable.
| Quantity | Value | Reference | ||
|---|---|---|---|---|
| K | This work | |||
| K | This work, Pelt97 | |||
| 1.00 0.08 | Pelt97 | |||
| K | 0.78 0.18 | Mers07 | ||
| Mers07 ; Pelt97 | ||||
| 0.44 0.15 | Pias15 |
VI Summary
We have presented the phase space distributions of K+ and K- mesons as well as of the K ratio from the central and semi-central collisions of Ni+Ni at the a energy of 1.91A GeV, measured within wide acceptance by the FOPI apparatus. An overall value of this ratio was found to be: .
The data are tabulated for convenient comparison with the predictions of transport models, with the hope of a more precise extraction of the parameters quantifying the in-medium modification of the properties of charged kaons.
Benefitting from the meson data measured in the same experiment, we also present the distribution of the K ratio obtained after subtraction of the contribution of decays to the K- spectra.
The corrected K ratio seems to decrease with kinetic energy, confirmed by the low value of the fit. However, due to the precision of the results obtained, the hypothesis of a constant ratio cannot be rejected. Using the measured particle ratios, we applied the Statistic Hadronization Model to estimate the contribution of decays to the K- spectra. It was found to be 10%, which suggests that an experimental investigation of production may be relevant for the subsequent reduction of anti-kaon yields not originating from the hot and dense collision zone.
In addition, an analysis of the phase space distributions of K± mesons provided the multiplicities, inverse slopes and polar anisotropy coefficients. The inverse slope for K- was found to be clearly lower than that for K+. With the exception of the coefficient for K+, the presented results are in line with previously published data.
Acknowledgements.
This work was supported by the German BMBF Contract No. 05P12VHFC7, the National Research Foundation of Korea (NRF) under grant No. 2018R1A5A1025563, the German BMBF Contract No. 05P12RFFCQ, the Polish Ministry of Science and Higher Education (DFG/34/2007), the agreement between GSI and IN2P3/CEA, the HIC for FAIR, the Hungarian OTKA Grant No. 71989, NSFC (Project No. 11079025), DAAD (PPP D/03/44611), DFG (Project 446-KOR-113/76/04) and the EU, 7th Framework Program, Integrated Infrastructure: Strongly Interacting Matter (Hadron Physics), Contract No. RII3-CT-2004-506078.Appendix A Experimental data points
| P(K+) | P(K-) | P(K-) P(K+) | P(K) P(K+) | |
| -0.95 -0.8 | ||||
| 0.07 | 9.71 1.60 1.01 | |||
| 0.10 | 8.76 0.85 0.62 | |||
| 0.13 | 6.17 0.79 0.45 | |||
| 0.16 | 1.85 0.04 0.03 | 4.92 0.54 0.40 | 2.67 0.30 0.22 | 2.00 0.32 0.28 |
| 0.19 | 2.22 0.04 0.03 | 4.63 0.51 0.19 | 2.08 0.23 0.10 | 1.69 0.25 0.14 |
| 0.22 | 2.17 0.04 0.04 | 3.69 0.57 0.42 | 1.70 0.27 0.20 | 1.41 0.28 0.21 |
| 0.25 | 2.04 0.04 0.02 | 3.64 0.76 0.63 | 1.79 0.37 0.31 | 1.57 0.33 0.31 |
| 0.28 | 2.00 0.04 0.01 | 3.36 0.68 0.66 | 1.68 0.34 0.32 | 1.53 0.34 0.33 |
| -0.80 -0.65 | ||||
| 0.07 | 11.84 0.90 0.44 | |||
| 0.10 | 2.91 0.04 0.06 | 9.48 0.65 0.20 | 3.26 0.23 0.10 | 2.46 0.26 0.21 |
| 0.13 | 2.62 0.03 0.05 | 8.78 0.60 0.14 | 3.35 0.23 0.08 | 2.70 0.25 0.17 |
| 0.16 | ||||
| 0.19 | 2.04 0.03 0.03 | 4.66 0.90 1.65 | ||
| 0.22 | 1.98 0.03 0.03 | 4.83 1.00 2.28 | ||
| 0.25 | 1.78 0.04 0.03 | 3.18 0.95 1.83 | ||
| 0.28 | 1.59 0.04 0.04 | |||
| -0.65 -0.50 | ||||
| 0.07 | 2.79 0.04 0.06 | 13.20 0.91 0.34 | 4.74 0.33 0.15 | 3.67 0.37 0.30 |
| 0.10 | 2.66 0.03 0.05 | 9.42 0.62 0.13 | 3.54 0.24 0.06 | 2.67 0.27 0.22 |
| 0.13 | 2.51 0.03 0.04 | 8.01 0.57 0.21 | 3.19 0.23 0.06 | 2.49 0.26 0.18 |
| 0.16 | 2.21 0.03 0.04 | 6.97 0.59 0.27 | 3.15 0.27 0.14 | 2.58 0.29 0.20 |
| 0.19 | ||||
| 0.22 | ||||
| 0.25 | 1.11 0.04 0.03 | 4.95 1.74 2.95 | ||
| 0.28 | 0.81 0.03 0.02 | |||
| -0.50 -0.35 | ||||
| 0.07 | 2.73 0.04 0.06 | 9.45 1.00 0.22 | 3.46 0.37 0.13 | 2.38 0.41 0.29 |
| 0.10 | 2.52 0.03 0.01 | 8.69 0.63 0.27 | 3.45 0.25 0.11 | 2.54 0.29 0.24 |
| 0.13 | 2.30 0.03 0.03 | 6.88 0.57 0.18 | 2.99 0.25 0.08 | 2.25 0.28 0.20 |
| 0.16 | 2.10 0.03 0.02 | 5.56 0.52 0.27 | 2.65 0.25 0.13 | 2.05 0.28 0.20 |
| 0.19 | 1.80 0.03 0.02 | 3.88 0.49 0.33 | 2.16 0.27 0.18 | 1.66 0.30 0.22 |
| 0.22 | 1.56 0.02 0.02 | |||
| 0.25 | 1.33 0.03 0.02 | |||
| -0.35 -0.20 | ||||
| 0.07 | ||||
| 0.10 | 2.45 0.03 0.02 | 10.09 0.81 0.50 | 4.12 0.33 0.19 | 3.18 0.36 0.29 |
| 0.13 | 2.31 0.03 0.02 | 7.09 0.58 0.23 | 3.07 0.26 0.10 | 2.32 0.28 0.21 |
| 0.16 | 2.12 0.03 0.02 | 5.88 0.62 0.34 | 2.78 0.30 0.16 | 2.18 0.32 0.22 |
| 0.19 | 1.85 0.03 0.02 | 3.62 0.56 0.59 | 1.96 0.30 0.31 | 1.47 0.33 0.34 |
| 0.22 | 1.68 0.03 0.02 | 2.41 0.48 0.48 | 1.43 0.28 0.28 | 1.05 0.31 0.29 |
| 0.25 | 1.34 0.03 0.01 | 2.01 0.43 0.53 | 1.50 0.32 0.39 | 1.17 0.34 0.40 |
| -0.20 -0.05 | ||||
| 0.07 | ||||
| 0.10 | 2.69 0.04 0.03 | 9.96 1.56 0.61 | 3.71 0.58 0.24 | 2.85 0.60 0.31 |
| 0.13 | 2.42 0.03 0.02 | 6.10 0.68 0.40 | 2.53 0.28 0.16 | 1.81 0.30 0.23 |
| 0.16 | 2.30 0.03 0.02 | 4.14 0.58 0.46 | 1.80 0.25 0.20 | 1.26 0.28 0.24 |
| 0.19 | 1.93 0.03 0.02 | 3.69 0.55 0.41 | 1.92 0.29 0.21 | 1.45 0.30 0.24 |
| 0.22 | 1.50 0.03 0.01 | 2.55 0.70 0.86 | 1.70 0.47 0.57 | 1.28 0.49 0.58 |
| 0.25 | 1.14 0.02 0.01 |
References
- (1) D.B. Kaplan and A.E. Nelson, Phys. Lett. B 175, 57 (1986); A.E. Nelson and D.B. Kaplan, Phys. Lett. B 192, 193 (1987).
- (2) G.E. Brown and M. Rho, Phys. Rev. Lett. 66, 2720 (1991).
- (3) W. Weise, Nucl. Phys. A 610, 35c (1996).
- (4) J. Schaffner-Bielich, I.N. Mishustin, J. Bondorf, Nucl. Phys. A 625, 325 (1997).
- (5) W. Cassing, E.L. Bratkovskaya, U. Mosel, S. Teis, A. Sibirtsev, Nucl. Phys. A 614, 415 (1997).
- (6) A. Ramos, E. Oset, Nucl. Phys. A 671, 481 (2000).
- (7) C. Fuchs, Prog. Part. Nucl. Phys. 56, 1 (2006).
- (8) L. Tolós, A. Ramos, A. Polls, Phys. Rev. C 65, 054907 (2002).
- (9) M.F.M. Lutz, Prog. Part. Nucl. Phys. 53, 125 (2004).
- (10) C. Hartnack et al., Phys. Rep. 510, 119 (2012).
- (11) M. Tanabashi et al. (Particle Data Group), Phys. Rev. D 98, 030001 (2018).
- (12) X. Lopez et al. (FOPI Collaboration), Phys. Rev. C 76, 052203(R) (2007).
- (13) A. Förster et al. (KaoS Collaboration), Phys. Rev. C 75, 024906 (2007).
- (14) G.Q. Li, C.M. Ko, and Bao-An Li, Phys. Rev. Lett. 74, 235 (1995).
- (15) V. Zinyuk et al. (FOPI Collaboration), Phys. Rev. C 90, 025210 (2014).
- (16) C. Hartnack et al., Eur. Phys. J. A 1, 151 (1998).
- (17) W. Cassing et al., Phys. Rep. 308, 65 (1999).
- (18) F. Laue et al. (KaoS Collaboration), Eur. Phys. J. A 9, 397 (2000).
- (19) K. Wiśniewski et al. (FOPI Collaboration), Eur. Phys. J. A 9, 515 (2000).
- (20) P. Gasik et al. (FOPI Collaboration), Eur. Phys. J. A 52, 177 (2016).
- (21) G. Agakishiev et al. (HADES Collaboration), Phys. Rev. C 80, 025209 (2009).
- (22) K. Piasecki et al. (FOPI Collaboration), Phys. Rev. C 91, 054904 (2015).
- (23) K. Piasecki et al. (FOPI Collaboration), Phys. Rev. C 94, 014901 (2016).
- (24) M. Lorenz (HADES Collaboration), PoS (BORMIO2010) 038, 1 (2010).
- (25) J. Adamczewski-Musch et al. (HADES Collaboration), Phys. Lett. B 778, 403 (2018).
- (26) M. Kiš et al. (FOPI Collaboration), Nucl. Instr. Meth. A 646, 27 (2011).
- (27) J. Ritman, Nucl. Phys. (Proc. Suppl.) B 44, 708 (1995); B. Sikora, Acta Phys. Pol. B 31, 135 (2000).
- (28) wwwasdoc.web.cern.ch/wwwasdoc/geant_html3/geantall.html
- (29) M. Menzel et al. (KaoS Collaboration), Phys. Lett. B 495, 26 (2000).
- (30) I. Fröhlich et al., 2007, arXiv:0708.2382v2.
- (31) M. Lorenz (HADES Collaboration), PoS (CPOD2017) 016 (2017).
- (32) D. Pelte et al. (FOPI Collaboration), Z. Phys. A 359, 55 (1997).
- (33) M. Merschmeyer et al. (KaoS Collaboration), Phys. Rev. C 76, 024906 (2007).
- (34) A. Andronic et al., Nucl. Phys. A 837 , 65 (2010).
- (35) F. Becattini, J. Cleymans, A. Keränen, E. Suhonen, K. Redlich, Phys. Rev. C 64, 024901 (2001).
- (36) S. Wheaton and J. Cleymans, Comput. Phys. Commun. 180, 84 (2009).
- (37) G. Agakishiev et al. (HADES Collaboration), Eur. Phys. J. A 47, 21 (2011).