Assessing the performance of the recent non-empirical semilocal density functionals on describing the lattice constants, bulk moduli and cohesive energies of alkali, alkaline-earth, and transition metals
Abstract
The bulk properties (lattice constants, bulk moduli, and cohesive energies) of alkali, alkaline-earth, and transition metals are studied within the framework of the recently developed meta-GGA (meta-Generalized Gradient Approximation) semilocal exchange-correlation functionals. To establish the applicability, broadness and accuracy of meta-GGA functionals we also put the results of PBE (Perdew-Burke-Ernzerhof) and PBEsol (PBE reparametrized for solids) functionals. The interesting feature of the present paper is that it measures the accuracy of the recently developed TM (Tao-Mo) and TMTPSS (TM exchange with Tao-Perdew-Staroverov-Scuseria (TPSS) correlation) and SCAN (Strongly Constrained and Appropriately Normed) functionals on describing aforementioned properties. The present systematic investigation shows that the TM is accurate in describing the lattice constants while for cohesive energies and bulk moduli the accuracy is biased towards the PBE and TPSS functionals.
I Introduction
Since its advent, the Kohn-Sham (KS) KS65 density functional theory (DFT) is a de facto standard theoretical framework for studying the electronic structures of solids and materials. The accuracy of the KS density functional depends on the accuracy of the approximate exchange-correlation functionals. Due to the reasonable computational cost with comparatively well balanced accuracy the semilocal nature of the exchange-correlation functionals i.e., the local density approximations (LDA) lda , generalized-gradient approximation (GGA) PW86 ; B88 ; LYP88 ; PW91 ; B3PW91 ; PBE96 ; AE05 ; ZWu06 ; SOGGA ; PBEsol ; con1 ; con2 ; con3 ; con4 and meta-generalized gradient approximation (meta-GGA) BR89 ; VSXC98 ; MO6L ; TPSS03 ; revTPSS ; con5 ; MS0 ; MS1MS2 ; SCAN15 ; Tao-Mo16 are widely used for the bulk properties of solids YMo16 ; YMoCPL ; mapkw ; smrkp ; mgga-vasp ; perdewpnas ; PJanthon13 ; PJanthon14 ; PBlaha09 ; FTran16 ; GCsonks09 ; GKresse13 ; SJana18 . The mainstream of semilocal density functionals are developed based on the constraint satisfaction PBE96 ; AE05 ; ZWu06 ; SOGGA ; PBEsol ; con1 ; con2 ; con3 ; con4 ; TPSS03 ; revTPSS ; con5 ; MS0 ; MS1MS2 ; SCAN15 ; Tao-Mo16 or modelling the exchange hole Tao-Mo16 or association both the properties Tao-Mo16 . Usually, benchmarking the density functional approximations against the experimental features are common practice to measure the accuracy and applicability of the approximation, in particular when a new functional is introduced. Indeed, the systematic evaluation of the properties of a density functional approximation guide users to properly choose a functional for describing the material properties. Also, the behavior of the functionals for the wide range of systems makes it easier to improve the drawback of the functional.
The present paper seeks to assess the performance of the recently proposed meta-GGA functionals at the accuracy of the bulk properties of the transition metals. More specifically, we consider the lattice constants (or equilibrium shortest distances), bulk moduli, and cohesive energies of transition metals. Regarding the performance of different level of density functional approximations for the bulk properties of transition metals, it has been studied earlier within the framework of GGA, meta-GGA and hybrid functionals theory. In ref. PJanthon13 Janthon et. al. studied the transition metals within the framework of GGA based functionals. In ref. PJanthon14 Janthon et. al. further explore the behavior of transition metals by including meta-GGA level functionals. Besides, Hass et. al. PBlaha09 , Csonka et. al. GCsonks09 , Tran et. al. FTran16 , Schimka et. al. GKresse13 , Hao et. al. PHao12 , and Zhang et. al. GZhang08 partially cover the lattice constants, cohesive energies and bulk moduli of alkali, alkaline-earth, and transition metals. In this paper, we put together the lattice constants, cohesive energies and bulk moduli of all the alkali, alkaline-earth, and transition metals within the framework of recently developed meta-GGA functionals. Our comparison meta-GGA functionals contain Tao-Perdew-Staroverov-Scuseria (TPSS) TPSS03 , revised TPSS (revTPSS) revTPSS , Minnesota 2006 local functional (M06L) MO6L , meta-GGA made simple (MS0, MS1, and MS2) MS0 ; MS1MS2 ; MSh functionals, Strongly Constrained and Appropriately Normed (SCAN) SCAN15 , and Tao-Mo Tao-Mo16 meta-GGA functional (TMTPSS and TM) functionals.
Arguably, the recent advances in the meta-GGA functionals show that the accuracy of the functionals can be further improved by imposing more exact constraints on the functional construction. The motivation of the present paper flows from the appealing features and accuracy of the recently developed meta-GGA functionals. The recent development of the meta-GGA functionals shows that the SCAN functionals developed by Sun et. al. SCAN15 and TM functional developed by Tao et. al. Tao-Mo16 quite accurate in describing several bulk properties of solids. Though the SCAN functional has been studied for bulk properties of few metals but remains untested extensively for the alkali, alkaline-earth, and transition metals. Also, the recently developed TM functional remains untested for those properties. In the present paper, we present the benchmark calculations of the bulk properties of the , and transition metals, alkali, and alkaline earth metals. In particular, due to different bonding nature of the alkali, alkaline-earth and transition metals, they are considered as the difficult cases within semilocal exchange-correlation functionals. Though they are considered mainly as metals and metallic bonding dominates, but the weak van-der-Waals interactions in closed semi-core states also play important role GKresse13 ; JTao10 . These make the semilocal functionals difficult to describe accurately all the bonding nature and often in the benchmarking calculations the , and transition metals, alkali and alkaline earth metals are excluded.
It was shown in ref. GKresse13 that the PBE functional does not perform in a satisfactory way in describing the lattice constants of all these metals. It was shown that the PBE lattice constants for metals are slightly too small, whereas, the lattice constants reported for and metals using PBE are too large. It was also shown in ref. GKresse13 that the situation improves through the inclusion of kinetic-energy density term in the functional construction. Due to the one electron free correlation of the revTPSS functional, it performs reasonably for the transition metal lattice constants. All these previous studies motivate us to assess the accuracy of the recently developed meta-GGAs in predicting the aforementioned bulk properties. It is noteworthy to mention that the SCAN functional includes the intermediate van-der-Waals (vdW) interaction, therefore it will be an interesting study to assess its performance for alkali and alkaline-earth materials, where the bonding is influenced by the vdW interaction in the semi-core states. Regarding the TM functionals, it was shown that both the TM and TPSS correlation perform differently with the TM exchange. But the accuracy of the TMTPSS and TM has not been measured against the , and transition metals, alkali, and alkaline earth metals. In this paper, we put all the modern meta-GGA density functionals (TPSS, revTPSS, M06L, MS0, MS1, MS2, SCAN, TMTPSS, and TM) together with GGA (PBE PBE96 and PBEsol PBEsol ) based semilocal functionals to assess the performance of alkali, alkaline-earth, and transition metals.
This paper is organized as follows: In the following, we will describe our computational set up along with the test set used for our calculations. Following that, we will study the lattice constants, bulk moduli and surface energies of the transition metals. We will conclude by discussing and comparing our results.
II Computational Setup
All computational studies are performed using the plane wave code based on the projector-augmented method Vienna Ab Initio Simulation Package (VASP) paw1 ; paw2 ; vasp1 ; vasp2 ; vasp3 ; uspp . The Bulk calculations are performed with Gamma-centered points. Regarding the atomic calculations of cohesive energies a simulation box of Å3 has been used with Gamma-centered points. The spin polarization calculations are performed for atoms. An energy convergence criterion of has been set for bulk calculations, whereas, the atomic simulations are performed with energy convergence criterion of . It is noteworthy to mention that all calculations of the meta-GGA functionals are performed by starting from the PBE wavefunctions and change densities. The energy cutoff eV to eV is used for bulk calculations, whereas eV to eV energy cutoff is used for the atomic calculations.
The results present in TABLEs are arranged by separation out the transition metals, transition metals, transition metals, alkali metals (K, Rb, and Cs) and alkaline-earth metals (Ca, Sr and Ba). Under the ambient condition, all the alkali metals, alkaline-earth metals, and transition metals show , , or structures. Only exceptions are Mn, La, and Hg. These materials show complicated hexagonal (La), rhombohedral (Hg) and cubic unit cell with 58 atoms (Mn). Due to the very different structures of La, Hg, and Mn, they are also discussed separately in all TABLEs.
To compare the overall accuracy of all the functionals we present mean-error (ME), mean absolute error (MAE) of the , , along with alkali and alkaline metals. The total ME and total MAE is also given in the last column of each TABLE.
III Results and Discussions
III.1 Equilibrium Inter-atomic Shortest Distances
All the lattice constants of alkali, alkaline-earth, and transition metals are determined at their ambient conditions and non-magnetic phases. The experimental values presented in TABLE I are subtracted for the zero-point vibrational effects (ZPVE). TABLE I presents the ZPVE corrected equilibrium inter-atomic distances along with the benchmark results of all the functionals. The equilibrium inter-atomic distances depend on the equilibrium lattice constants according to the different lattice structures. For the details of the relation between the inter-atomic distances and equilibrium lattice constants, the readers are suggested to go through the ref. PJanthon13 . In FIG. I, we also show the percentage deviation of our calculated values. Though the calculations for the PBE, PBEsol, M06L, TPSS, and revTPSS are reported in past for several solids, but in our present study, we recalculate all the solids along with recently developed meta-GGAs. In this section, we will discuss the functional performances according to the data present in TABLE I.
| Metals | PBE | PBEsol | TPSS | revTPSS | M06L | MS0 | MS1 | MS2 | SCAN | TMTPSS | TM | Expt. |
| Sc | 330.1 | 326.3 | 328.4 | 327.7 | 328.0 | 331.2 | 331.5 | 328.9 | 329.6 | 328.7 | 327.8 | 324.4 |
| Ti | 292.3 | 288.8 | 290.4 | 289.2 | 291.0 | 291.9 | 292.1 | 290.4 | 290.8 | 291.2 | 290.1 | 288.9 |
| V | 258.0 | 254.4 | 256.1 | 255.2 | 257.3 | 255.5 | 255.8 | 255.2 | 255.6 | 256.8 | 256.1 | 260.6 |
| Cr | 245.6 | 242.4 | 244.0 | 243.0 | 244.3 | 242.7 | 243.0 | 242.7 | 243.2 | 244.3 | 243.5 | 248.5 |
| Fe | 238.6 | 234.9 | 236.6 | 235.5 | 236.3 | 235.0 | 235.3 | 235.1 | 235.1 | 236.8 | 236.0 | 245.0 |
| Co | 245.1 | 240.9 | 242.9 | 241.6 | 243.0 | 240.9 | 241.3 | 241.1 | 241.2 | 243.0 | 242.0 | 248.8 |
| Ni | 248.2 | 243.6 | 245.2 | 243.2 | 241.8 | 243.8 | 244.2 | 243.7 | 243.7 | 244.9 | 243.6 | 248.4 |
| Cu | 257.0 | 251.5 | 253.0 | 250.9 | 248.3 | 250.5 | 251.3 | 250.2 | 249.4 | 252.1 | 251.1 | 254.4 |
| Zn | 263.5 | 261.1 | 263.2 | 261.4 | 263.4 | 260.5 | 260.9 | 259.7 | 258.8 | 261.0 | 260.5 | 264.5 |
| ME | -0.6 | -4.4 | -2.6 | -4.0 | -3.3 | -3.5 | -3.1 | -4.1 | -4.0 | -2.7 | -3.6 | |
| MAE | 3.2 | 4.8 | 3.9 | 4.8 | 4.6 | 5.7 | 5.4 | 5.4 | 5.6 | 4.2 | 4.7 | |
| Y | 363.3 | 358.5 | 363.8 | 361.6 | 366.6 | 366.7 | 366.6 | 363.9 | 365.7 | 365.5 | 362.6 | 354.8 |
| Zr | 323.6 | 318.0 | 321.4 | 319.2 | 324.0 | 321.4 | 321.5 | 320.5 | 321.1 | 323.1 | 320.2 | 317.4 |
| Nb | 287.8 | 284.1 | 286.7 | 285.2 | 288.2 | 285.5 | 285.7 | 285.6 | 286.4 | 287.2 | 286.1 | 285.4 |
| Mo | 272.9 | 269.9 | 271.9 | 270.3 | 271.9 | 270.2 | 270.4 | 270.4 | 271.1 | 271.7 | 270.6 | 272.1 |
| Tc | 274.4 | 271.2 | 273.1 | 271.3 | 272.2 | 271.0 | 271.2 | 271.3 | 272.0 | 272.8 | 271.5 | 270.5 |
| Ru | 271.6 | 268.1 | 270.5 | 268.1 | 269.0 | 266.9 | 267.2 | 267.7 | 267.4 | 270.0 | 268.3 | 264.2 |
| Rh | 270.4 | 266.2 | 268.9 | 263.6 | 264.2 | 263.0 | 263.3 | 263.5 | 263.8 | 264.3 | 263.9 | 253.2 |
| Pd | 278.6 | 273.2 | 276.1 | 272.9 | 277.2 | 272.8 | 273.2 | 273.0 | 273.8 | 275.9 | 273.6 | 274.5 |
| Ag | 293.4 | 285.7 | 289.1 | 285.0 | 291.4 | 285.7 | 286.2 | 285.3 | 286.1 | 288.4 | 285.6 | 287.7 |
| Cd | 302.0 | 306.2 | 301.3 | 298.4 | 311.8 | 313.9 | 298.2 | 297.8 | 296.3 | 299.6 | 298.0 | 295.9 |
| ME | 6.2 | 2.5 | 4.7 | 2.0 | 6.1 | 4.1 | 2.8 | 2.3 | 2.8 | 4.3 | 2.5 | |
| MAE | 6.2 | 3.9 | 4.8 | 3.3 | 6.1 | 5.3 | 3.7 | 3.5 | 3.5 | 4.4 | 3.4 | |
| Hf | 319.5 | 315.2 | 317.1 | 315.3 | 320.4 | 316.1 | 316.5 | 315.4 | 315.1 | 316.6 | 315.9 | 312.6 |
| Ta | 286.6 | 283.3 | 284.8 | 283.1 | 287.2 | 282.9 | 283.2 | 282.9 | 282.9 | 284.4 | 283.7 | 285.6 |
| W | 274.7 | 272.0 | 273.3 | 271.7 | 273.5 | 271.4 | 271.7 | 271.6 | 271.8 | 272.8 | 272.1 | 273.8 |
| Re | 277.2 | 274.4 | 273.4 | 272.5 | 273.0 | 271.4 | 271.8 | 272.2 | 271.1 | 273.2 | 272.8 | 256.2 |
| Os | 275.4 | 272.4 | 274.1 | 271.8 | 272.5 | 270.9 | 271.2 | 271.6 | 270.6 | 273.2 | 271.9 | 267.1 |
| Ir | 273.8 | 270.5 | 272.6 | 270.1 | 271.4 | 268.5 | 268.9 | 269.6 | 267.6 | 271.7 | 270.2 | 271.0 |
| Pt | 280.5 | 276.1 | 278.9 | 275.6 | 278.8 | 274.3 | 274.6 | 275.1 | 274.8 | 278.0 | 275.8 | 276.6 |
| Au | 293.9 | 287.7 | 291.1 | 286.9 | 291.6 | 285.8 | 286.3 | 286.4 | 286.8 | 290.3 | 287.2 | 287.0 |
| ME | 6.5 | 2.7 | 4.4 | 2.1 | 4.8 | 1.4 | 1.8 | 1.9 | 1.4 | 3.8 | 2.5 | |
| MAE | 6.5 | 4.0 | 4.8 | 3.8 | 4.9 | 4.2 | 4.1 | 4.0 | 3.9 | 4.3 | 3.8 | |
| K | 457.5 | 452.5 | 463.5 | 459.0 | 427.8 | 463.5 | 464.0 | 459.2 | 458.9 | 446.1 | 446.0 | 451.4 |
| Rb | 490.1 | 483.7 | 497.1 | 492.6 | 451.6 | 499.6 | 502.4 | 493.7 | 491.7 | 483.7 | 483.7 | 483.0 |
| Cs | 534.8 | 520.3 | 542 | 536.5 | 482.2 | 546.9 | 549.3 | 538.6 | 539.9 | 523.5 | 523.5 | 523.0 |
| ME | 8.3 | -0.3 | 15.1 | 10.2 | -31.9 | 17.5 | 19.4 | 11.4 | 11.0 | -1.4 | -1.4 | |
| MAE | 8.3 | 1.5 | 15.1 | 10.2 | 31.9 | 17.5 | 19.4 | 11.4 | 11.0 | 2.2 | 2.2 | |
| Ca | 394.3 | 385.8 | 391.1 | 390.0 | 378.7 | 394.3 | 395.5 | 392.7 | 393.5 | 388.6 | 388.1 | 392.9 |
| Sr | 426.4 | 418.7 | 426.6 | 425.1 | 414.9 | 431.2 | 433.2 | 427.3 | 430.3 | 424.2 | 423.3 | 427.1 |
| Ba | 423.7 | 423.6 | 433.5 | 431.5 | 430.8 | 440.2 | 441.6 | 435.9 | 435.9 | 433.5 | 431.2 | 433.2 |
| ME | -2.9 | -8.4 | -0.7 | -2.2 | -9.6 | 4.2 | 5.7 | 0.9 | 2.2 | -2.3 | -3.5 | |
| MAE | 3.9 | 8.4 | 0.9 | 2.2 | 9.6 | 4.2 | 5.7 | 1.0 | 2.2 | 2.5 | 3.5 | |
| Mn | 230.7 | 227.1 | 228.4 | 227.7 | 228.6 | 227.4 | 227.7 | 227.4 | 227.6 | 228.6 | 230.2 | 224.0 |
| La | 376.9 | 365.4 | 373.3 | 369.2 | 385.9 | 373.9 | 374.7 | 372.1 | 379.5 | 376.6 | 373.4 | 373.9 |
| Hg | 323.8 | 300.6 | 308.5 | 299.5 | 308.9 | 297.6 | 298.6 | 297.6 | 300.2 | 305.2 | 299.5 | 301.0 |
| ME | 10.8 | -1.9 | 3.8 | -0.8 | 8.2 | 0.0 | 0.7 | -0.6 | 2.8 | 3.8 | 1.4 | |
| MAE | 10.8 | 4.0 | 4.2 | 3.3 | 8.2 | 2.3 | 2.3 | 2.9 | 3.3 | 3.8 | 2.7 | |
| TME | 4.4 | -0.7 | 3.1 | 0.6 | -0.9 | 2.4 | 2.5 | 1.0 | 1.3 | 1.4 | 0.0 | |
| TMAE | 5.9 | 4.3 | 5.0 | 4.3 | 8.1 | 5.8 | 5.6 | 4.5 | 4.5 | 3.9 | 3.6 |
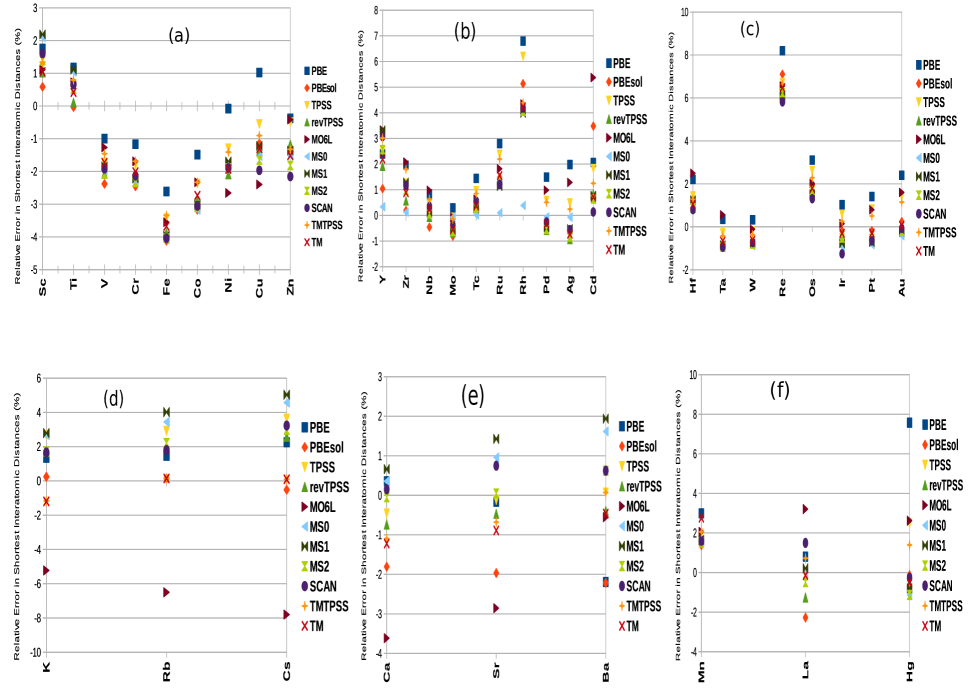
transition metals : The inter-atomic distances of elements are presented at the top of the TABLE I. The elements contain with Sc, Ti, V, Cr, Fe, Co, Ni, Cu, and Zn. Let us start our discussion with the popularly used GGA functional PBE. The PBE functional perform fairly good throughout the series. However, It overestimates the inter-atomic distances of Sc, Ti, V, and Cu, and underestimations the inter-atomic distances for Cr, Fe, and Co. But it gives a fairly good inter-atomic distance for Ni. Regarding the performance of the PBEsol, it underestimates the inter-atomic distances of all the elements except Sc and Ti. For Sc, the PBEsol overestimates the inter-atomic distance, whereas, very good inter-atomic distance is obtained for Ti. The underestimation percentage of all the elements are fairly large for PBEsol compared to PBE. Especially, for Fe, a fairly large underestimation is observed. Now, we consider the meta-GGA functionals. Regarding the performance for the TPSS and revTPSS functionals, the revTPSS functional lower the inter-atomic distances compared to TPSS for all the elements by almost pm to pm. TPSS overestimates the inter-atomic distances for Sc, Ti, but it follows the different trend as the bands become filled. For V, Cr, Fe, Co, Ni, Cu and Zn TPSS underestimates the inter-atomic distances. The underestimation tendency becomes less intense as the band almost filled. Now, concerning the performance of M06L, it follows the same trend as TPSS does except for Ni and Cu. For Ni and Cu, M06L underestimates the inter-atomic distances more than TPSS and revTPSS do. Now, for the meta-GGA made simple functionals (MS0, MS1, and MS2), all perform equivalently and overestimate the inter-atomic distances for Sc and Ti, but underestimate the inter-atomic distances form V to Zn. The underestimation and overestimation percentage of all the “MS” functionals are fairly large compared to the traditional TPSS and revTPSS functionals. Now, we consider the performance of the two recently proposed functionals SCAN and TM (TMTPSS and TM). The performance of SCAN quite disappointing as it follows the same trend of “MS” functionals. The MAE of SCAN functional indicates that it performs better than MS0 but less accurate than MS1 and MS2. Now, concerning TMTPSS and TM functionals both are less accurate than TPSS in predicting the inter-atomic distances of metals. In fact, both show the same tradition as it is observed using other meta-GGAs. Overall consideration shows that the PBE functionals perform fairly well for all the elements and reports the best MAE compared to the more advanced meta-GGA functionals. Overall tendency of meta-GGAs shows that TPSS is the best among all the meta-GGA functionals. We do not observe improvement in the inter-atomic distances using the more advance functionals like SCAN and TM based functionals.
transition metals : Unlike the elements, in this case, the PBE functional overestimates the the inter-atomic distances of all the elements except Mo. A sizable overestimation in the inter-atomic distances is observed for Y, Zr, Tc, Ru, Rh, Ag and Cd. For Nb, the overestimation is observed within the limit of pm. The PBEsol functional reduce the sizable overestimation percentage of PBE. Concerning the meta-GGAs functionals, very good MAE is observed using revTPSS, MS1, MS2, SCAN and TM functionals. A sizable overestimation in the interatomic distances is observed using the TPSS, M06L and MS0 functionals. Among all the meta-GGAs, the error obtained using the M06L functional is fairly large. It actually follows PBE like tendency in this case. Regarding the recent two meta-GGAs, SCAN and TM, both perform equivalently for all the elements except Y. In that case, the SCAN overestimates more than TM functionals. For transition metals, the TM functional performs better than TMTPSS functionals. For transition metal elements, all semilocal functionals show overestimation tendency in predicting the inter-atomic distances except for few cases.
transition metals : We observe the same trend as it is observed for the elements. A fairly sizable overestimation is observed for PBE functional. PBEsol reduces the MAE for the PBE functional. In case of meta-GGA functionals, the revTPSS, SCAN, and TM functionals perform equivalently. Using the “MS” meta-GGAs we obtain almost equivalent MAE. Interestingly, the “MS” meta-GGA functionals overall overestimate the interatomic distances for few cases, whereas, underestimation in the inter-atomic distances are observed for others. A similar tendency is observed for the SACN functional. Both the TM and TMTPSS functionals quite reasonably predict the inter-atomic distances for the Ta, W, Os, Ir, Pt, and Au. For other elements overestimation is observed. Overall we obtain least MAE using the revTPSS and TM functionals.
Alkali metals : The alkali metals contain elements K, Rb and Cs. We separately discuss these metals because different kinds of interactions affect the bonding of these metals. Though they are considered as prototypical metals but a contribution from the semi-core and states originate van-der-Waals bonding GKresse13 ; JTao10 which affect the lattice constants or equilibrium shortest distances. A sizable error in equilibrium shortest distances is observed from the PBE functionals. The PBE functionals overestimate the equilibrium shortest distances for all the alkali metals. The PBEsol improves the performance and yields the least MAE for the alkali metals. Regarding the performance of the meta-GGAs, all functionals overestimate the equilibrium shortest distances except the M06L, TMTPSS and TM functionals. The M06L massively underestimates the equilibrium shortest distances of alkali metals, whereas, TMTPSS and TM agree very well with the experimental values. Both TMTPSS and TM functionals produce much better results than SCAN meta-GGA functional, though the SCAN contains intermediate van-der-Waals interactions.
Alkaline-earth metals : Unlike alkali metals, a reasonably good performance is observed using the PBE functionals for the alkaline-earth metals. However, the PBEsol underestimates the equilibrium shortest distances. Within meta-GGA functionals, TPSS and MS2 perform quite well. A sizable underestimation in the equilibrium shortest distances is observed using the M06L functional. MS0 and MS1 overestimate the equilibrium shortest distances, whereas, the overestimation percentage comparatively inadequate for the SCAN functional. In this case, both the TMTPSS and TM functionals underestimate the equilibrium shortest distances. But, the TMTPSS quite close to the experimental equilibrium shortest distances. In this case, the SCAN functional agrees well with the experimental values than TMTPSS and TM functionals.
Other transition metals : Due to the complicated structure of the Mn, La, and Hg, we separate out these elements from others. Regarding the performance of PBE, it massively overestimates the equilibrium shortest distances for all these metals. Reasonably good performance is observed using PBEsol. For meta-GGAs, all perform equivalently to predict the equilibrium shortest distances except M06L. M06L overestimates the shortest distances in a sizable order. The TPSS, MS0, MS1 perform equivalently. We obtain MAE pm from the revTPSS functionals. The MS2 and SCAN also produce the same amount of error in this case. Here, we obtain least MAE with the MS0 and MS1 functionals. TM functional is the second best after MS0 and MS1 with MAE pm. In this case also the performance TM functional is better to compare to the SCAN functional.
Overall performance : Correspond to the overall ranking we obtain the best MAE with the TM functional. Next, the performance of the TMTPSS is found to be best. The performance of TM and TMTPSS is quite well compared to the SCAN functional. The revTPSS, MS2 and SCAN functionals perform equivalently. The MAE of TPSS is less compare to the MS0 and MS1. The M06L gives the largest MAE of order pm.
III.2 Bulk Moduli
The bulk modulus () is defined as the variation of the volume () due to the external pressure (). In DFT the bulk modulus is measured at the equilibrium lattice constant or volume () as,
| Metals | PBE | PBEsol | TPSS | revTPSS | M06L | MS0 | MS1 | MS2 | SCAN | TMTPSS | TM | Expt. |
| Sc | 52.6 | 55.4 | 54.6 | 55.6 | 62.6 | 54.2 | 53.6 | 56.0 | 59.8 | 61.8 | 57.4 | 55.6 |
| Ti | 116.8 | 125.6 | 123.2 | 125.8 | 128.6 | 124.0 | 122.4 | 127.6 | 125.2 | 125.8 | 127.0 | 108.3 |
| V | 187.8 | 204.0 | 201.8 | 205.6 | 198.0 | 200.8 | 199.6 | 207.0 | 203.8 | 201.8 | 181.8 | 158.9 |
| Cr | 263.6 | 288.2 | 283.2 | 291.8 | 276.8 | 284.8 | 281.2 | 292.0 | 280.2 | 283.6 | 286.8 | 174.5 |
| Fe | 166.6 | 208.6 | 310.4 | 320.6 | 300.0 | 316.2 | 217.8 | 294.2 | 316.6 | 312.6 | 316.0 | 169.8 |
| Co | 212.6 | 285.8 | 280.2 | 291.4 | 263.6 | 294.2 | 288.0 | 268.8 | 297.6 | 244.2 | 289.6 | 193.0 |
| Ni | 197.7 | 230.1 | 226.2 | 241.8 | 221.9 | 242.2 | 235.7 | 244.8 | 238.3 | 233.1 | 236.6 | 185.5 |
| Cu | 137.1 | 163.3 | 156.5 | 170.5 | 151.9 | 158.9 | 146.9 | 155.9 | 152.4 | 161.2 | 164.2 | 140.3 |
| Zn | 74.0 | 91.8 | 86.0 | 97.8 | 74.2 | 99.4 | 82.8 | 102.0 | 105.2 | 96.8 | 105.6 | 69.7 |
| ME | 17.0 | 44.1 | 51.8 | 60.6 | 46.9 | 57.7 | 41.4 | 54.7 | 58.2 | 51.7 | 56.6 | |
| MAE | 19.1 | 44.2 | 52.1 | 60.6 | 46.9 | 58.0 | 41.8 | 54.7 | 58.2 | 51.7 | 56.6 | |
| Y | 39.6 | 42.0 | 40.2 | 40.2 | 44.4 | 37.4 | 37.2 | 36.6 | 36.4 | 38.4 | 41.4 | 41.7 |
| Zr | 92.8 | 98.8 | 96.4 | 97.0 | 95.4 | 92.8 | 92.2 | 95.6 | 95.8 | 96.2 | 97.0 | 95.9 |
| Nb | 172.0 | 186.8 | 183.4 | 187.6 | 169.0 | 181.6 | 180.4 | 183.4 | 180.8 | 181.2 | 183.2 | 172.0 |
| Mo | 266.4 | 289.0 | 278.6 | 286.2 | 260.2 | 287.0 | 285.2 | 287.4 | 284.0 | 278.6 | 283.6 | 264.7 |
| Tc | 301.4 | 330.6 | 317.0 | 329.0 | 292.2 | 334.6 | 331.2 | 331.2 | 324.2 | 319.0 | 325.2 | 303.1 |
| Ru | 316.4 | 353.8 | 334.4 | 350.4 | 302.0 | 365.4 | 361.4 | 356.8 | 342.2 | 337.0 | 345.8 | 317.7 |
| Rh | 254.8 | 295.8 | 276.7 | 292.4 | 235.0 | 298.4 | 294.7 | 292.9 | 290.3 | 275.9 | 284.0 | 288.7 |
| Pd | 165.3 | 201.8 | 187.9 | 201.1 | 148.3 | 199.5 | 195.3 | 200.1 | 193.5 | 189.5 | 195.3 | 195.4 |
| Ag | 86.1 | 112.3 | 102.3 | 113.0 | 89.1 | 103.7 | 100.9 | 110.7 | 105.4 | 109.3 | 113.0 | 103.8 |
| Cd | 40.8 | 59.4 | 54.4 | 62.2 | 58.6 | 59.6 | 56.0 | 63.4 | 57.4 | 64.8 | 50.2 | 53.8 |
| ME | -10.1 | 13.4 | 3.5 | 12.2 | -14.3 | 12.3 | 9.8 | 12.1 | 7.3 | 5.3 | 8.2 | |
| MAE | 10.5 | 13.4 | 8.0 | 12.5 | 15.8 | 13.8 | 12.0 | 13.2 | 8.8 | 9.7 | 9.9 | |
| Hf | 110.0 | 116.6 | 114.2 | 116.4 | 114.2 | 113.8 | 112.8 | 117.0 | 116.6 | 117.4 | 118.2 | 109.7 |
| Ta | 199.0 | 199.0 | 207.8 | 213.0 | 196.8 | 210.4 | 208.8 | 213.4 | 212.0 | 210.8 | 212.6 | 193.7 |
| W | 309.6 | 309.6 | 324.6 | 336.0 | 310.6 | 338.8 | 332.2 | 336.0 | 331.4 | 330.2 | 334.4 | 312.3 |
| Re | 370.6 | 399.6 | 390.8 | 406.8 | 392.8 | 417.8 | 410.2 | 408.4 | 412.6 | 398.8 | 404.8 | 368.8 |
| Os | 405.6 | 443.6 | 426.8 | 450.8 | 409.0 | 466.6 | 461.0 | 455.6 | 459.6 | 440.6 | 449.4 | 424.6 |
| Ir | 350.5 | 391.0 | 369.9 | 394.2 | 343.8 | 416.6 | 409.8 | 402.0 | 415.9 | 382.7 | 392.8 | 365.2 |
| Pt | 245.0 | 285.8 | 264.6 | 284.1 | 224.2 | 305.9 | 298.8 | 294.4 | 244.1 | 271.2 | 280.4 | 284.2 |
| Au | 131.1 | 164.1 | 157.6 | 162.7 | 127.7 | 168.2 | 172.5 | 167.8 | 158.2 | 153.1 | 159.5 | 174.8 |
| ME | -14.0 | 9.5 | 2.9 | 16.3 | -14.3 | 25.6 | 21.6 | 20.2 | 14.6 | 8.9 | 14.9 | |
| MAE | 15.8 | 12.9 | 12.1 | 19.4 | 22.2 | 27.3 | 22.2 | 21.9 | 28.8 | 17.6 | 19.6 | |
| K | 3.5 | 3.5 | 3.3 | 3.3 | 3.2 | 3.1 | 3.0 | 3.2 | 3.2 | 3.8 | 3.8 | 3.7 |
| Rb | 2.8 | 2.9 | 3.7 | 3.5 | 4.7 | 3.6 | 2.8 | 3.3 | 3.1 | 3.1 | 3.1 | 2.9 |
| Cs | 2.0 | 2.0 | 1.8 | 1.9 | 4.1 | 2.0 | 2.0 | 2.0 | 2.0 | 2.1 | 2.1 | 2.1 |
| ME | -0.1 | -0.1 | 0.0 | 0.0 | 1.1 | 0.0 | -0.3 | -0.1 | -0.1 | 0.1 | 0.1 | |
| MAE | 0.1 | 0.1 | 0.5 | 0.4 | 1.4 | 0.5 | 0.3 | 0.3 | 0.3 | 0.1 | 0.1 | |
| Ca | 16.8 | 17.2 | 16.8 | 17.1 | 20.9 | 18.2 | 17.5 | 17.7 | 17.6 | 18.4 | 18.5 | 18.4 |
| Sr | 11.5 | 12.3 | 11.4 | 11.7 | 17.1 | 11.8 | 11.4 | 11.9 | 11.1 | 12.5 | 12.6 | 12.4 |
| Ba | 8.7 | 9.3 | 8.4 | 8.7 | 11.8 | 7.7 | 7.6 | 8.3 | 8.1 | 9.2 | 9.2 | 9.3 |
| ME | -1.0 | -0.4 | -1.2 | -0.9 | 3.2 | -0.8 | -1.2 | -0.7 | -1.1 | 0.0 | 0.1 | |
| MAE | 1.0 | 0.4 | 1.2 | 0.9 | 3.2 | 0.8 | 1.2 | 0.7 | 1.1 | 0.1 | 0.1 | |
| TME | -1.9 | 18.3 | 15.8 | 24.1 | 5.4 | 25.6 | 19.3 | 23.4 | 21.5 | 17.9 | 21.5 | |
| TMAE | 12.3 | 19.3 | 19.7 | 25.1 | 23.4 | 26.7 | 20.6 | 24.3 | 25.6 | 21.3 | 23.2 | |
| Mn | 183.2 | 305.4 | 299.4 | 309.1 | 298.0 | 311.0 | 306.6 | 312.6 | 315.3 | 302.6 | 306.5 | 90.4 |
| La | 24.2 | 26.4 | 25.8 | 25.4 | 28.0 | 22.8 | 22.6 | 23.6 | 24.2 | 25.6 | 24.2 | 26.6 |
| Hg | 9.6 | 36.0 | 22.4 | 32.4 | 19.6 | 24.4 | 21.6 | 24.0 | 21.2 | 33.6 | 38.8 | 28.2 |
| ME | 23.9 | 74.2 | 67.5 | 73.9 | 66.8 | 71.0 | 68.5 | 71.7 | 71.8 | 72.2 | 74.8 | |
| MAE | 37.9 | 74.3 | 71.9 | 74.7 | 72.5 | 76.1 | 75.6 | 76.5 | 78.1 | 72.9 | 76.4 | |
| TME | 0.2 | 23.0 | 20.1 | 28.3 | 10.5 | 29.4 | 23.4 | 27.4 | 25.7 | 22.4 | 26.0 | |
| TMAE | 14.5 | 23.8 | 24.0 | 29.3 | 27.5 | 30.8 | 25.1 | 28.7 | 30.0 | 25.6 | 27.7 |
| (1) |
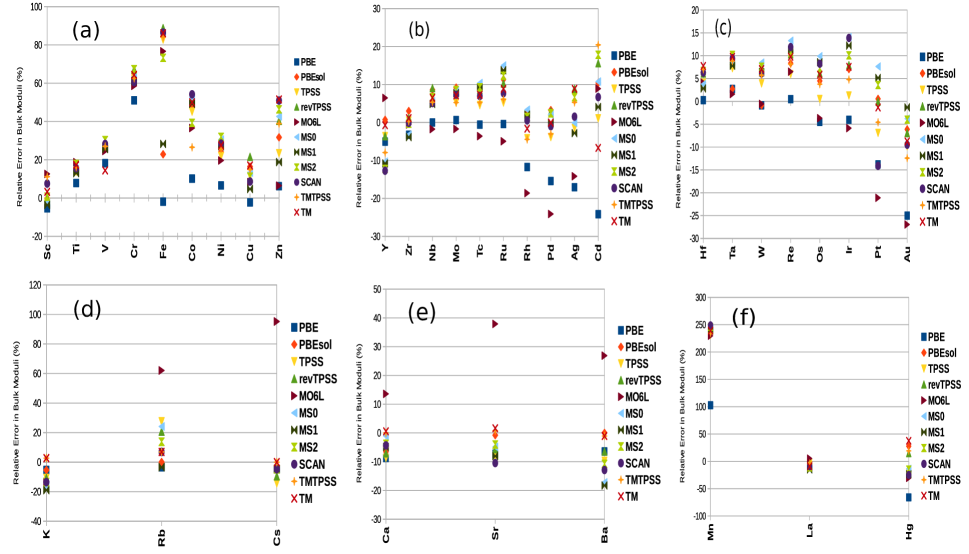
Several equations of state (EOS) EOS1 ; EOS2 ; EOS3 ; EOS4 are available to fit the energy versus volume curve to obtain the bulk moduli. However, in the present case, we use the Birch-Murnaghan equation of state to fit and obtain the bulk moduli of alkali, alkaline-earth, and transition metals. It is well known that determining the bulk modulus posses a great challenge, in particular for the transition metals PJanthon14 . The experimental values along with all the functionals values are presented in TABLE II. The general trend of the arrangement of TABLE II is the same as it is done in the case of the equilibrium shortest distances. The , and band elements are separated out. The values of alkali metals and alkali earth metals are also shown separately. The Mn, La, and Hg values are also separated out. In Fig. (2) we also plot the percentage deviation of all the metals considered in our work. The Fig. (2) is also arranged according to the data presented in TABLE II.
transition metals : The PBE functional works well for the transition metals and produces the least MAE. PBE functional overestimates the bulk moduli for few cases, whereas, underestimates in results are observed for others. However, the performance of the revised version of PBE i.e., PBEsol deviates more from the experimental values and yield MAE GPa. Regarding the meta-GGAs, all functionals deviate from the experimental values more or less. However, MS1 reports being least MAE among the meta-GGA functionals. We obtain equivalent performance using the TPSS, revTPSS, M06L, MS0, MS2, SCAN, TMTPSS and TM functionals.
transition metals : For the transition metals the TPSS functional performs best with MAE GPa. The PBE functional underestimates the bulk moduli of all the elements except Nb, Mo Tc, Ru. For those metals, the PBE values are very close to the experimental one. Unlike PBE, the PBEsol overestimates the bulk moduli of all the metals and provides the MAE GPa. The performance of revTPSS, MS0, MS1, MS2 are almost equivalent. All functionals overestimate the bulk moduli except few cases. The “MS” functionals yield reasonably good bulk moduli for Y, Zr, Pd, Ag, and Cd. We find reasonably good performance for Y, Zr, and Ag using revTPSS functional. For others overestimation is observed. The bulk moduli obtained from SCAN functional matches well with the experimental values except for few cases like Mo, Tc, and Ru. For Mo, Tc, and Ru the SCAN functional overestimates the value. From the TMTPSS and TM functionals, we obtain the similar trend as it is observed for SCAN. In this case, the TM functional overestimates more than TMTPSS in predicting the bulk moduli of metals.
transition metals : For the transition metals the performance of revTPSS, TPSS, and PBE are found to be better compared to the others. The M06L underestimates the bulk moduli for all, except Hf, Ta, and Re. The overall ME obtain from the M06L is found to be negative. The MS0, MS1, MS2, and SCAN functionals perform equivalently and provide almost equivalent ME and MAE. The performance of TM functional indicates that it yields slightly greater values for bulk moduli compared to the TMTPSS functional. Comparing the performance of SCAN, TMTPSS and TM functionals, both the TMTPSS and TM show improve performance than SCAN functional.
Alkali metals : The alkali matters are considered as a “soft-matter” due to the smaller extent of their bulk moduli. The bulk moduli of alkali metals vary only from GPa (Cs) to GPa (K). All the functionals perform reasonably good in case of all the alkali metals. The largest MAE is obtained from M06L functional, whereas, all other meta-GGA and GGAs varies from GPa to GPa.
Alkaline-earth metals : Like the alkali metals, we obtain equivalent performance of all the functionals for alkaline-earth metals. In this case, the largest MAE is obtained from M06L. The performance of revTPSS, MS0, MS1, MS2, and SCAN are almost equivalent. The TPSS functional yields the MAE GPa. In this case, we obtain the least MAE from the TMTPSS and TM functional. Both functionals perform fairly well than SCAN functional.
Other transition metals : The bulk moduli of Mn, La, and Hg are problematic within (most of) the density functionals. The experimental bulk modulus of Mn is GaP, whereas, all the functionals show sizable overestimation. The bulk modulus of La using all the functionals are predicted to be fairly well, but overestimation and underestimation in values are observed for Hg using all the functionals. The bulk modulus of Hg obtained from TPSS, revTPSS, MS0, MS1, MS2, SCAN and TMTPSS show good agreement with the experimental values. The M06L underestimates the bulk modulus of Hg and the same amount of overestimation is observed for the TM functional.
Overall performances : To evaluate the overall performance of all the functionals we present the ME and MAE with and without considering Mn, La and Hg transition metals. Overall, the PBE functional yields the best MAE ( GPa with other transition metals and without other transition metals). All meta-GGAs overall overestimate the ME and MAE. The performance of TPSS functional seems to be the best within all the meta-GGAs.
III.3 Cohesive Energies
The Cohesive energies are equivalent to the atomization energies in the case of the bulk solids. It is expressed as the energy per atom as,
| Metals | PBE | PBEsol | TPSS | revTPSS | M06L | MS0 | MS1 | MS2 | SCAN | TMTPSS | TM | Expt. |
| Sc | 4.20 | 4.58 | 4.47 | 4.58 | 5.08 | 4.39 | 4.31 | 4.49 | 4.37 | 4.69 | 4.81 | 3.93 |
| Ti | 5.40 | 5.87 | 5.56 | 5.77 | 6.22 | 5.29 | 5.23 | 5.48 | 5.30 | 6.01 | 6.04 | 4.88 |
| V | 5.25 | 5.83 | 5.51 | 5.76 | 6.28 | 5.09 | 5.01 | 5.43 | 4.96 | 5.89 | 5.93 | 5.34 |
| Cr | 4.05 | 4.71 | 4.24 | 4.47 | 4.50 | 3.49 | 3.44 | 3.96 | 3.26 | 4.62 | 4.66 | 4.15 |
| Fe | 4.89 | 5.61 | 5.32 | 5.59 | 5.03 | 5.16 | 5.08 | 5.51 | 5.13 | 5.68 | 5.80 | 4.32 |
| Co | 5.07 | 5.83 | 5.72 | 6.04 | 5.71 | 5.76 | 5.67 | 6.01 | 5.86 | 6.19 | 6.30 | 4.47 |
| Ni | 4.68 | 5.33 | 5.06 | 5.43 | 4.54 | 5.22 | 5.11 | 3.23 | 5.25 | 5.62 | 5.71 | 4.48 |
| Cu | 3.48 | 4.03 | 3.75 | 4.09 | 3.06 | 3.80 | 3.71 | 4.09 | 3.87 | 4.32 | 4.38 | 3.51 |
| Zn | 1.10 | 1.57 | 1.34 | 1.61 | 1.54 | 1.55 | 1.46 | 1.74 | 1.52 | 1.71 | 1.89 | 1.38 |
| ME | 0.18 | 0.77 | 0.50 | 0.76 | 0.61 | 0.37 | 0.28 | 0.39 | 0.34 | 0.92 | 1.01 | |
| MAE | 0.30 | 0.77 | 0.51 | 0.76 | 0.71 | 0.57 | 0.52 | 0.71 | 0.62 | 0.92 | 1.01 | |
| Y | 4.21 | 4.60 | 4.43 | 4.57 | 5.06 | 4.36 | 4.30 | 4.49 | 4.42 | 4.70 | 4.81 | 4.42 |
| Zr | 6.27 | 6.78 | 6.35 | 6.55 | 6.80 | 5.83 | 5.83 | 6.04 | 6.12 | 6.82 | 6.84 | 6.32 |
| Nb | 6.79 | 7.47 | 7.14 | 7.40 | 8.63 | 6.85 | 6.75 | 7.07 | 6.56 | 7.45 | 7.49 | 7.47 |
| Mo | 6.35 | 7.18 | 6.63 | 6.95 | 6.85 | 6.34 | 6.23 | 6.61 | 5.81 | 6.96 | 7.03 | 6.84 |
| Tc | 6.90 | 7.85 | 7.17 | 7.59 | 6.53 | 7.28 | 7.16 | 7.57 | 6.72 | 7.61 | 7.78 | 7.17 |
| Ru | 6.88 | 7.87 | 7.21 | 7.66 | 6.25 | 7.69 | 7.54 | 7.79 | 7.56 | 7.70 | 7.85 | 6.80 |
| Rh | 5.70 | 6.66 | 6.00 | 6.40 | 5.40 | 5.9 | 5.81 | 6.18 | 5.58 | 6.41 | 6.55 | 5.76 |
| Pd | 3.74 | 4.47 | 4.00 | 4.39 | 4.17 | 4.24 | 4.13 | 4.46 | 4.38 | 4.61 | 4.71 | 3.93 |
| Ag | 2.52 | 3.08 | 2.73 | 3.03 | 3.24 | 2.79 | 2.70 | 3.10 | 2.88 | 3.29 | 3.35 | 2.96 |
| Cd | 0.73 | 1.16 | 0.95 | 1.2 | 1.33 | 1.08 | 1.01 | 1.34 | 1.03 | 1.39 | 1.49 | 1.18 |
| ME | -0.28 | 0.43 | -0.02 | 0.29 | 0.14 | -0.05 | -0.14 | 0.18 | -0.18 | 0.41 | 0.51 | |
| MAE | 0.29 | 0.43 | 0.18 | 0.30 | 0.45 | 0.34 | 0.34 | 0.36 | 0.42 | 0.41 | 0.51 | |
| Hf | 6.48 | 7.14 | 6.77 | 7.08 | 7.40 | 6.82 | 6.73 | 7.03 | 6.35 | 7.05 | 7.22 | 6.44 |
| Ta | 8.58 | 9.23 | 8.67 | 9.03 | 9.00 | 8.99 | 8.85 | 9.20 | 8.90 | 9.53 | 9.55 | 8.11 |
| W | 8.47 | 9.27 | 8.83 | 9.22 | 9.77 | 9.31 | 9.12 | 9.46 | 9.09 | 9.41 | 9.45 | 8.83 |
| Re | 7.79 | 8.77 | 8.22 | 8.65 | 7.74 | 8.89 | 8.68 | 8.95 | 8.51 | 8.71 | 8.91 | 8.06 |
| Os | 8.30 | 9.36 | 8.80 | 9.10 | 8.23 | 9.53 | 9.34 | 9.53 | 9.08 | 9.26 | 9.49 | 8.22 |
| Ir | 7.19 | 8.27 | 7.56 | 8.10 | 6.97 | 8.51 | 8.31 | 8.43 | 8.37 | 8.07 | 8.27 | 6.96 |
| Pt | 5.42 | 6.27 | 5.74 | 6.18 | 5.81 | 6.31 | 6.15 | 6.42 | 6.17 | 6.31 | 6.46 | 5.87 |
| Au | 3.03 | 3.72 | 3.27 | 3.60 | 3.57 | 3.59 | 3.45 | 3.81 | 3.55 | 3.83 | 3.93 | 3.83 |
| ME | -0.13 | 0.71 | 0.19 | 0.58 | 0.27 | 0.70 | 0.54 | 0.81 | 0.46 | 0.73 | 0.87 | |
| MAE | 0.34 | 0.74 | 0.37 | 0.64 | 0.43 | 0.76 | 0.63 | 0.82 | 0.56 | 0.73 | 0.87 | |
| K | 0.86 | 0.92 | 0.92 | 0.94 | 0.66 | 0.86 | 0.84 | 0.88 | 0.84 | 0.99 | 0.99 | 0.94 |
| Rb | 0.78 | 0.84 | 0.81 | 0.83 | 1.30 | 0.78 | 0.76 | 0.80 | 0.76 | 0.93 | 0.92 | 0.86 |
| Cs | 0.72 | 0.78 | 0.74 | 0.77 | 1.35 | 0.73 | 0.71 | 0.76 | 0.70 | 0.88 | 0.88 | 0.81 |
| ME | -0.08 | -0.02 | -0.05 | -0.02 | 0.23 | -0.08 | -0.10 | -0.06 | -0.10 | 0.06 | 0.06 | |
| MAE | 0.08 | 0.02 | 0.05 | 0.02 | 0.42 | 0.08 | 0.10 | 0.06 | 0.10 | 0.06 | 0.06 | |
| Ca | 1.91 | 2.11 | 2.02 | 2.08 | 2.50 | 2.00 | 1.96 | 2.03 | 2.08 | 2.17 | 2.29 | 1.86 |
| Sr | 1.61 | 1.81 | 1.76 | 1.83 | 2.27 | 1.79 | 1.74 | 1.84 | 1.82 | 1.96 | 2.06 | 1.73 |
| Ba | 1.88 | 2.12 | 2.03 | 2.11 | 2.51 | 2.00 | 1.95 | 2.1 | 2.04 | 2.24 | 2.34 | 1.91 |
| ME | -0.03 | 0.18 | 0.10 | 0.17 | 0.59 | 0.10 | 0.05 | 0.16 | 0.15 | 0.29 | 0.40 | |
| MAE | 0.07 | 0.18 | 0.10 | 0.17 | 0.59 | 0.10 | 0.05 | 0.16 | 0.15 | 0.29 | 0.40 | |
| Mn | 3.80 | 4.55 | 3.95 | 4.06 | 2.81 | 3.04 | 3.01 | 3.54 | 2.90 | 4.13 | 4.28 | 2.92 |
| La | 4.30 | 4.79 | 4.51 | 4.56 | 5.03 | 3.83 | 3.82 | 4.06 | 3.72 | 4.58 | 4.61 | 4.47 |
| Hg | 0.15 | 0.54 | 0.22 | 0.43 | 0.55 | 0.43 | 0.32 | 0.64 | 0.39 | 0.67 | 0.75 | 0.62 |
| ME | 0.08 | 0.62 | 0.22 | 0.35 | 0.13 | -0.24 | -0.29 | 0.08 | -0.33 | 0.46 | 0.54 | |
| MAE | 0.51 | 0.68 | 0.49 | 0.47 | 0.25 | 0.32 | 0.35 | 0.35 | 0.33 | 0.46 | 0.54 | |
| TME | -0.06 | 0.53 | 0.19 | 0.44 | 0.33 | 0.22 | 0.12 | 0.34 | 0.11 | 0.57 | 0.67 | |
| TMAE | 0.29 | 0.55 | 0.31 | 0.47 | 0.50 | 0.45 | 0.41 | 0.51 | 0.44 | 0.57 | 0.67 |
| (2) |
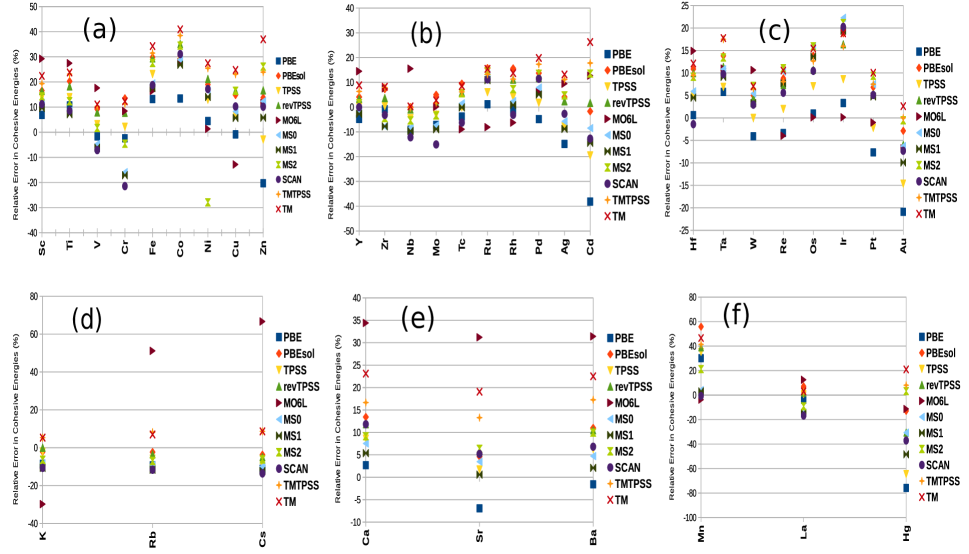
where is the atomic energy and is the bulk energy of unit cell having atoms. Predicting the cohesive energies of transition metals posses great challenge because of their “strongly” correlated nature GKresse13 . TABLE III presents the performance of all the functionals along with the experimental values. We arrange TABLE III in the same manner as it is done in the case of lattice constants and bulk moduli. The behavior of all the functionals are also plotted in the Fig. 3. The percentage deviation of all the functionals is shown there. All the cohesive energies are calculated at the equilibrium lattice constants of the functional.
transition metals : The PBE functional predicts the cohesive energies of transition metals quite well compared to the other GGA and meta-GGA based functionals. Though PBE overestimates the cohesive energies for Sc, Ti, Fe, and Co, but overall both the ME and MAE are found to be reasonably well predicted within PBE functional. The PBEsol overestimates the cohesive energies of transition metals more. Therefore, increase in ME and MAE is observed with the PBEsol functional. Within the meta-GGA functionals, the performance of MS1 is the best. MS0 quite closely follows the MS1 functional. Comparing the SCAN, TMTPSS and TM functionals, the SCAN functional performs better compared to TM based functionals. The revTPSS overestimates the TPSS values more and yield more enhanced ME and MAE. The M06L yield the same MAE as it is obtained from MS2.
A noticeable observation is that revTPSS behaves closely as PBEsol. This can be understood from the explanation given in ref. GKresse13 . In metals, as the band started filling, the meta-GGA total charge density becomes the sum of several one-electron orbitals GKresse13 . Therefore, revTPSS becomes PBEsol like. But, the improved functionals like SCAN behaves more closely to PBE for Sc, Ti. But the SCAN functional reasonably underestimates the cohesive energies of V, and Cr, and overestimates for Fe to Zn. A different tendency is observed for TMTPSS and TM functionals. Both overestimates the cohesive energies noticeably.
transition metals : Unlike previous observation, the PBE functional underestimates the cohesive energies of transition metals. The PBEsol overestimates the cohesive energies of all metals except Nb. In this case, the TPSS predicts the best ME and MAE. The TPSS functional predicts reasonably good cohesive energies for Y, Zr, Tc, and Pd. For others, it underestimates or overestimates the values. In this case, also we observe that the revTPSS follows closely that of the PBEsol results. The M06L functional overall overestimates the cohesive energies except for few cases. The MS0, MS1 and MS2 functionals perform almost equivalently. The SCAN functional are also closely following the “MS” functionals. We observe that the TMTPSS and TM functionals show PBEsol like tendency. Here, the TM functional overestimates the cohesive energies more which are produced by TMTPSS.
transition metals : For transition metals also, the PBE performs quite reasonably. PBE overestimates the cohesive energies for Ta, and Ir but performs well for Hf, W, Re, Os, Pt, and Au. The PBEsol shows the same tendency as it is obtained in the cases of and elements. The TPSS functional enhances the PBE results, therefore, the increase in the MAE is observed compared to the PBE results. Here, the revTPSS also follows closely the PBEsol results. The M06L functionals overestimate the half fill transition metals but perform well for largely filled transition metals. In this case also the “MS” functionals perform equivalently, though the results of MS2 are found to be more enhanced than MS0 and MS1. In this case, the SCAN functional performs quite well compared to the TMTPSS and TM functionals. Both the TMTPSS and TM functional overestimate the results of all the metals, but the overestimation tendency is lesser than the SCAN functional.
Alkali metals : The alkali metals are often included in the benchmarking calculations for the different functionals for the semiconductor in predicting the cohesive energies. All the GGAs and meta-GGAs (except M06L) perform quite reasonably for the cohesive energies of alkali metals. The PBEsol and revTPSS show the best performance with MAE eV/atom. In this case, the “MS” functionals and SCAN perform equivalently. The TMTPSS and TM also predict the cohesive energies which are quite close to the experimental results.
Alkaline-earth metals : For alkaline-earth metals, PBE and TPSS perform quite remarkably. The PBE and TPSS show opposite tendency. PBE shows a small degree of underestimation (except Ca), whereas, TPSS shows a small degree of overestimation. The same behavior is observed for the case of PBEsol and revTPSS. In this case, also the “MS” functionals and SCAN perform equivalently. We observe a noticeable amount of overestimation in the performance of TMTPSS and TM functionals. The performance of SCAN functional is quite better compared to the TM based functionals.
Other transition metals : The cohesive energy of Mn is largely overestimated within all the GGA and meta-GGA functionals except MS0, MS1 and SCAN functionals. Overall the M06L, “MS” and SCAN functionals predict the best MAE for all these metals. The TM functional predicts very well cohesive energies for La and Hg. As usual the TM functional enhance the error of TMTPSS more. Unlike other transition metals, in this case, we observe that the revTPSS and PBEsol results deviate from each other.
Overall performances : Overall, the PBE performs quite reasonably for the cohesive energies. Within the meta-GGA functionals, the TPSS performs quite well and predicts the overall best MAE within the meta-GGAs. The PBEsol and revTPSS perform equivalently. We also obtain the same degree of overall ME and MAE using the M06L, MS0, MS1, MS2 and SCAN functionals. The TM functional deviates more from accuracy in predicting the cohesive energies of alkali, alkaline-earth, and transition metals. The errors obtained from the TM functional are often more enhanced than that of the TMTPSS functional.
| PBE | PBEsol | TPSS | revTPSS | M06L | MS0 | MS1 | MS2 | SCAN | TMTPSS | TM | ||
| TME | 3.8 | -0.6 | 3.1 | 0.8 | -1.7 | 2.6 | 2.7 | 1.2 | 1.2 | 1.1 | -0.1 | |
| Shortest | TMAE | 5.4 | 4.4 | 5.1 | 4.3 | 8.1 | 6.1 | 5.9 | 4.6 | 4.6 | 3.9 | 3.7 |
| Distances | TMAPE | 1.9 | 1.6 | 1.8 | 1.5 | 2.9 | 2.2 | 2.1 | 1.6 | 1.6 | 1.4 | 1.3 |
| rank | 8 | 4 | 7 | 3 | 11 | 10 | 9 | 4 | 4 | 2 | 1 | |
| TME | -1.9 | 18.3 | 15.8 | 24.1 | 5.4 | 25.6 | 19.3 | 23.4 | 21.5 | 17.9 | 21.5 | |
| Bulk | TMAE | 12.3 | 19.3 | 19.7 | 25.1 | 23.4 | 26.7 | 20.6 | 24.3 | 25.6 | 21.3 | 23.2 |
| Moduli | TMAPE | 7.6 | 11.8 | 12.1 | 15.4 | 14.4 | 16.4 | 12.6 | 14.9 | 15.7 | 13.1 | 14.2 |
| rank | 1 | 2 | 3 | 9 | 7 | 11 | 4 | 8 | 10 | 5 | 6 | |
| TME | -0.08 | 0.53 | 0.18 | 0.45 | 0.35 | 0.26 | 0.16 | 0.37 | 0.15 | 0.58 | 0.68 | |
| Cohesive | TMAE | 0.26 | 0.54 | 0.29 | 0.47 | 0.53 | 0.46 | 0.41 | 0.52 | 0.45 | 0.59 | 0.68 |
| Energies | TMAPE | 5.58 | 11.59 | 6.22 | 10.09 | 11.37 | 9.87 | 8.8 | 11.16 | 9.66 | 12.66 | 14.59 |
| rank | 1 | 9 | 2 | 6 | 8 | 5 | 3 | 7 | 4 | 10 | 11 | |
| Average rank | 3.3 | 5 | 4 | 6 | 8.7 | 8.7 | 5.3 | 6.3 | 6 | 5.7 | 6 |
IV Challenges of advance meta-GGA functionals
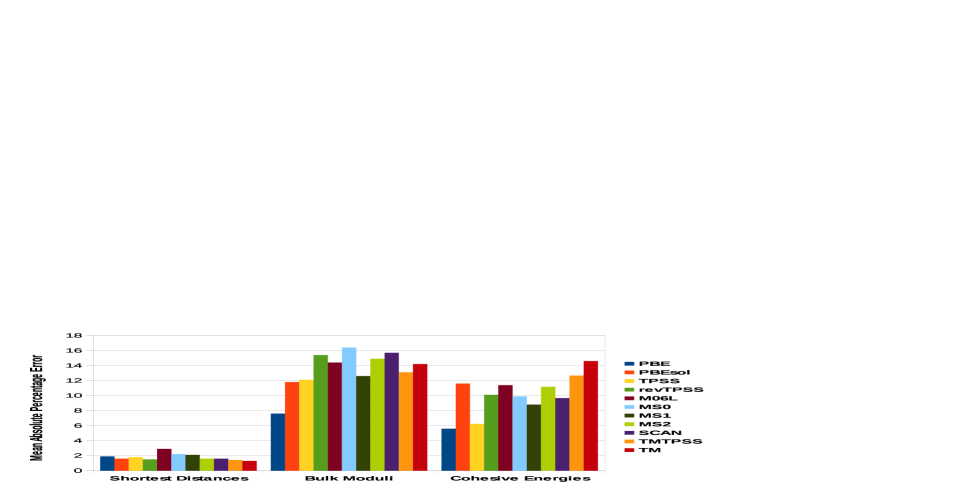
In TABLE IV we present the overall statistical analysis and ranking of each functional best on their performance. In Fig.(4), we present the mean absolute percentage of the individual functionals excluding the Mn, La and Hg. Based on these analyses it is indicative that simultaneously predicting both the structural and energetic properties of the transition metals within GGAs and meta-GGAs functionals possess great challenge. Meta-GGA functionals belong to the third rung of the Jacob’s ladder. Within the meta-GGAs, the SCAN and TM functionals considered as one of the most advanced functionals but the performance of those functionals do not show any improvement over the PBE functionals for the bulk moduli and cohesive energies. For the and transition metals, alkali metals and alkaline-earth metals the SCAN and TM functionals improve the performance but for the transition metals PBE performs better. The SCAN, M06L and TM functionals capture mid-range vdW interactions, which accounts improve performance for some systems but remain difficult for other systems. Especially, for alkali metals, the TMTPSS and TM functionals show improvement over PBE, M06L, and SCAN functionals. In the present study, we do not include any long-range corrected vdW interactions into the functionals form. The inclusion of the long-range corrected vdW interactions may improve the functional performance by including the long-range electron correlation effect.
V Conclusions
In this paper, we assess the performance of the recent meta-GGA density functionals along with the popularly used GGA based functionals for the lattice constants, bulk moduli and cohesive energies of alkali, alkaline-earth, and transition metals. The present paper is arranged by addressing the performance of the , , , alkali, alkaline-earth, and other transition metals. Due to the complicated structure of the Mn, La, and Hg, we discuss these three materials separately. Special attention has been paid to the performance on the recently proposed SCAN, TMTPSS and TM functionals. Based on these analysis, benchmark calculations and the level of deficiencies of all the functionals one conclude that:
(i) For the equilibrium shortest distances of the transition metals PBE results reasonably good compared to all other GGAs and meta-GGAs. For and transition metals, alkali, and alkaline-earth metals the PBE results are too large except few cases. The PBEsol and revTPSS follow essentially the identical results. The largest error is obtained from the M06L functional. The performance of MS0 and MS1 are identical, whereas, MS2 and SCAN closely follow each other in most of the cases. We obtain the best performance with the TM functional. The TM perform even better than SCAN in most of the cases except alkaline-earth metals. We found the performance of TMTPSS is quite close that of the TM functional for transition metals.
(ii) Regarding the bulk moduli, the PBE functional outperforms all other semilocal GGAs and meta-GGAs functionals in every case. Overall PBE underestimates the bulk moduli of transition metals, transition metals, alkali metals and alkaline-earth metals. For metals the PBE seems to overestimate the results. The bulk moduli of Mn is a difficult case for all the GGAs and meta-GGAs functionals. In this case, the revTPSS results also follows very closely the PBEsol results. The performance of all other meta-GGAs vary noticeably from the PBE results. Concerning the performance of TMTPSS and TM functional performance, both perform well then the SCAN functional.
(iii) In predicting the cohesive energies of all the metals, PBE outperforms all other functionals. Only for the alkali metals, the PBE results deviate from the experimental results. The revTPSS closely follow the PBEsol in all the cases. Overall consideration shows that the TM predicts the largest mean absolute error. Though in the case of the alkali metals, the TMTPSS and TM functionals perform quite well compared to the other cases, but overall both the functionals overestimate the cohesive energies. Overall, comparison of SCAN, TMTPSS and TM show that the SCAN functional performs better compare to the TMTPSS and TM functional in estimation the cohesive energies.
VI Acknowledgement
S. J. would like to acknowledge the financial support from the Department of Atomic Energy, Government of India. K.S. would like to acknowledge the financial support from the Department of Science and Technology, Government of India, during his summer intern in NISER.
References
- (1) W. Kohn and L. J. Sham, Phys. Rev. 140, A1133 (1965).
- (2) J. P. Perdew and A. Zunger. Phys. Rev. B, 23 5048, (1981).
- (3) J. P. Perdew and Y. Wang, Phys. Rev. B 33, 8800 (1986).
- (4) A. D. Becke, Phys. Rev. A 38, 3098 (1988).
- (5) C. Lee, W. Yang, and R. G. Parr, Phys. Rev. B 37, 785 (1988).
- (6) J. P. Perdew, J. A. Chevary, S. H. Vosko, K. A. Jackson, M. R. Pederson, D. J. Singh, and C. Fiolhais, Phys. Rev. B 46, 6671 (1992).
- (7) A. D. Becke, J. Chem. Phys. 104, 1040 (1996).
- (8) J. P. Perdew, K. Burke, and M. Ernzerhof, Phys. Rev. Lett. 77, 3865 (1996).
- (9) R. Armiento and A. E. Mattsson, Phys. Rev. B 72, 085108 (2005).
- (10) Z. Wu and R. E. Cohen, Phys. Rev. B 73, 235116 (2006).
- (11) Y Zhao, and D. G. Truhlar, J. Chem. Phys. 128, 184109 (2008).
- (12) J. P. Perdew, A. Ruzsinszky, G. I. Csonka, O. A. Vydrov, G. E. Scuseria, L. A. Constantin, X. Zhou, and K. Burke, Phys. Rev. Lett. 100, 136406 (2008).
- (13) L. A. Constantin, J. P. Perdew, and J. M. Pitarke, Phys. Rev. B 79, 075126 (2009).
- (14) E. Fabiano, L. A. Constantin, and F. Della Sala, Phys. Rev. B 82, 113104 (2010).
- (15) E. Fabiano, L. A. Constantin, and F. Della Sala, J. Chem. Theory Comput., 7 (11), pp 3548–3559 (2011).
- (16) L. A. Constantin, A. Terentjevs, F. Della Sala, P. Cortona, and E. Fabiano, Phys. Rev. B 93, 045126 (2016).
- (17) A. D. Becke and M. R. Roussel, Phys. Rev. A 39, 3761 (1989).
- (18) T. V. Voorhis and G. E. Scuseria, J. Chem. Phys. 109, 400 (1998).
- (19) Y. Zhao and D. G. Truhlar, J. Chem. Phys. 125, 194101 (2006).
- (20) J. Tao, J. P. Perdew, V. N. Staroverov, and G. E. Scuseria, Phys. Rev. Lett. 91, 146401 (2003).
- (21) J. P. Perdew, A. Ruzsinszky, G. I. Csonka, L. A. Constantin, and J. Sun, Phys. Rev. Lett. 103, 026403 (2009).
- (22) L. A. Constantin, E. Fabiano, and F. Della Sala, J. Chem. Theory Comput., 9 (5), pp 2256–2263 (2013).
- (23) J. Sun, B. Xiao, and A. Ruzsinszky, J. Chem. Phys. 137, 051101 (2012).
- (24) J. Sun, R. Haunschild, B. Xiao, I. W. Bulik, G. E. Scuseria, and J. P. Perdew, J. Chem. Phys. 138, 044113 (2013).
- (25) J. Sun, J. P. Perdew, and A. Ruzsinszky, Proceedings of the National Academy of Sciences of the United States of America, 112 (3) 685-689 (2015)
- (26) J. Sun, A. Ruzsinszky, and J. P. Perdew, Phys. Rev. Lett. 115, 036402 (2015).
- (27) J. Tao and Y. Mo, Phys. Rev. Lett. 117, 073001 (2016).
- (28) Y. Mo, G. Tian, R. Car, V. N. Staroverov, G. E. Scuseria, and J. Tao, Phys. Rev. B 95, 035118 (2017).
- (29) Y. Mo, G. Tian and J. Tao, Chem. Phys. Lett. 628, 3842 (2017).
- (30) A. E. Mattsson, R. Armiento, J. Paier, G. Kresse, J. M. Wills, and T. R. Mattsson, J. Chem. Phys. 128, 084714 (2008).
- (31) J. Sun, M. Marsman, A. Ruzsinszky, G. Kresse, and J. P. Perdew Phys. Rev. B 83, 121410(R).
- (32) J. Sun, M. Marsman, G. I. Csonka, A. Ruzsinszky, P. Hao, Y. S. Kim, G. Kresse, and J. P. Perdew, Phys. Rev. B 84, 035117 (2011).
- (33) A. Patra, J. E. Bates, J. Sun, and J. P. Perdew, Proceedings of the National Academy of Sciences, 114, 44, E9188-E9196 (2017).
- (34) P. Janthon, S. M. Kozlov, F. Vines, J. Limtrakul, and F. Illas, J. Chem. Theory Comput. 9, 1631-1640 (2013).
- (35) P. Janthon, S. (Andy) Luo, S. M. Kozlov, F. Vines, J. Limtrakul, D. G. Truhlar,and F. Illas, J. Chem. Theory Comput. 10, 3832-3839 (2014).
- (36) P. Haas, F. Tran, and P. Blaha, Phys. Rev. B 79, 085104 (2009).
- (37) F. Tran, J. Stelzl, and P. Blaha, J. Chem. Phys. 144, 204120 (2016).
- (38) G. I. Csonka, J. P. Perdew, A. Ruzsinszky, P. H. T. Philipsen, S. Lebègue, J. Paier, O. A. Vydrov, and J. G. Ángyán, Phys. Rev. B 79, 155107 (2009).
- (39) L. Schimka, R. Gaudoin, J. Klimes, M. Marsman, and G. Kresse, Phys Rev B 87, 214102 (2013).
- (40) P. Hao, Y. Fang, J. Sun, G. I. Csonka, P. H. T. Philipsen, and J. P. Perdew, Phys. Rev. B 85, 014111 (2012).
- (41) G. Zhang, A. M. Reilly, A. Tkatchenko, and M. Scheffler, New J. Phys. 20 063020 (2018).
- (42) S. Jana, A. Patra, and P. Samal, (to be appeared), J. Chem. Phys. (2018).
- (43) P. E. Blöchl, Phys. Rev. B, 50:17953, (1994).
- (44) G. Kresse and D. Joubert, Phys. Rev. 59 , 1758 (1999).
- (45) G. Kresse and J. Hafner, Phys. Rev. B 47 , 558 (1993); ibid. 49 , 14 251 (1994).
- (46) G. Kresse and J. FurthmAller, Comput. Mat. Sci. 6 , 15 (1996).
- (47) G. Kresse and J. FurthmAller, Phys. Rev. B 54 , 11 169 (1996).
- (48) G. Kresse and J. Hafner, J. Phys.: Condens. Matt. 6, 8245 (1994).
- (49) J. Tao, J. P. Perdew, and A. Ruzsinszky, Phys. Rev. B 81, 233102 (2010).
- (50) F. D. Murnaghan, Proc. Natl. Acad. Sci. U.S.A. 30, 244 (1944).
- (51) A. B. Alchagirov, J. P. Perdew, J. C. Boettger, R. C. Albers, and C. Fiolhais, Phys. Rev. B 63, 224115 (2001).
- (52) A. B. Alchagirov, J. P. Perdew, J. C. Boettger, R. C. Albers, and C. Fiolhais, Phys. Rev. B 67, 026103 (2003).
- (53) F. Birch, Phys. Rev. 71, 809 (1947).