Chromodynamical Analysis of Lenticular Galaxies using Globular Clusters and Planetary Nebulae
Abstract
Recovering the origins of lenticular galaxies can shed light on the understanding of galaxy formation and evolution, since they present properties that can be found in both elliptical and spiral galaxies. In this work we study the kinematics of the globular cluster (GC) systems of three lenticular galaxies located in low density environments (NGC 2768, NGC 3115 and NGC 7457), and compare them with the kinematics of planetary nebulae (PNe). The PNe and GC data come from the Planetary Nebulae Spectrograph and the SLUGGS Surveys. Through photometric spheroid-disc decomposition and PNe kinematics we find the probability for a given GC to belong to either the spheroid or the disc of its host galaxy or be rejected from the model. We find that there is no correlation between the components that the GCs are likely to belong to and their colours. Particularly, for NGC 2768 we find that its red GCs display rotation preferentially at inner radii (). In the case of the GC system of NGC 3115 we find a group of GCs with similar kinematics that are not likely to belong to either its spheroid nor disc. For NGC 7457 we find that of its GCs are likely to belong to the disc. Overall, our results suggest that these galaxies assembled into S0s through different evolutionary paths. Mergers seem to have been very important for NGC 2768 and NGC 3115 while NGC 7457 is more likely to have experienced secular evolution.
keywords:
Galaxies: evolution, galaxies: formation, galaxies: kinematics and dynamics, galaxies: elliptical and lenticular, cD, galaxies: star clusters: general, methods: statistical1 Introduction
The morphological evolution of galaxies is an interesting and challenging topic in contemporary astrophysics, where lenticular (S0) galaxies play a central role. The morphology-density relation (Dressler, 1980; Dressler et al., 1997; Goto et al., 2003; Postman et al., 2005) and the increase of the number of S0 galaxies at lower redshift, at the expense of the decrease in the number of spiral galaxies in clusters of galaxies (Dressler & Sandage, 1983; Whitmore et al., 1993), led to the idea that S0 galaxies might be the evolutionary products of the transformation of spiral galaxies (Larson et al., 1980). Such evolution would have been driven by environmental effects such as ram pressure stripping, galaxy harassment, mergers, starvation and alike (Gunn & Gott, 1972; Abadi et al., 1999; Boselli & Gavazzi, 2006). Lenticular galaxies, however, are present in all environments (cluster, groups and field) (van den Bergh, 2009). This widens the evolutionary possibilities for creating a lenticular galaxy and raises questions about their uniqueness as a class: could they be the single final product of a variety of events (Gunn & Gott, 1972; Byrd & Valtonen, 1990; Quilis et al., 2000; Bekki et al., 2005; Bournaud et al., 2005; Aragón-Salamanca, 2008)?
One proposed scenario is that S0 galaxies may form from spiral galaxies which underwent some form of environment-related process and lost most of their gas and spiral structures. These processes therefore would leave behind a disc structure alongside the spheroidal structure of the bulge and halo (Gunn & Gott, 1972; Aragón-Salamanca, 2008; Quilis et al., 2000; Byrd & Valtonen, 1990; Bekki et al., 2005; Bournaud et al., 2005). Such scenario would leave the stellar kinematics of the resulting S0 galaxy almost unperturbed, in comparison with the kinematics of the progenitor spiral galaxy (Aragón-Salamanca et al., 2006; Buta et al., 2010; Cortesi et al., 2013). On the other hand, S0 galaxies have been suggested to also be formed from mergers between galaxies of unequal mass, which would cause an increase in random motions in the stars (Borlaff et al., 2014; Bournaud et al., 2005; Querejeta et al., 2017). Bekki et al. (2005) have shown through simulations that merger events that are able to produce flattened early-type galaxies also are likely to affect the structure and kinematics of the globular cluster (GC) systems associated with such galaxies. Moreover, clumpy disc formation is proposed as a way to form galaxy discs through successive mergers of star-forming clumps (van den Bergh et al., 1996; Elmegreen & Elmegreen, 2005; Shapiro et al., 2010; Genzel et al., 2011; Ceverino et al., 2015; Garland et al., 2015; Fisher et al., 2017). In fact, simulations such as the ones from Shapiro et al. (2010) and Fisher et al. (2017) show that the formation of GCs in such condition would happen around 1-3. Therefore such mechanism could be detected through the kinematics of GCs which would acquire rotation and display disc-like kinematics, even in the halo (Inoue, 2013).
About 90% of the total mass and angular momentum of a galaxy resides outside one effective radius (Romanowsky & Fall, 2012). By exploring the outer regions of galaxies one may find imprints of their merger histories, and is therefore able to investigate the processes responsible for the build-up of its present mass. However, due to the low surface brightness, galaxy outskirts are expensive to probe. Fortunately, tracers such as globular clusters (GCs) and planetary nebulae (PNe) stand as ideal proxies for the study of the kinematics of such regions (Hui et al., 1995; Coccato et al., 2009; Forbes et al., 2012; Brodie et al., 2014).
GCs and PNe can be detected out to 5-10 in early-type galaxies. PNe present a strong emission in the [OIII] line (5007 Å), which allows one to detect them in regions where the galaxy starlight is very faint. The Planetary Nebulae Spectrograph (PN.S, Douglas et al. (2002)) observed several early-type galaxies, creating catalogues with an average number of over a hundred PNe per galaxy. As shown in Cortesi et al. (2011), this number is enough to recover the stellar kinematics of the galaxy disc and spheroid, since PNe are reliable tracers of the global stellar population of their host galaxy (Coccato et al., 2009; Cortesi et al., 2011). Globular clusters are ubiquitous in early-type galaxies and in the past two decades GC radial velocity catalogues have been acquired for several systems with multi-object spectroscopy in 10m class telescopes (eg. Hanes et al. (2001), Côté et al. (2003), Hwang et al. (2008), Park et al. (2012), Pota et al. (2013) and Forbes et al. (2017)).
The present work analyses the GC systems of three lenticular galaxies in low density environments (NGC 2768, NGC 3115 and NGC 7457) following the method presented in Cortesi et al. (2016) for the GC system of NGC 1023. Such study used PNe kinematics derived in Cortesi et al. (2011, 2013).
This paper is structured as follows: in section 2 we present an overview of the observational data used in this work and the individual galaxies’ general properties.
In section 3 we briefly discuss the method used for probing GC kinematics using GALFIT (Peng et al., 2002), maximum likelihood estimation (MLE) and the kinematics of PNe. In section 4 we present the results on GC kinematics, in addition to considerations on 1D phase-space diagrams and the radial distribution of GCs and PNe for our sample galaxies. In section 5 we discuss the results in comparison with the evolutionary paths proposed in the literature for lenticular galaxies. Summary and conclusions are shown in section 6.
2 Data
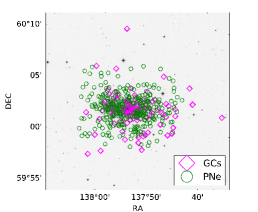
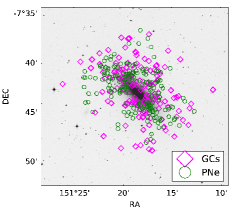
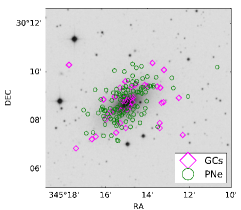
In this work, we use spectroscopic and photometric data from GCs and PNe to model the kinematics of a sample of three nearby S0 galaxies. We have selected three non-cluster galaxies so that we could probe their formation mechanisms independently of any process commonly found in high-density environments (e.g. ram pressure stripping). In Table 1 we present the size of the globular cluster and planetary nebula samples, for each galaxy. The spatial distribution of the spectroscopic data is shown on Fig. 1. Additionally, in this section we describe the sources of the data and briefly discuss the galaxies’ basic properties.
2.1 Globular Clusters
The GC photometric and spectroscopic data analysed in this work comes from The SAGES Legacy Unifying Globulars and GalaxieS (SLUGGS) Survey111http://sluggs.swin.edu.au/Start.html (Brodie et al., 2014; Forbes et al., 2017). SLUGGS is a wide-field spectroscopic and photometric survey of early-type galaxies undertaken using mainly the Subaru/Suprime-Cam imager and the Keck/DEIMOS spectrograph from the Keck-II-Telescope (Faber et al., 2003). SLUGGS goals revolve around studying the outer regions of early-type galaxies, where stellar light is faint. The survey has deep gri imaging and spectroscopy around 8500 Å of 25 nearby early-type galaxies.
The photometric data of all galaxies studied in this work have been described in Pota et al. (2013). The data for NGC 2768 is a combination of Suprime-Cam/Subaru in the filters and the Advanced Camera for Surveys (ACS) from the Hubble Space Telescope (HST).
NGC 3115 data are described in detail in Arnold et al. (2014).The photometric data for this galaxy was obtained with the Subaru/Suprime-Cam in the gri filters.222Additional spectra for NGC 3115 are from the LRIS instrument on the Keck-I-Telescope (Oke et al., 1995) and the IMACS instrument from the Magellan telescope (Dressler et al., 2011).
The photometric GC data for NGC 7457 included in SLUGGS comes from Hargis et al. (2011), obtained from observations in the BVR filter with the WIYN/MiniMo imager (Saha et al., 2000). Hargis et al. (2011) also obtained spectroscopy for a sample of 20 NGC 7457 GCs, although in this work we use an updated and larger spectroscopic sample for this galaxy’s GCs obtained with the Keck/DEIMOS spectrograph and published in Forbes et al. (2017). This new sample has spectroscopy for 40 GCs, which doubles the previously studied spectroscopic sample.
2.2 Planetary Nebulae
The PNe data for the galaxies studied in this work were obtained with The Planetary Nebulae Spectrograph (PN.S, Douglas et al. (2002)). We also make use of the PNe kinematics obtained in Cortesi et al. (2013) for the galaxies of our sample. The PN.S is a dedicated instrument mounted at the William Herschel Telescope (WHT) in La Palma, Spain. The instrument detects PNe using a technique based on counter-dispersed imaging (CDI), which enables us to obtain velocities and positions for PNe at the same time.
| Galaxy | Photom. | Spec. | |
|---|---|---|---|
| NGC 2768 | 978 | 106 | 315 |
| NGC 3115 | 781 | 150 | 188 |
| NGC 7457 | 536 | 40 | 112 |
2.3 Galaxies
General properties of the galaxies studied in this work are presented in Table 2. In this section we further discuss some of their features found in previous works.
| Galaxy | Dist. (Mpc) | (km/s) | (km/s) | env. | morph. | Age (Gyr) | (kpc) | (M) | B/T | |
|---|---|---|---|---|---|---|---|---|---|---|
| NGC 1023 † | 11.1 | 602 | 183 | 0.63 | F | S0 | 12.3 | 2.58 | 10.99 | 0.53 |
| NGC 2768 | 21.8 | 1353 | 206 | 0.57 | G | E/S0 | 12.3 | 6.37 | 11.21 | 0.71 |
| NGC 3115 | 9.4 | 663 | 248 | 0.66 | F | S0 | 9.0 | 1.66 | 10.93 | 0.74 |
| NGC 7457 | 12.9 | 844 | 74 | 0.47 | F | S0 | 3.8 | 2.13 | 10.13 | 0.30 |
† GCs and PNe kinematic analysis for this galaxy was done in Cortesi et al. (2016) with the same method used in this work.
2.3.1 NGC 2768
NGC 2768 is a group galaxy classified as an E6 by de Vaucouleurs et al. (1991) and as an S0 1/2 by Sandage & Bedke (1994), located at a distance of about 22 Mpc from us (Tully et al., 2013) in the direction of the constellation of Ursa Major. It is part of the small Lyon Group of Galaxies 167 (Garcia, 1993), and has traces of ionised gas and a dust lane along the minor axis (Kim, 1989). It is interesting to add that the ionised gas havs been found to have different kinematics than the stars in the inner regions of the galaxy (Fried & Illingworth, 1994). Pota et al. (2013) found a bimodal distribution in colour for the sample of 978 GCs used in this work with a separation at mag, obtained with KMM (Ashman et al., 1994).
The GC system of this galaxy has been previously studied by Pota et al. (2013), who found rotation for the red GCs and negligible rotation for the blue sub-population. Forbes et al. (2012) focused on the red GCs and found that this sub-population follows the radial surface density profile of the galaxy light and is compatible with the kinematics of the bulge component.
2.3.2 NGC 3115
NGC 3115 is the closest S0 galaxy to the MW, with a distance of 9.4 Mpc (Cantiello et al., 2014) and shows the clearer GC colour bimodality of our sample (Brodie et al., 2012; Pota et al., 2013; Cantiello et al., 2014; Arnold et al., 2014). Pota et al. (2013) found a colour separation of photometric GCs at mag.
This galaxy is located in the field (Brodie et al., 2014) and displays many interesting morphological structures, such as faint remnant spiral structures proposed by Norris et al. (2014) and re-detected recently using VLT/MUSE spectroscopy by Guérou et al. (2016). It has two faint companion galaxies (Doyle et al., 2005).
2.3.3 NGC 7457
NGC 7457 is a field S0 galaxy (Brodie et al., 2014) with a distance of 12.9 Mpc (Alabi et al., 2017). In contrast with the other galaxies in this sample, it shows no signs of bimodality in its GC population (Hargis et al., 2011; Pota et al., 2013). Previous studies of this galaxy also proposed a counter-rotating galaxy core (Sil’chenko et al., 2002) and a possible major merger origin (Hargis et al., 2011). Furthermore, it presents the smallest amount of GCs of all galaxies in the sample, with a total number of 30 GCs (Hargis et al., 2011).
3 Methods and Analysis
In most galaxies, GCs can be separated into two sub-populations based on optical colour and metallicity, namely a red metal-rich population and a blue and metal-poor one. Different scenarios were proposed to explain the evolution of such sub-populations within an evolving galaxy, such as blue GCs being commonly found in the halo (Forbes et al., 1997), while red GCs are likely associated with the bulge, since they formed in a later phase along with the spheroidal component or migrated towards the centre of the galaxy after the gas-rich phase of galaxy evolution (Shapiro et al., 2010). By studying the GC kinematics we can find signatures of their origins, if they show a disc or spheroid-like behaviour. To reach this goal we need to recover the probability for every GC to belong to the galaxy as modelled with PNe, and to a given galaxy component. In this section we will describe all the steps needed to retrieve these probabilities.
3.1 Spheroid-disc Decomposition and Photometric Probabilities

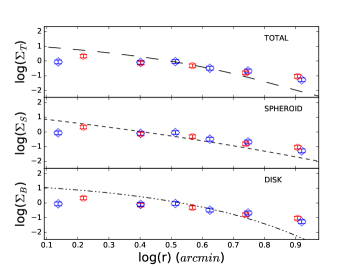
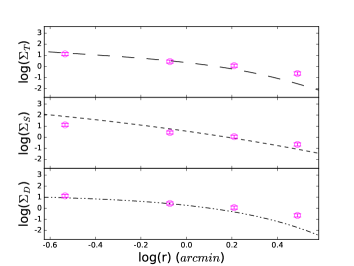
Cortesi et al., (2013) performed a photometric decomposition of the light of the galaxies in our sample, using a model comprising a disc and a spheroidal component (i.e., bulge and halo) and K-band images from the 2MASS catalogue (Skrutskie et al., 2006). Using these results, we compare the light profiles of these galaxies with the radial number density of their associated GCs, as shown in Fig. 2. For NGC 2768 and NGC 7457, GC radial number densities follow reasonably well, within errors, the light profiles of the galaxies and of their components. In the case of NGC 3115, there is, however, a less obvious compatibility between GC density and the spheroid radial light profile. While the inner discrepancy might be due to incompleteness, i.e. the GCs get lost against the galaxy light in the central regions, at large radii, such difference might arise from treating the halo and the bulge as a single component in the model.
In general, a disc and a spheroidal component are a good approximation to model the light of S0 galaxies. It is to be noted, nevertheless, that some galaxies have slightly more complex structures, and that the images used for the decomposition might be too faint to account for the halo component of the galaxy. Therefore, such a decomposition is prone to several systematic uncertainties and multiple approaches, such as the ones in Savorgnan & Graham (2016) for NGC 1023 and NGC 3115. For the purpose of studying the kinematics of GC systems and PNe, the decomposition performed in Cortesi et al. (2013) is reasonable enough.
With the spheroid-disc light decomposition recovered in Cortesi et al., (2013), we also obtain preliminary photometric probabilities, , for each tracer to belong to the spheroid model. We create an image dividing the spheroid by the total model of the galaxy light and we calculate the flux at the location of every GC in such image, within a circular aperture of radius equal to 3 pixels. To obtain the final probabilities of a GC to belong to the spheroid or the disc we combine with the the GCs’ kinematics, which will account for possible degeneracy or lack of precision of the photometric model (Cortesi et al., 2011) (see Section 3.3).
3.2 Kinematics
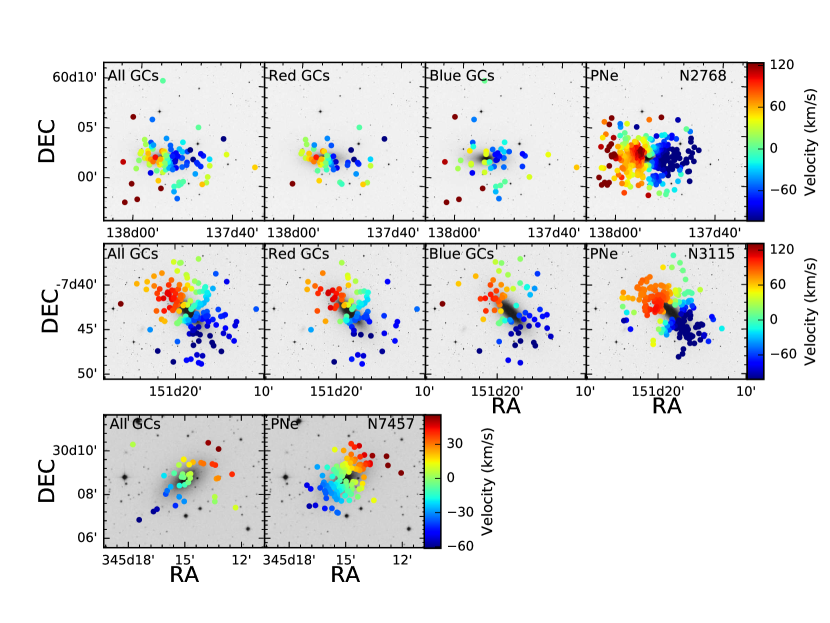
In Fig. 3 we show the smoothed velocity maps for the GC systems, obtained using Adaptive Kernel Smoothing (see Coccato et al. (2009) for details on using the technique). We detect clear rotation as measured from the GC systems for all galaxies. For NGC 3115 this is true for both red and blue sub-populations, while we can notice that for the case of NGC 2768 the rotation is supported by the inner red GCs.
To recover the kinematics of the GC and PNe systems of the galaxies in this work, we use Maximum Likelihood Estimation to find the best-fitting kinematic parameters, , assuming a Gaussian velocity distribution for its GCs or PNe populations:
| (1) |
where are the velocities of the discrete tracers, is the galaxy line-of-sight velocity, is the fitted rotation velocity and is the fitted dispersion velocity. We bin the data in elliptical annuli with the same ellipticity of the disc component for each galaxy (see Table 2), and with approximately the same number of objects in every bin. In this way, we recover the kinematic profile with radius. Moreover, we iterate the MLE fit until all objects are within the 2.3 confidence interval, discarding outliers in each run. This ensures the robustness of the fit even when dealing with a possible significant number of outliers (for example, accreted GCs).
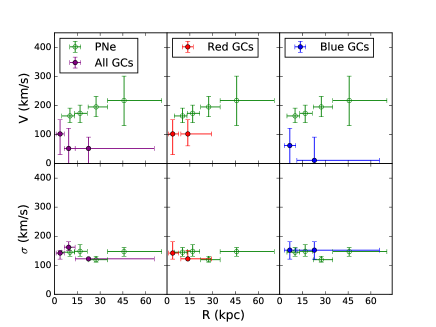
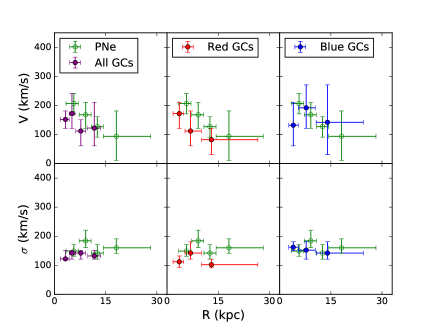
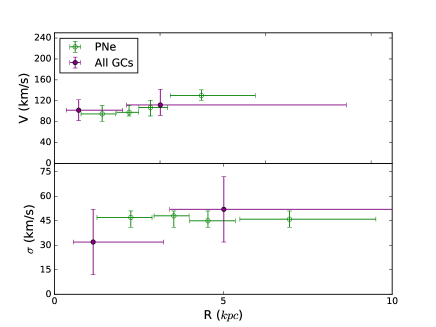
In Fig. 4 we present the results of the likelihood analysis for GCs and PNe. As far as the rotational velocity is concerned, the galaxies have very distinct profiles: NGC 2768 has strong kinematic discrepancies between its GC colour sub-populations, with red GCs showing rotation around 100 km/s and blue GCs showing negligible rotation. The rotational velocity of the GCs in NGC 3115 decreases with radius consistently and independently of colour, as found for NGC 1023 in Cortesi et al. (2016). For this galaxy, we also note that the rotational velocities of the PNe and GCs are consistent, despite the aforementioned model limitations. Lastly, the GCs of NGC 7457 show a flatter rotational profile for both GCs and PNe. For the velocity dispersion, all galaxies show good agreement between PNe and GCs. This is expected since they share the same gravitational potential.
3.3 Final probabilities using photometry and PNe kinematics
In this section we summarise the method introduced by Cortesi et al. (2016), and refer the reader to such work for further details.
In Cortesi et al., (2013), the kinematics of the bulge and the disc of the galaxies in this work were modelled using a MLE fitting of the PNe velocity field. Using such kinematic models we can derive the probabilities that every GC belongs to the galaxy disc or spheroid, solving the following equation:
| (2) |
where are the individual GC velocities, is the galaxy rotational velocity as derived from PNe, and are the line-of-sight velocity and dispersion velocity, respectively. The radial and azimuthal components of the velocity dispersion of the disc component are given by and , while is the dispersion velocity for the spheroid component (also derived from PNe). The values are the probabilities obtained in Section 3.1 for every GC to belong to the galaxy spheroid component based on photometry only.
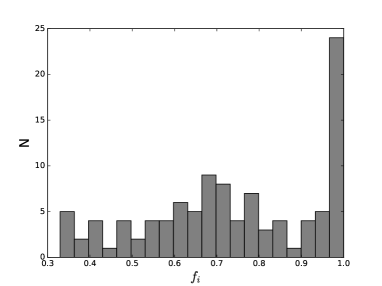
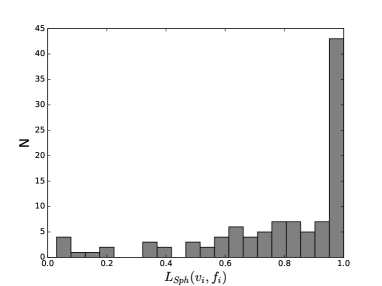
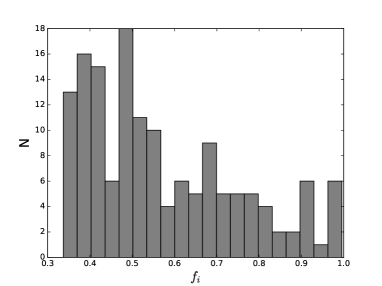
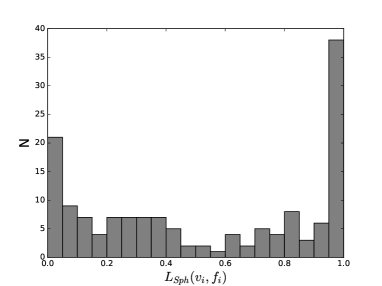
In Fig. 5, we show the recovered probabilities of the GCs to belong to the spheroid, , obtained normalising the first term on the right side of equation 2, in comparison with the probabilities to belong to the spheroid retrieved from the photometry only, . We notice a decrease in probability values around 0.5 present in the histogram that show probabilities obtained from photometry only, in comparison with the probabilities obtained with photometry and kinematics. This shows the core improvement of the MLE method over the photometric probability approach justifying our choice of a simple bulge-disc decomposition.
We calculate the total number of GCs that belong to the galaxy disc or spheroid by summing-up the probabilities and the total number of disc GCs is obtained summing (1-). These values are outlined in Table 3, for the total, red and blue sub-populations.
Moreover, the likelihood fit also offers us the advantage of detecting objects that are outliers, i.e., not likely to be compatible with the host galaxy kinematics, as traced by PNe in Cortesi et al., (2013). We set the likelihood threshold at 2.3 (see Cortesi et al. (2016)). Within the entire GC spectroscopic sample, such objects account for 10 GCs in NGC 2768, 32 GCs in NGC 3115 and 4 GCs in NGC 7457. This means that 21.5% of NGC 3115 GCs are not likely to be compatible with the galaxy model (previously obtained with PNe and the K-band image). Therefore we can explain such objects in two ways. One possibility is that they might have been recently accreted. Another option is that they might just belong to the galaxy halo, which is not separately included in this study, but is treated together with the bulge as a single spheroidal component. Nevertheless, this number of rejected objects in NGC 3115 is a higher amount than the 9.4% rejected objects in NGC 2768 and 10% in NGC 7457.
4 Results
4.1 Colour and Kinematics
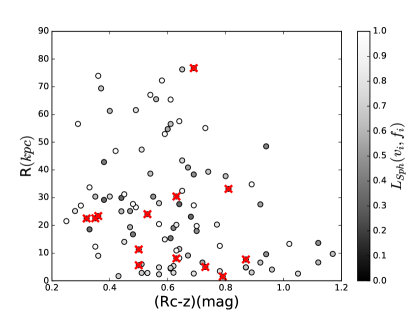
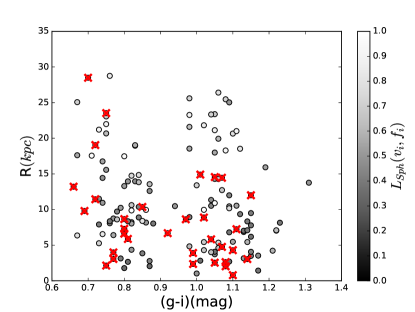
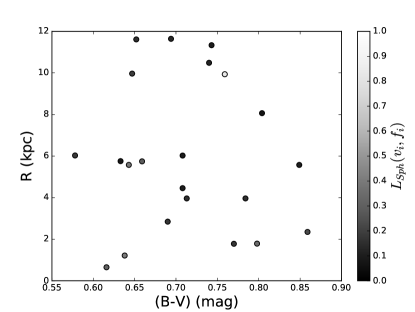
In Fig. 6 we show the radial distribution of GCs versus their colours, colour coded according to their probability of belonging to the spheroid, .
Figure 6 clearly shows that we are looking at three galaxies with very distinct GC systems. As mentioned in Section 2, NGC 3115 is clearly bimodal in colour, similarly to NGC 2768, while NGC 7457 shows no bimodality in colour for its GCs. Moreover, for NGC 2768 17% of GCs are associated with the disc component while NGC 3115 has a similar number of disc-like and spheroid-like GCs, and NGC 7457 has 15% GCs associated with the spheroid component. We find no correlation between the colours of the GCs and their kinematics, since in NGC 2768 both the populations of red and blue GCs have spheroid-like kinematics 333See discussion in section 3.3 and Fig.4 about differences between the red and blue GCs kinematics regarding the rotation profiles. In NGC 3115 there are blue and red GCs associated with both the spheroid and the disc. For NGC 7457, the GC system does not appear bimodal neither in colour nor kinematics. For comparison, NGC 1023 have 19 red and 18.6 blue GCs belonging to the disc, along 13 red and 25.4 blue GCs belonging to the spheroid (Cortesi et al., 2016). On the other hand, we notice that most of the GCs that are more likely to have disc-like kinematics are located in the inner regions of the galaxies, within 10 kpc. It is possible, however, to find some disc-like GCs at larger radii (). For all galaxies, rejected GCs are scattered in the plot, suggesting no correlation among colour, kinematics and radius. Those objects will be discussed in more detail in the following section.
| Galaxies | Disc | Spheroid | ||||
| Red GCs | Blue GCs | Total | Red GCs | Blue GCs | Total | |
| NGC 2768 | 14.8 | 10.0 | 24.8 | 40.2 | 27.9 | 68.1 |
| NGC 3115 | 26.8 | 21.4 | 48.2 | 37.2 | 31.5 | 68.7 |
| NGC 7457 | - | - | 27.3 | - | - | 8.8 |
4.2 1D phase-space diagrams
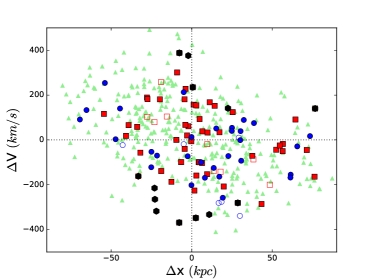
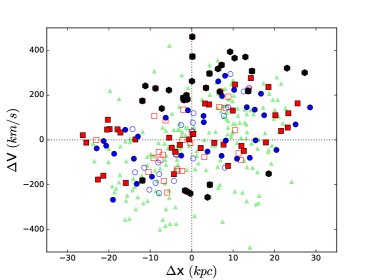
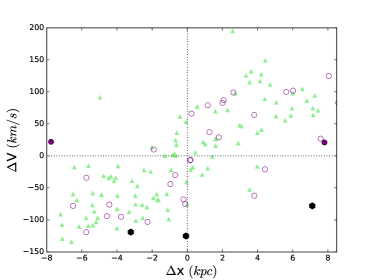
It is interesting to combine 1D phase-space diagrams of the GCs with the information obtained from their recovered probabilities of being associated with the disc or the spheroid. In Fig. 7 we use the quantity , where is the systemic velocity of a given galaxy, as listed in Table 2, versus galactocentric radius and in Fig. 8 , the projected distance along the galaxy’s major axis. We overplot the PNe for comparison.
In the 1D phase-space diagrams, GCs that are bound to the system create a ’bell shaped’ pattern (see Rocha et al. (2012)). Spheroid-like objects would lie approximately along the line where , since they have no net rotation, just a natural scatter due to their hot kinematics. On the other hand, disc objects, due to their larger rotational velocities, would show up symmetrically around the galaxy’s systemic velocity. Moreover, the broader the distribution around the systemic velocity of the galaxy, the higher the random motions. For instance, objects recently accreted onto the system would generally lie at the outer part of the distribution given that they may not have reached equilibrium yet, with respect to its new host galaxy kinematics (see also Rhee et al. (2017)).
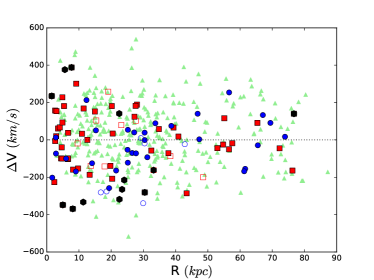
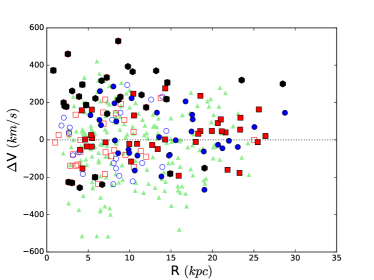
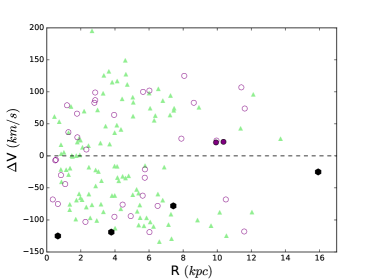
Fig. 7 shows the 1D phase-space diagrams for NGC 2768, NGC 3115 and NGC 7457. We divide the GCs between disc and spheroid using a value of . Note that there is a concentration of red GCs towards the centre of NGC 2768, within 1 (6.37 Kpc) Fig. 7 (a). However, as seen in Fig. 6 (a), both red and blue sub-populations show high probabilities of belonging to the spheroid. Forbes et al. (2012) when studying this galaxy kinematics, specifically looking into its red GC population, found that it is related to the kinematics of the galaxy’s spheroid. Therefore, it is reasonable to say that, as blue GCs in this galaxy have a high probability of being in the spheroid and are generally not present at the same radii as the red GCs, they are likely located predominantly in the halo.
In the 1D phase-space diagram for GCs and PNe of NGC 3115, Fig. 7 (b), one can see a transition from disc-like GCs to spheroid-like GCs with radius. Rejected objects (black markers) from the likelihood analysis also display an interesting distribution in the diagram. Most of them have similar values of , around 200 km/s.
These GCs might form a group that could have an ex-situ origin.
For NGC 7457, by analysing Fig. 7 (c), we see a more compact distribution of GCs and PNe in the phase-space diagram if compared to panels (a) and (b), with objects showing values of 200 km/s. NGC 2768 and NGC 3115 have GCs with values of in the range of 600 km/s, therefore, NGC 7457 shows lower velocity dispersion, as expected given the recovered kinematics (see Fig.4). GCs and PNe have a high probability of belonging to the disc of the galaxy and share the same loci in this plot. They show a ’U’ shaped distribution. This shape might be due to the very low number of GCs and PNe with hot kinematics, consistent with the galaxy being disc dominated (Cortesi et al., 2013). This galaxy seems to generally lack a hot kinematic component in its outer regions, beyond around 2 , quite differently from NGC 2768 and NGC 3115 which have, in fact, more prominent bulges and are more massive than NGC 7457.
In addition to Fig. 7, it is interesting to analyse the distribution of the velocities of the tracers versus the projected distance along the major axis of the host galaxies, see Fig. 8. The rejected GCs of NGC 3115 show interesting properties. In fact, they seem to form a coherent structure, reinforcing what was found in Fig. 7.
Finally, NGC 7457 shows a strong disc-like shaped distribution in Fig. 8, both for PNe and GCs. This was already expected given the rotation profiles in Fig. 4, where PNe and GCs show similar kinematics.
5 Discussion
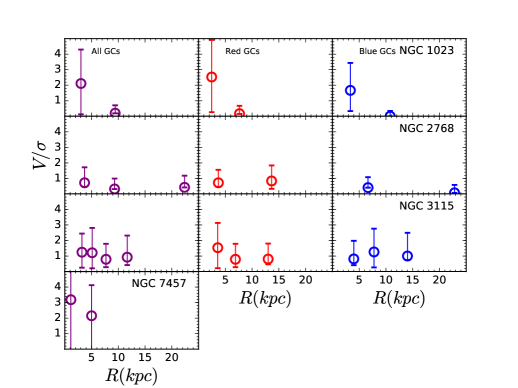
In this section, we analyse the GC rotation profiles and the ratio of the GCs and we compare our results with simulations. The quantity can be used as an indicator of how much the kinematics of a galaxy’s GC system is dominated by rotational velocity, in the case of values higher than 1, or is more influenced by random motions, in the case of a ratio smaller than 1.
Bekki et al. (2005) studied with dissipationless numerical simulations the outcome of various merger scenarios on the GC kinematics of early-type galaxies. They showed that mergers with a proportion of 10:1 are able to produce flattened early-type galaxies, such as lenticulars, and they would impact the kinematics of GCs in such a way that their rotation at large radii would be weaker than at small radii. Bournaud et al. (2005) showed that minor mergers with a proportion of 4.5:1 would produce a stellar disc with for the remnant galaxy and a merger with a proportion of 10:1, such as the ones Bekki et al. (2005) studied, would produce a stellar disc with . Besides a major merger event 444Bekki et al. (2005) considers mergers with galaxies of masses in the proportion of 4.5:1 as major mergers., another likely path on the evolution of galaxies is a sequence of minor mergers. On the other hand, Moody et al. (2014) showed that multiple minor mergers would not produce fast rotating galaxies (Emsellem et al., 2011), but instead would be more likely to produce hot, elliptical and slow rotating galaxies.
In Fig. 9 we show the ratios obtained from the GC sub-populations using the method described in Sec. 3 and the results from Fig. 4. One can see that the values of for NGC 3115 are close to or smaller than 1 for both GC sub-populations and for all radii, which would support the scenario in which this galaxy is a remnant of a merger event where the masses involved follow at least a 4.5:1 proportion. This merger would not have been strong enough to rip the disc structure of the galaxy apart, but would be significant enough to accelerate the gas removal or consumption within the galaxy.
The signs of remnant spiral star forming structures hypothesised by (Norris et al., 2006; Guérou et al., 2016) support this formation scenario, where the progenitor of NGC 3115 was a spiral galaxy that later merged with a smaller companion. In Cortesi et al. (2016), it was argued that for NGC 1023 the ratio between the rotation velocity and the velocity dispersion in the azimuthal direction is not compatible with a faded spiral galaxy. It was, instead, suggested that NGC 1023 formed at redshift , through the merger of clumps (Inoue, 2013). If one compares Fig. 6 of Cortesi et al. (2016) with Fig.4 of this work it is notable the similarity between the red GCs of NGC 3115 and NGC 1023. Hence clumpy disc formation can also be a scenario to explain the kinematics of the red GC population and the higher fraction of GCs with disc-like kinematics in NGC 3115. Nevertheless, NGC 3115 has a higher B/T ratio when compared to NGC 1023 (Cortesi et al., 2016). Thus, this galaxy is more consistent with having gone through a series of minor mergers (see also Arnold et al. (2014)).
The results for NGC 2768 point to a very different scenario compared to the other three galaxies.
Forbes et al. (2012) argued that the radial distribution of the ratio of red GCs in this galaxy is similar to the one of spheroid PNe and stars, as found in spiral galaxies. Furthermore, we find that for the GCs the ratio is at all radii, independently of the sub-population considered. According to Bekki et al. (2005) such values of are the result of a 4.5:1 merger, which is consistent with the galaxy having a more prominent spheroidal structure and a high amount of GCs associated with its spheroid.
Although we are not able to set a single hypothesis for the origin and evolution of NGC 2768, it is clear from our results that its origin differs from that of NGC 3115 and NGC 1023.
NGC 7457 is a peculiar galaxy, since, unlike the others in the sample, of the GCs are located in the disc. This galaxy has the fewest number of GCs overall (around 210, see Hargis et al. (2011)). Moreover, we only have spectroscopy for 40 of those, and therefore a slightly less reliable likelihood fit. Nevertheless, the results from the rotation profiles based on GCs are in good agreement with the results for PNe published in Cortesi et al., (2013), who analysed a sample of 113 such objects. In addition, Hargis et al. (2011) studied the GC system of NGC 7457 and concluded that although the spatial distribution of the system is very elliptical, an inclined disc GC population could explain the observations. In the same work, it was suggested that the most likely formation scenario for this galaxy is through a merger event involving galaxies with unequal masses. NGC 7457 is a field galaxy, so gas stripping mechanisms, which are usually related to dense environments, are very unlikely to be major contributors here. Even so, it could be the result of starvation, where the isolated galaxy, after consuming all its gas reservoir, slowly stops creating young stars (Bekki et al., 2002). Presently, in the literature, scenarios for early-type galaxy formation involving a two-phase evolution are gaining popularity (Oser et al., 2010). In these scenarios, the bimodality of GCs in colour, metallicity and age would be a more natural outcome. Hargis et al. (2011) and Pota et al. (2013) were not able to detect bimodality in colour for the GCs in this galaxy (but see (Peacock et al., 2017)).
The ratio for this galaxy is more than 2, which would mean, following Bournaud et al. (2005), that at most it has undergone a merger event with a proportion of around 10:1. Moreover, the simulations of Bekki et al. (2005) indicate that the GC systems of galaxies that suffered minor mergers, as the one that would form flattened disc galaxies, such as NGC 7457, should retain a more spherical structure with little rotation at larger radii, which does not seem to be the case here. Another piece of information that can be added to this puzzle comes from Alabi et al. (2017). In this work, the dark matter fraction at large radii for NGC 7457 was found to be around 0.9, within 5 . This is greater than the dark matter fraction values found for NGC 2768, NGC 3115 and NGC 1023 which are all around 0.6. With this information, Alabi et al. (2017) calculated an assembly epoch for the halo of NGC 7457 at , or 12.3 Gyr ago. However, the mean luminosity-weighted ages for the stellar content of the central regions of this galaxy and of some of its GCs are around 3-7 Gyr (Sil’chenko et al., 2002; Chomiuk et al., 2008; McDermid et al., 2015). Therefore, the assembly of the halo of the galaxy would have taken place long before some of the GCs and stars at the centre of the galaxy were created. This formation scenario is compatible with a secular evolution scenario, with no mergers at least after . However, clumpy disc formation can also explain the fact that NGC 7457 has a disc dominated GC population (Inoue, 2013).
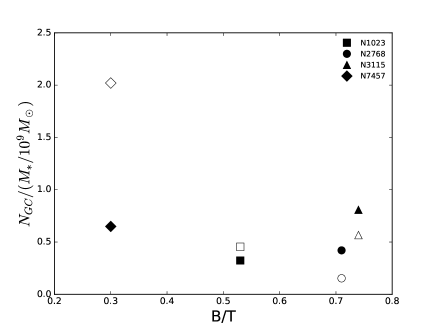
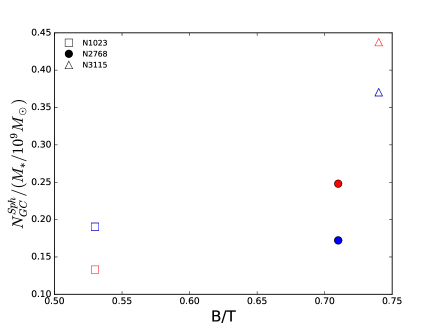
In Fig. 10 (a), we compare the number of GCs associated with the spheroid or disc components of its host galaxy, normalised by total stellar mass, with the bulge-to-total (B/T) ratio of the host galaxy light profile from Cortesi et al. (2013). We do not find that the number of GCs increases with the host galaxy B/T ratio. Nevertheless, if
we consider only the number of GCs that belong to the spheroid (in panel b555NGC 7457 is left out due to is negligible amount of spheroidal GCs, when compared to the other three galaxies.), we can see a trend with B/T. This suggests that the number of spheroidal GCs in a given galaxy can be estimated by its photometric properties, such as the fraction of bulge light, but disc GCs, on the other hand, do not follow a similar relation. This discrepancy with disc GCs then impacts the total number of GCs of a given galaxy when compared to its B/T ratio and should not be ignored. On a final note, Fig. 10 (a) also showcases the unusual proportion of GCs in NGC 7457 in proportion to its mass when compared to the other galaxies.
6 Summary and Conclusions
In this work we recovered the kinematics of the GC systems of three lenticular galaxies in low density environments: NGC 2768, NGC 3115 and NGC 7457. We employed the method presented in Cortesi et al. (2016) for NGC 1023 to obtain the probability of every GC to belong to the disc or the spheroid of the galaxy, using PNe kinematics and K-band photometry. The results point to a different formation scenario for each galaxy. NGC 2768 hosts a very prominent spheroidal GC population. NGC 3115 has the same number of GCs associated with the disc and the spheroid components. NGC 7457, interestingly, at least for the sample used in this work, has the majority of its GCs compatible with disc-like kinematics.
Following the simulations of Bekki et al. (2005) and Bournaud et al. (2005), and the fact that all galaxies in this sample are isolated or in small groups, we investigated the possibilities of merger origins for the galaxies studied. Although such hypothesis remains reasonable, the kinematics of red GCs associated with the disc component are compatible with clumpy disc formation. In the case of NGC 7457, our results seem to point towards a secular evolution from a regular spiral galaxy, or clumpy disc formation. Also of interest, the GC colour sub-populations of NGC 2768 display distinct kinematic behaviours, a feature not present in NGC 3115, NGC 7457 or even NGC 1023 from Cortesi et al. (2016). For all GC systems there is no clear correlation between the component of the galaxy they are likely to belong to and their colour. We find also a population of GCs in NGC 3115 which are not likely to belong to any of the modelled components, within a confidence interval of 2.3. Those GCs could be related to a recent accretion event or to components not explicitly included in our model, such as the halo. This is to be further investigated.
In summary, this work shows that the structure and kinematics of lenticular galaxies in low density environments is very diverse and more complex than expected by most formation scenarios proposed in the literature.
Acknowledgements
We thank Basilio Santiago, Horácio Dottori, Caroline Foster, José Eduardo Costa, Vincenzo Pota and Loïc Le Tiran for interesting discussions and contributions. We also thank the anonymous referee for valuable comments. EZ, ACS and CMdO acknowledges funding from CNPq. ACS acknowledges funding from CNPq-403580/2016-1 and 310845/2015-7, PqG-FAPERGS-17/2551-0001 and L'Oréal UNESCO ABC Para Mulheres na Ciência. CMdO acknowledges funding from FAPESP (process number 2009/54202-8). DF thanks the ARC for financial support via DP160101608. AJR was supported by National Science Foundation grant AST-1616710 and as a Research Corporation for Science Advancement Cottrell Scholar.
References
- Abadi et al. (1999) Abadi M. G., Moore B., Bower R. G., 1999, MNRAS, 308, 947
- Alabi et al. (2017) Alabi A. B., et al., 2017, MNRAS, 468, 3949
- Aragón-Salamanca (2008) Aragón-Salamanca A., 2008, in Bureau M., Athanassoula E., Barbuy B., eds, IAU Symposium Vol. 245, Formation and Evolution of Galaxy Bulges. pp 285–288 (arXiv:0710.2481), doi:10.1017/S1743921308017924
- Aragón-Salamanca et al. (2006) Aragón-Salamanca A., Bedregal A. G., Merrifield M. R., 2006, A&A, 458, 101
- Arnold et al. (2014) Arnold J. A., et al., 2014, ApJ, 791, 80
- Ashman et al. (1994) Ashman K. M., Bird C. M., Zepf S. E., 1994, AJ, 108, 2348
- Bekki et al. (2002) Bekki K., Couch W. J., Shioya Y., 2002, ApJ, 577, 651
- Bekki et al. (2005) Bekki K., Beasley M. A., Brodie J. P., Forbes D. A., 2005, MNRAS, 363, 1211
- Borlaff et al. (2014) Borlaff A., et al., 2014, A&A, 570, A103
- Boselli & Gavazzi (2006) Boselli A., Gavazzi G., 2006, PASP, 118, 517
- Bournaud et al. (2005) Bournaud F., Jog C. J., Combes F., 2005, A&A, 437, 69
- Brodie et al. (2012) Brodie J. P., Usher C., Conroy C., Strader J., Arnold J. A., Forbes D. A., Romanowsky A. J., 2012, ApJ, 759, L33
- Brodie et al. (2014) Brodie J. P., et al., 2014, ApJ, 796, 52
- Buta et al. (2010) Buta R., Laurikainen E., Salo H., Knapen J. H., 2010, ApJ, 721, 259
- Byrd & Valtonen (1990) Byrd G., Valtonen M., 1990, ApJ, 350, 89
- Cantiello et al. (2014) Cantiello M., Blakeslee J. P., Raimondo G., Chies-Santos A. L., Jennings Z. G., Norris M. A., Kuntschner H., 2014, A&A, 564, L3
- Ceverino et al. (2015) Ceverino D., Dekel A., Tweed D., Primack J., 2015, MNRAS, 447, 3291
- Chomiuk et al. (2008) Chomiuk L., Strader J., Brodie J. P., 2008, AJ, 136, 234
- Coccato et al. (2009) Coccato L., et al., 2009, MNRAS, 394, 1249
- Cortesi et al. (2011) Cortesi A., et al., 2011, MNRAS, 414, 642
- Cortesi et al. (2013) Cortesi A., et al., 2013, MNRAS, 432, 1010
- Cortesi et al. (2016) Cortesi A., et al., 2016, MNRAS, 456, 2611
- Côté et al. (2003) Côté P., McLaughlin D. E., Cohen J. G., Blakeslee J. P., 2003, ApJ, 591, 850
- Douglas et al. (2002) Douglas N. G., et al., 2002, PASP, 114, 1234
- Doyle et al. (2005) Doyle M. T., et al., 2005, MNRAS, 361, 34
- Dressler (1980) Dressler A., 1980, ApJ, 236, 351
- Dressler & Sandage (1983) Dressler A., Sandage A., 1983, ApJ, 265, 664
- Dressler et al. (1997) Dressler A., et al., 1997, ApJ, 490, 577
- Dressler et al. (2011) Dressler A., et al., 2011, PASP, 123, 288
- Elmegreen & Elmegreen (2005) Elmegreen B. G., Elmegreen D. M., 2005, ApJ, 627, 632
- Emsellem et al. (2011) Emsellem E., et al., 2011, MNRAS, 414, 888
- Faber et al. (2003) Faber S. M., et al., 2003, in Iye M., Moorwood A. F. M., eds, Proc. SPIEVol. 4841, Instrument Design and Performance for Optical/Infrared Ground-based Telescopes. pp 1657–1669, doi:10.1117/12.460346
- Fisher et al. (2017) Fisher D. B., et al., 2017, ApJ, 839, L5
- Forbes et al. (1997) Forbes D. A., Brodie J. P., Grillmair C. J., 1997, AJ, 113, 1652
- Forbes et al. (2012) Forbes D. A., et al., 2012, MNRAS, 426, 975
- Forbes et al. (2017) Forbes D. A., et al., 2017, AJ, 153, 114
- Fried & Illingworth (1994) Fried J. W., Illingworth G. D., 1994, AJ, 107, 992
- Garcia (1993) Garcia A. M., 1993, A&AS, 100, 47
- Garland et al. (2015) Garland C. A., Pisano D. J., Mac Low M.-M., Kreckel K., Rabidoux K., Guzmán R., 2015, ApJ, 807, 134
- Genzel et al. (2011) Genzel R., et al., 2011, ApJ, 733, 101
- Goto et al. (2003) Goto T., Yamauchi C., Fujita Y., Okamura S., Sekiguchi M., Smail I., Bernardi M., Gomez P. L., 2003, MNRAS, 346, 601
- Guérou et al. (2016) Guérou A., Emsellem E., Krajnović D., McDermid R. M., Contini T., Weilbacher P. M., 2016, A&A, 591, A143
- Gunn & Gott (1972) Gunn J. E., Gott III J. R., 1972, ApJ, 176, 1
- Hanes et al. (2001) Hanes D. A., Côté P., Bridges T. J., McLaughlin D. E., Geisler D., Harris G. L. H., Hesser J. E., Lee M. G., 2001, ApJ, 559, 812
- Hargis et al. (2011) Hargis J. R., Rhode K. L., Strader J., Brodie J. P., 2011, ApJ, 738, 113
- Hui et al. (1995) Hui X., Ford H. C., Freeman K. C., Dopita M. A., 1995, ApJ, 449, 592
- Hwang et al. (2008) Hwang H. S., et al., 2008, ApJ, 674, 869
- Inoue (2013) Inoue S., 2013, A&A, 550, A11
- Kim (1989) Kim D.-W., 1989, ApJ, 346, 653
- Larson et al. (1980) Larson R. B., Tinsley B. M., Caldwell C. N., 1980, ApJ, 237, 692
- McDermid et al. (2015) McDermid R. M., et al., 2015, MNRAS, 448, 3484
- Moody et al. (2014) Moody C. E., Romanowsky A. J., Cox T. J., Novak G. S., Primack J. R., 2014, MNRAS, 444, 1475
- Norris et al. (2006) Norris M. A., Sharples R. M., Kuntschner H., 2006, MNRAS, 367, 815
- Norris et al. (2014) Norris M. A., et al., 2014, MNRAS, 443, 1151
- Oke et al. (1995) Oke J. B., et al., 1995, PASP, 107, 375
- Oser et al. (2010) Oser L., Ostriker J. P., Naab T., Johansson P. H., Burkert A., 2010, ApJ, 725, 2312
- Park et al. (2012) Park H. S., Lee M. G., Hwang H. S., Kim S. C., Arimoto N., Yamada Y., Tamura N., Onodera M., 2012, ApJ, 759, 116
- Peacock et al. (2017) Peacock M. B., Zepf S. E., Kundu A., Maccarone T. J., Lehmer B. D., Gonzalez A. H., Maraston C., 2017, MNRAS, 466, 4021
- Peng et al. (2002) Peng C. Y., Ho L. C., Impey C. D., Rix H.-W., 2002, AJ, 124, 266
- Postman et al. (2005) Postman M., et al., 2005, ApJ, 623, 721
- Pota et al. (2013) Pota V., et al., 2013, MNRAS, 428, 389
- Querejeta et al. (2017) Querejeta M., et al., 2017, in Gil de Paz A., Knapen J. H., Lee J. C., eds, IAU Symposium Vol. 321, Formation and Evolution of Galaxy Outskirts. pp 114–116 (arXiv:1605.01910), doi:10.1017/S1743921316009030
- Quilis et al. (2000) Quilis V., Moore B., Bower R., 2000, Science, 288, 1617
- Rhee et al. (2017) Rhee J., Smith R., Choi H., Yi S. K., Jaffé Y., Candlish G., Sánchez-Jánssen R., 2017, ApJ, 843, 128
- Rocha et al. (2012) Rocha M., Peter A. H. G., Bullock J., 2012, MNRAS, 425, 231
- Romanowsky & Fall (2012) Romanowsky A. J., Fall S. M., 2012, ApJS, 203, 17
- Saha et al. (2000) Saha A., Armandroff T., Sawyer D. G., Corson C., 2000, in Iye M., Moorwood A. F., eds, Proc. SPIEVol. 4008, Optical and IR Telescope Instrumentation and Detectors. pp 447–451, doi:10.1117/12.395504
- Sandage & Bedke (1994) Sandage A., Bedke J., 1994, The Carnegie Atlas of Galaxies. Volumes I, II.
- Savorgnan & Graham (2016) Savorgnan G. A. D., Graham A. W., 2016, ApJS, 222, 10
- Shapiro et al. (2010) Shapiro K. L., Genzel R., Förster Schreiber N. M., 2010, MNRAS, 403, L36
- Sil’chenko et al. (2002) Sil’chenko O. K., Afanasiev V. L., Chavushyan V. H., Valdes J. R., 2002, ApJ, 577, 668
- Skrutskie et al. (2006) Skrutskie M. F., et al., 2006, AJ, 131, 1163
- Tully et al. (2013) Tully R. B., et al., 2013, AJ, 146, 86
- Whitmore et al. (1993) Whitmore B. C., Gilmore D. M., Jones C., 1993, ApJ, 407, 489
- de Vaucouleurs et al. (1991) de Vaucouleurs G., de Vaucouleurs A., Corwin Jr. H. G., Buta R. J., Paturel G., Fouqué P., 1991, Third Reference Catalogue of Bright Galaxies. Volume I: Explanations and references. Volume II: Data for galaxies between 0h and 12h. Volume III: Data for galaxies between 12h and 24h.
- van den Bergh (2009) van den Bergh S., 2009, ApJ, 702, 1502
- van den Bergh et al. (1996) van den Bergh S., Abraham R. G., Ellis R. S., Tanvir N. R., Santiago B. X., Glazebrook K. G., 1996, AJ, 112, 359