ExoMol line lists XXV: A hot line list for silicon sulphide, SiS
Abstract
SiS has long been observed in the circumstellar medium of the carbon-rich star IRC+10216 CW Leo. Comprehensive and accurate rotation-vibrational line lists and partition functions are computed for 12 isotopologues of silicon sulphide (28Si32S, 28Si34S, 29Si32S, 28Si33S, 30Si32S, 29Si34S, 30Si34S, 28Si36S, 29Si33S, 29Si36S, 30Si33S, 30Si36S) in its ground (X ) electronic state. The calculations employ an existing spectroscopically accurate potential energy curve (PEC) derived from experimental measurements and a newly-computed ab initio dipole moment curve (DMC). The 28Si32S line list includes 10 104 states and 91 715 transitions. These line lists are available from the ExoMol website (www.exomol.com) and the CDS database.
keywords:
molecular data; opacity; astronomical data bases: miscellaneous; planets and satellites: atmospheres; stars: low-mass1 Introduction
Silicon sulphide is well known in space. The first detections of SiS were in the microwave region by Morris et al. (1975), emitting from the IRC+10216 molecular envelope, who deduced that SiS was in greater abundance than SiO. This was in line with Tsuji (1973) who had earlier suggested that to detect SiS in circumstellar envelopes, the abundance ratio of carbon to oxygen needs to be much greater than unity, because the abundance of SiS is a function of the [C]/[O] abundance ratio. At larger distances away from the star, SiS molecules condense onto dust grains. Silicon from the dust grains is thought to be released into gas phase via shock waves produced due to the pulsation of the star. In regions radially further still, the ultra-violet (UV) radiation in the interstellar medium dissociates the molecules, hence the abundance of SiS is expected to be low in these regions (Velilla Prieto et al., 2015).
Morris et al. (1975) concluded that the observed radio-frequency lines of molecules containing elements such as Si and S could provide information on the nuclear processes occurring in stars which are in their post main sequence (PMS) phase. Subsequent detections of many rare isotopologues of SiS were reported by Johansson et al. (1984), Ziurys et al. (1984), Kahane et al. (1988), Cernicharo et al. (2000) and Mauersberger et al. (2004). Maser emission from IRC+10216 was reported by Henkel et al. (1983). They observed transitions of SiS in the vibrational state and 2 at frequencies near 18 GHz. According to Henkel et al. (1983), there is a population inversion in the transition in the ground vibrational state which is responsible for the maser emission. Fonfria Exposito et al. (2006) reported the first detections of SiS maser emission from , and transitions in the ground vibrational state from IRC+10216. First reports of vibrationally excited SiS in IRC+10216 came from Turner (1987) who detected transitions within the vibrational excited state. Turner (1987) concluded that the emission arises from the inner region of the circumstellar envelope which has a temperatures greater than 600 K. More recently Velilla Prieto et al. (2015) observed rotational lines of SiS in high vibrational states. Using the Atacama Large Millimetre Array (ALMA) radio telescopes they report detections of rotational emission lines for excited vibrational states as high as ; transitions for other isotopologues including 29Si32S, 30Si32S, 28Si33S, 28Si34S, 29Si33S and 29Si34S in high vibrational states were also observed. Observations of 24 rotation-vibrational lines of SiS from IRC+10216 are reported by Boyle et al. (1994) who estimated the rotational excitation temperature to be K. Considerable work continues on observing SiS spectra; for example, recently Danilovich et al. (2017) observed several lines of SiS and other S-containing species in a diverse sample of 20 AGB stars, including 7 M-type stars, 5 S-type stars, and 8 carbon stars.
The ExoMol project aims at providing line lists of spectroscopic transitions for key molecular species which are likely to be important in the atmospheres of extrasolar planets and cool stars (Tennyson & Yurchenko, 2012; Tennyson et al., 2016). This is essential for the continued exploration of newly discovered astrophysical objects such as exoplanets, for which there is an increasing desire to characterise their atmospheric compositions. The methodology of the line list production for diatomics is discussed by Tennyson & Yurchenko (2017b). ExoMol has already provided rotation-vibration line lists for several silicon-containing molecules: SiO (Barton et al., 2013), SiH4 (Owens et al., 2017) and SiH (Yurchenko et al., 2018b), and for several sulphur-containing molecules: CS (Paulose et al., 2015), PS (Prajapat et al., 2017), H2S (Azzam et al., 2016), SO2 (Underwood et al., 2016a) and SO3 (Underwood et al., 2016b), as well as most recently SH and SN (Yurchenko et al., 2018a). Given the astronomical importance of SiS, we present line lists for the 12 stable isotopologues of SiS applicable for temperatures up to 5000 K.
2 Previous laboratory studies
2.1 Experimental data
Barrow & Jevons (1938) first observed D – X SiS band in the ultraviolet (UV) region 2500 to 6500 Å. Later the E – X band system was observed by Vago & Barrow (1946) in absorption at temperatures of about 1000 ∘C. These bands were further analysed by Barrow (1946), Barrow et al. (1961), Bredohl et al. (1975), Bredohl et al. (1976) and Lakshminarayana et al. (1985). Linton (1980) observed chemiluminescent following the formation of SiS molecules in the reaction of Si atoms with OCS. The spectra showed two main bands in the region 350 – 400 nm and 385 – 600 nm attributed to transitions within the – X and – X systems.
The rotational spectrum of SiS was measured by Hoeft et al. (1969), Hoeft et al. (1970) and Tiemann et al. (1972). The permanent dipole moment in the ground state was determined by Stark effect measurements to be D by Murty & Curl (1969) and also by Hoeft et al. (1969). Isotopic effects on the rotational spectrum of SiS were investigated by Tiemann et al. (1972) who obtained Born-Oppenheimer breakdown corrections.
More recently Mueller et al. (2007) observed 300 pure rotational transitions of SiS and its 12 stable isotopic species in the vibrational ground state and vibrationally excited states. Rotational transitions were observed for the isotope of least abundance 30Si36S isotopologue in the ground vibrational state, as well as rotational transitions in for 28Si32S. Frum et al. (1990) recorded the rotation-vibration spectrum of SiS at 13 m (750 cm-1) using Fourier transform emission spectroscopy; they recorded seven bands for the parent isotopologue of SiS and three bands for each of the rarer isotopologues. Birk & Jones (1990) also measured the rovibrational spectrum for four isotopologues of SiS (28Si32S, 28Si34S, 29Si32S,30Si32S) in the ground electronic state. Further experimental data for the vibrational energy levels of the ground electronic state of SiS is provided by Nair et al. (1965).
2.2 Theoretical data
Several ab initio studies have been carried out on SiS starting with Robbe et al. (1981) who computed spectroscopic parameters of electronic states of SiS. Potential energy curves (PECs) for the ground electronic and various excited states have been calculated by several authors. These include finite difference Hartree-Fock (HF) calculations on the ground electronic state by Muller-Plathe & Laaksonen (1989). Chattopadhyaya et al. (2002) computed PECs for a number of lower electronic states of SiS using configuration interaction calculation with relativistic effective core potentials.
Coxon & Hajigeorgiou (1992) determined an empirical X state PEC using observed rotational – vibrational and pure rotational transition line positions. This PEC, which includes Born-Oppenheimer breakdown (BOB) corrections, is accurate to within experimental error. Coxon and Hajigeorgiou’s PEC and BOB corrections are used in this work. See section 3.2 for more details.
Li et al. (1988) focused their calculations on the X electronic ground state of SiS and used multi reference configuration interaction (MRCI) level calculations to compute the dissociation energy, the equilibrium bond length and a dipole moment curve (DMC). Li et al. (1988) obtained their best value of = 1.57 D for the permanent dipole moment, compared to the measured value D; they suggested that the addition of diffuse functions to the basis sets should account for the discrepancy between the calculated and experimental value. Subsequently, Huzinaga et al. (1993) also calculated the ground electronic DMC of SiS at the SCF (self-consistent field) level and obtained a value of = 2.170 D. Maroulis et al. (2000) performed coupled cluster (CCSD(T)) and finite field many body perturbation theory calculations to obtain a permanent dipole moment value close to that of Li et al. (1988), = 1.556 D. Shi et al. (2011) provided us (private communication, 2017) a DMC computed at the MRCI level with a large aug-cc-pV6Z basis set which gives = 1.611 D. Pineiro et al. (1987) provided a semi empirical dipole moment function which they used to estimate dipole matrix elements for vibration-rotational transitions. Given the variation in theoretical dipoles and the lack of agreement with the measured values, we compute our own ab initio DMC, see section 3.1.
3 Method
The general procedure adopted here is similar to that used by us for other closed-shell diatomics such as SiO (Barton et al., 2013), PN (Yorke et al., 2014) and CS (Paulose et al., 2015). The nuclear motion problem was solved using the program Level (Le Roy, 2017). As input we used the spectroscopically-determined PEC of Coxon & Hajigeorgiou (1992), with minor adjustments caused by discretization of the PEC as described below, and an ab initio DMC presented below.
3.1 Dipole moment curve
Initially we tested the calculated DMC of Li et al. (2014). However, when we compared these values to those given on the CDMS (The Cologne Database for Molecular Spectroscopy) database (Müller et al., 2005; Mueller et al., 2007), we found large discrepancies in the values of the Einstein A coefficients so decided to calculate our own DMC.
Ab initio calculations of the DMC were performed using MOLPRO (Werner et al., 2012) at the CCSD(T) level with an aug-cc-pV5Z basis set for 128 points between 0.9 and 3.2 Å. The dipoles were computed using the finite field approach (see Lodi & Tennyson (2010)) and stable results required using a low perturbing electric field strength of 0.00005 atomic units.
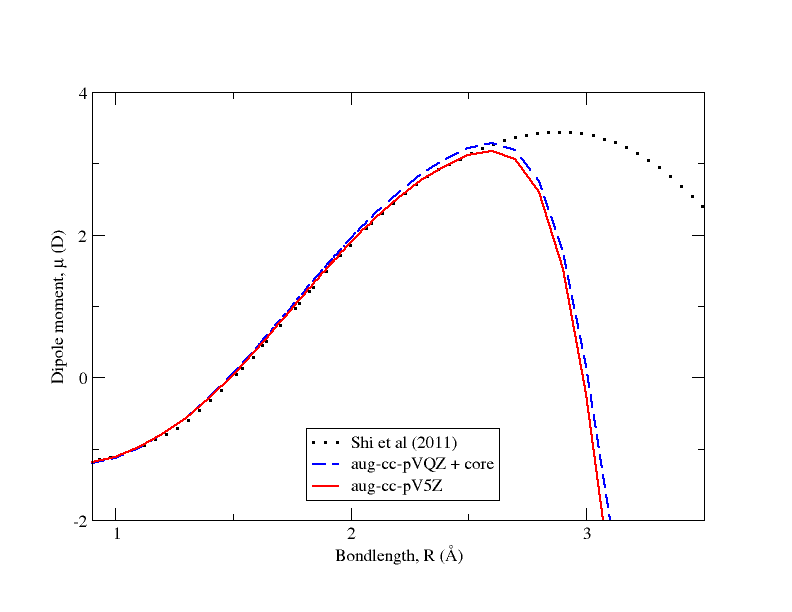
Figure 1 compares ab initio DMCs. Except for the curve provided by Shi et al. (2011), all other dipole curves have been calculated as part of this study using the CCSD(T) method. Our CCSD(T) DMCs appear to drop too rapidly at large bondlength. This behaviour appears to be a feature of CCSD(T) DMCs (Tennyson, 2014). However, tests showed that our results are not sensitive to the DMC beyond Å. Conversely our aug-cc-pV5Z DMC is smooth at bondlengths about equilibrium but that due to Shi et al. (2011) is computed at fewer points and is then less smooth when the points are used directly in the nuclear motion calculation. This lack of smoothness in the DMC leads to unphysical intensities (Medvedev et al., 2015). Our aug-cc-pV5Z dipole points are included in the supplementary material to this article as part of the input to Level.
Einstein A coefficients were calculated using Level and our CCSD(T) aug-cc-pV5Z DMC. Our computed value of the equilibrium dipole moment is = 1.70 D whereas Shi et al. (2011) calculate this to be = 1.61 D; the experimental value for the dipole moment is D. This higher value for our dipole gave better agreement with results of CDMS for pure rotational spectra, see below. Conversely all reliable DMCs considered give rather similar slopes in the region of equilibrium. This leads to a somewhat larger transition dipoles for the vibrational fundamental than the one assumed by CDMS, who use transition dipole values based on the semi-empirical estimates of Pineiro et al. (1987).
3.2 Potential Energy Curve
A very accurate PEC was derived by Coxon & Hajigeorgiou (1992) by fitting to spectroscopic data. The fit employed microwave and infrared data on four isotopologues (28Si32S, 28Si34S,29Si32S,30Si32S) from Tiemann et al. (1972), Birk & Jones (1990) and Frum et al. (1990). The resulting PEC is valid for all isotopologues of SiS. Their Born-Oppenheimer SiS potential energy function takes the functional form of a -variable Morse potential (Coxon & Hajigeorgiou, 1991) with additional atomic mass dependent BOB terms added. The effective PEC takes the form
| (1) |
where the last two terms give the functional forms of the J-independent BOB corrections for SiS. and are the atomic masses of the isotopes of Si and S respectively. Initially Birk & Jones (1990) tried to invert their measured line positions data to a Born-Oppenhiemer potential as a Dunham expansion but were unable to fit high J line positions (), which had to be excluded from the fit. Coxon & Hajigeorgiou (1992) are able to include this data in the final fit using their model.
Coxon & Hajigeorgiou (1992) showed that a small number of fitted parameters were able to represent the entire spectroscopic dataset to within the measurement accuracies of about 0.001 cm-1 for the measurements of Birk & Jones (1990) and 0.0001 cm-1 for measurements of the strongest lines from Frum et al. (1990).
However, the functional form of the -variable Morse potential is not one of those included in Level. Therefore, the expansion parameters of the PEC given by Coxon & Hajigeorgiou (1992) were used to generate data points of the PEC that could be directly input into Level. The PEC was generated on a grid of 0.001 Å from 1.0 to 3.0 Å. These points are included in the sample Level input given in the supplementary data. As the BOB term is isotopologue dependent, it was necessary to generate a new grid of effective PEC points for each isotopologue. Tests for 28Si32S showed that the results, and in particular the number of vibrational state obtained, were insensitive to extending this range.
.
3.3 Nuclear motion calculations
Nuclear motion calculations were performed using the program Level (Le Roy, 2017). All vibrational states were considered for the given PEC and isotopologue. The eigenvalues were calculated in Level using an eigenvalue convergence parameter (EPS) value set to cm-1. Table 1 compares our results for the vibrational term values (ie states with ) with the measurements of Nair et al. (1965) and the calculations of Coxon & Hajigeorgiou (1992). It can be seen that both calculations agree equally well with the observation and that there is a slight shift, about 0.003 cm-1 between the two theoretical calculations.
The discretization of the PEC and minor changes in the fundamental constants use probably account for this small shift. Coxon & Hajigeorgiou (1992) remark that in order to exactly reproduce their vibrational term values the constant should be set to a value of 16.8576314 cm-1. However in Level this constant is fixed at a value of 16.857629206 cm-1. Given that this shift is almost uniform and we are interested in precise transition frequencies rather than energy levels, this shift was not considered important.
| Obs. | Coxon | This Work | obscalc | CoxonThis work | |
|---|---|---|---|---|---|
| 0 | 374.2 | 374.2077 | 374.2114 | 0.0 | -0.0036 |
| 1 | 1119.0 | 1118.6843 | 1118.6877 | 0.3 | -0.0035 |
| 2 | 1858.3 | 1857.9975 | 1858.0009 | 0.3 | -0.0033 |
| 3 | 2592.0 | 2592.1534 | 2592.1566 | -0.2 | -0.0032 |
| 4 | 3321.8 | 3321.1575 | 3321.1606 | 0.6 | -0.0031 |
| 5 | 4045.9 | 4045.0155 | 4045.0185 | 0.9 | -0.0030 |
| 6 | 4763.5 | 4763.7328 | 4763.7356 | -0.2 | -0.0028 |
| 7 | 5476.9 | 5477.3144 | 5477.3171 | -0.4 | -0.0027 |
| 8 | 6181.6 | 6185.7655 | 6185.7682 | -4.2 | -0.0027 |
| 9 | 6886.8 | 6889.0909 | 6889.0936 | -2.3 | -0.0027 |
| 10 | 7587.5 | 7587.2953 | 7587.2980 | 0.2 | -0.0027 |
| Coxon | This Work | CoxonThis work | ||
|---|---|---|---|---|
| 28Si34S | 0 | 369.0503 | 369.0538 | -0.0035 |
| 1 | 1103.3198 | 1103.3231 | -0.0034 | |
| 2 | 1832.5673 | 1832.5706 | -0.0032 | |
| 3 | 2556.7986 | 2556.8017 | -0.0031 | |
| 4 | 3276.0191 | 3276.0221 | -0.0030 | |
| 29Si32S | 0 | 370.7550 | 370.7586 | -0.0036 |
| 1 | 1108.3985 | 1108.4019 | -0.0034 | |
| 2 | 1840.9736 | 1840.9769 | -0.0033 | |
| 3 | 2568.4860 | 2568.4891 | -0.0031 | |
| 4 | 3290.9413 | 3290.9443 | -0.0030 | |
| 30Si32S | 0 | 367.5104 | 367.5139 | -0.0035 |
| 1 | 1098.7321 | 1098.7354 | -0.0033 | |
| 2 | 1824.9737 | 1824.9769 | -0.0032 | |
| 3 | 2546.2409 | 2546.2440 | -0.0031 | |
| 4 | 3262.5390 | 3262.5420 | -0.0030 |
Table 2 compares predicted vibrational band origins for the three most important isotopically substituted SiS molecules with the results of Coxon & Hajigeorgiou (1992). Again the results show a small, almost uniform, systematic shift in the region of 0.003 cm-1. Again, this difference is probably not significant.
4 Line lists
4.1 Partition Function
| Isotopologue | Number of energies | Number of lines | ||
|---|---|---|---|---|
| 28Si32S | 42 | 257 | 10104 | 91715 |
| 28Si34S | 42 | 257 | 10251 | 94282 |
| 29Si32S | 42 | 257 | 10204 | 92003 |
| 28Si33S | 42 | 257 | 10182 | 91941 |
| 28Si36S | 43 | 257 | 10423 | 94751 |
| 30Si34S | 43 | 257 | 10487 | 94932 |
| 29Si34S | 43 | 257 | 10387 | 94658 |
| 29Si33S | 42 | 257 | 10277 | 94378 |
| 30Si33S | 43 | 257 | 10411 | 94709 |
| 29Si36S | 43 | 257 | 10528 | 95036 |
| 30Si36S | 44 | 257 | 10663 | 95294 |
| 30Si32S | 43 | 257 | 10316 | 94501 |
Level was used to compute all bound rotation-vibration states of each of the 12 isotopologues considered, see summary in Table 3. Partition functions were then calculated by direct summation of all energy levels. Contributions from quasi-bound or electronically excited states were ignored. Since the nuclear spin degeneracy of both 28Si and 32S is zero, the nuclear spin degeneracy factor for 28Si32S is unity which is the value adopted by all conventions. For the other isotopologues we follow the convention adopted by HITRAN (Gamache et al., 2017) and use full integer weights given by , where is nuclear spin of species .
Table 4 compares our partition function for 28Si32S with previous compilations. The agreement is excellent. Barklem & Collet (2016) calculate their partition function values from spectroscopic constants compiled by Huber & Herzberg (1979) and Irikura (2007). In an experimental study carried out by Sanz et al. (2003), Dunham coefficients and BOB correction terms were determined for the SiS ground electronic state (X ) using Fourier Transform Microwave (FTM) spectroscopy. These coefficients were used as spectroscopic constants by Barklem & Collet (2016) to calculate their partition function values listed in Table 4, which are in particularly good agreement with our (direct summation of energy level) values at lower temperatures. Our partition functions for all 12 isotopologues on a 1 K grid up to K are provided in the supplementary data.
| (K) | This Work | CDMS | Barklem & Collet (2016) |
|---|---|---|---|
| 3.0 | 7.22963 | 7.22968 | |
| 9.375 | 21.8566 | 21.8566 | |
| 18.75 | 43.3764 | 43.3765 | |
| 20.0 | 46.2461 | 46.2464 | |
| 37.5 | 86.4222 | 86.4221 | |
| 75.0 | 172.530 | 172.529 | |
| 130.0 | 298.935 | 298.939 | |
| 150.0 | 345.078 | 345.077 | |
| 225.0 | 521.644 | 521.643 | |
| 300.0 | 709.671 | 709.670 | |
| 500.0 | 1303.91 | 1303.91 | 1303.94 |
| 1000.0 | 3519.30 | 3519.25 | |
| 3000.0 | 23769.6 | 23774.3 | |
| 8000.0 | 156220 | 178366 |
For ease of use the partition functions are also was fitted to the functional form proposed by Vidler & Tennyson (2000)
| (2) |
The fitted expansion parameters for each isotopologue are given in the supplementary material. These parameters reproduce the temperature dependence of partition function of SiS with a relative root-mean-square error of 0.0076 up to = 5000 K which is the maximum temperature for which our line list is recommended.
4.2 Transition frequencies
We initially computed all rotation-vibrational transitions in the ground electronic state which satisfy the selection rule , with these transitions occurring between states as high as and . There are around 330 000 transitions in the case of 28Si32S. However, given concerns with the numerical stability of the intensity of higher overtone transitions (Medvedev et al., 2015), we chose to eliminate all transitions with . This reduces each line list to less than 100 000 transitions.
Table 5 compares our computed transition frequencies with a selection of measured frequencies covering a range of vibrational and rotational states for 28Si32S. The agreement is excellent; essentially to within the experimental uncertainty of 0.001 cm-1 quoted by Birk & Jones (1990) for their measurements. Table 6 gives a similar comparison, albeit for a reduced range of vibrational states, for three isotopologues of SiS. Again agreement is within experimental error. These comparisons provide confidence about the accuracy of the lines positions in the line list.
| Obs | Calc | ObsCalc | ||||
|---|---|---|---|---|---|---|
| 88 | 89 | 1 | 0 | 679.5896 | 679.5905 | -0.0009 |
| 6 | 5 | 1 | 0 | 748.0476 | 748.0478 | -0.0002 |
| 99 | 100 | 2 | 1 | 665.2391 | 665.2403 | -0.0012 |
| 116 | 115 | 2 | 1 | 787.9384 | 787.9391 | -0.0007 |
| 6 | 7 | 3 | 2 | 729.8961 | 729.8963 | -0.0002 |
| 69 | 68 | 3 | 2 | 768.1500 | 768.1498 | 0.0002 |
| 42 | 43 | 4 | 3 | 700.7459 | 700.7453 | 0.0006 |
| 34 | 33 | 4 | 3 | 747.5076 | 747.5078 | -0.0001 |
| 89 | 90 | 5 | 4 | 659.1780 | 659.1773 | 0.0008 |
| 24 | 23 | 5 | 4 | 737.2133 | 737.2134 | -0.0001 |
| 17 | 18 | 6 | 5 | 707.6352 | 707.6353 | -0.0001 |
| 127 | 126 | 6 | 5 | 768.0828 | 768.0801 | 0.0027 |
| 20 | 21 | 7 | 6 | 700.6245 | 700.6236 | 0.0008 |
| 74 | 73 | 7 | 6 | 748.5679 | 748.5681 | -0.0002 |
| 53 | 54 | 8 | 7 | 672.7660 | 672.7658 | 0.0002 |
| 90 | 89 | 8 | 7 | 748.4143 | 748.4110 | 0.0033 |
| 25 | 26 | 9 | 8 | 687.2477 | 687.2482 | -0.0005 |
| 8 | 7 | 9 | 8 | 707.8742 | 707.8747 | -0.0005 |
| 29 | 30 | 10 | 9 | 679.5703 | 679.5700 | 0.0003 |
| 19 | 20 | 10 | 9 | 686.0696 | 686.0688 | 0.0008 |
| Obs | Calc | ObsCalc | |||||
|---|---|---|---|---|---|---|---|
| 28Si34S | 82 | 83 | 1 | 0 | 676.1871 | 676.1873 | -0.0002 |
| 24 | 23 | 1 | 0 | 747.5463 | 747.5470 | -0.0007 | |
| 63 | 64 | 2 | 1 | 686.2286 | 686.2290 | -0.0004 | |
| 6 | 5 | 2 | 1 | 732.7039 | 732.7050 | -0.0010 | |
| 36 | 37 | 3 | 2 | 700.8034 | 700.8026 | 0.0008 | |
| 88 | 87 | 3 | 2 | 763.9691 | 763.9694 | -0.0003 | |
| 49 | 50 | 4 | 3 | 686.8249 | 686.8243 | 0.0006 | |
| 26 | 25 | 4 | 3 | 733.3080 | 733.3081 | -0.0001 | |
| 30Si32S | 106 | 107 | 1 | 0 | 658.7018 | 658.7018 | 0.0000 |
| 39 | 38 | 1 | 0 | 758.5463 | 758.5460 | 0.0003 | |
| 4 | 5 | 2 | 1 | 729.5870 | 729.5884 | -0.0014 | |
| 2 | 1 | 2 | 1 | 733.7504 | 733.7495 | 0.0009 | |
| 40 | 41 | 3 | 2 | 701.0780 | 701.0768 | 0.0012 | |
| 90 | 89 | 3 | 2 | 768.1860 | 768.1862 | -0.0002 | |
| 54 | 55 | 4 | 3 | 686.1028 | 686.1023 | 0.0005 | |
| 26 | 25 | 4 | 3 | 736.6676 | 736.6676 | 0.0000 | |
| 30Si32S | 8 | 9 | 1 | 0 | 725.8659 | 725.8648 | 0.0011 |
| 67 | 66 | 1 | 0 | 763.7698 | 763.7715 | -0.0017 | |
| 34 | 35 | 2 | 1 | 704.2666 | 704.2667 | -0.0001 | |
| 95 | 94 | 2 | 1 | 768.0828 | 768.0861 | -0.0034 | |
| 21 | 22 | 3 | 2 | 707.9016 | 707.9028 | -0.0012 | |
| 36 | 35 | 3 | 2 | 740.2007 | 740.1993 | 0.0014 | |
| 74 | 75 | 4 | 3 | 665.6780 | 665.6789 | -0.0009 | |
| 40 | 39 | 4 | 3 | 736.9890 | 736.9893 | -0.0003 |
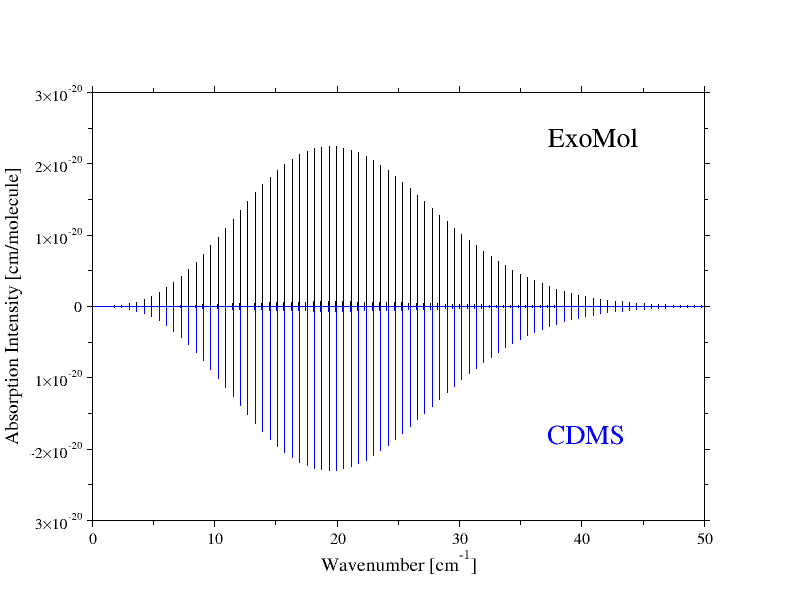
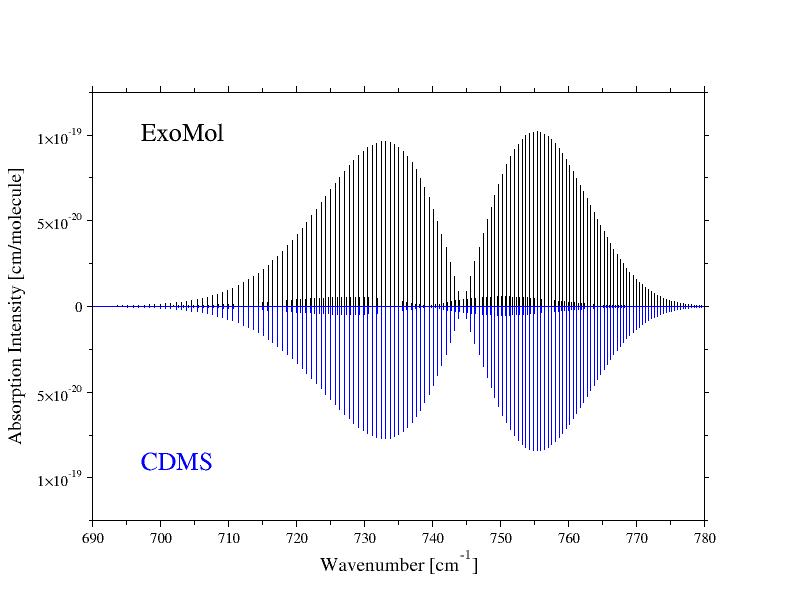
4.3 Comparisons of spectra
In order to test the quality of our theoretical line list, we present comparisons with previous works where possible. For SiS the CDMS catalogue (Müller et al., 2005), rather unusually, contains both pure rotational and vibration-rotation spectra for several isotopologues of SiS. Figures 2 and 3 compare our predictions for 28Si32S with those of CMDS. For the pure rotational spectrum, Fig. 2, the agreement is excellent. CDMS is carefully designed to be highly accurate for such long wavelength spectra and anyone wishing to study low-temperature rotational transitions of SiS is advised to start from the data in CDMS. The comparison for the vibrational fundamental, Fig. 3, is less good. In particular our spectrum is significantly stronger than the one given by CDMS due to our ab initio transition dipole value (0.14 D) being slightly higher than the semi-empirical estimate (0.13 D) provided by Pineiro et al. (1987) for the transition. In this case we expect our results to be more reliable since CDMS uses a rather simple treatment of the transition dipole whereas our calculation is based on the use of a state-of-the-art dipole moment function.
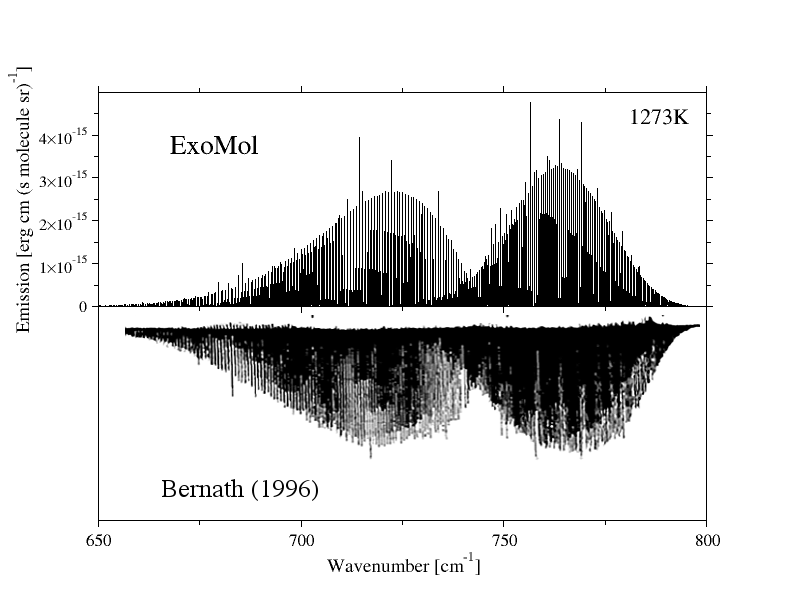
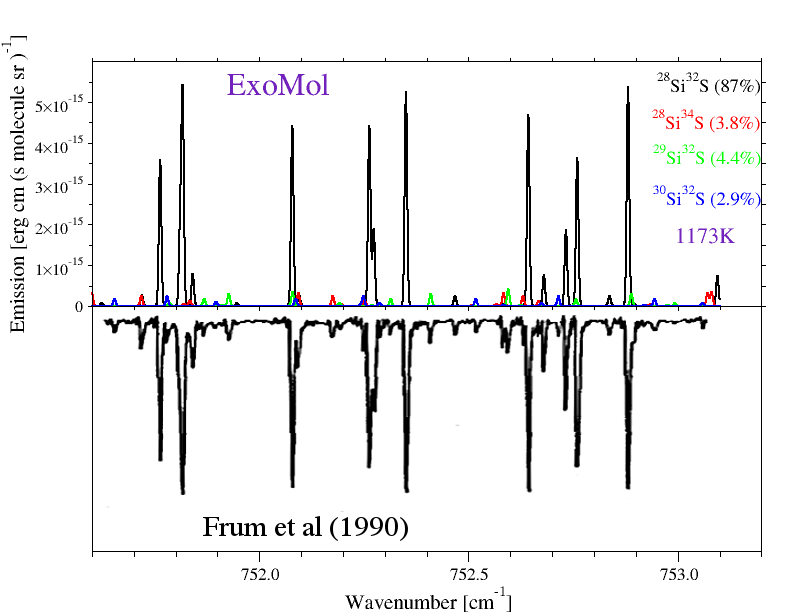
There are very limited data available on hot SiS spectra. An exception is the 13 m region; an overview emission spectrum for this region was presented by Bernath (1996) based on the measurements of Frum et al. (1990). Figure 4 compares our predictions with this experiment. Given the relative crude nature of the observed spectrum, for which no absolute intensities are available, agreement must be regarded as satisfactory. In particular P and R branch with the vibrational band , , and , in order of decreasing intensity, are clearly visible. Bernath (1996) notes similar features in his spectrum. We note that at higher resolution there are observable contributions from several isotopologues, as shown in Figure 5.
4.4 Overview
In accordance with ExoMol format (Tennyson et al., 2016), the line lists are presented as two files: a states file and a transitions file. Tables 7 and 8 give brief abstracts of the 28Si32S states and transitions files, respectively. These files can be combined with the partition function, which is also provided in the database, to give the desired spectrum at a given temperature. These files are made available for all 12 isotopologues considered at ftp://cdsarc.u-strasbg.fr/pub/cats/J/MNRAS/xxx/yy, or http://cdsarc.u-strasbg.fr/viz-bin/qcat?J/MNRAS//xxx/yy as well as the ExoMol website, www.exomol.com.
| 1 | 0.000000 | 1 | 0 | 0 |
| 2 | 0.605581 | 3 | 1 | 0 |
| 3 | 1.816740 | 5 | 2 | 0 |
| 4 | 3.633466 | 7 | 3 | 0 |
| 5 | 6.055745 | 9 | 4 | 0 |
| 6 | 9.083558 | 11 | 5 | 0 |
: State counting number.
: State energy in cm-1.
: Total statistical weight, equal to .
: Total angular momentum.
: State vibrational quantum number.
| (s-1) | |||
|---|---|---|---|
| 9972 | 9971 | 6.9703E-08 | 0.484833 |
| 9854 | 9853 | 7.1086E-08 | 0.486543 |
| 9713 | 9712 | 7.2306E-08 | 0.489422 |
| 9552 | 9551 | 7.3278E-08 | 0.492438 |
| 9374 | 9373 | 7.4098E-08 | 0.495470 |
| 9179 | 9178 | 7.4809E-08 | 0.498500 |
: Upper state counting number;
: Lower state counting number;
: Einstein-A coefficient in s-1;
: transition wavenumber in cm-1.
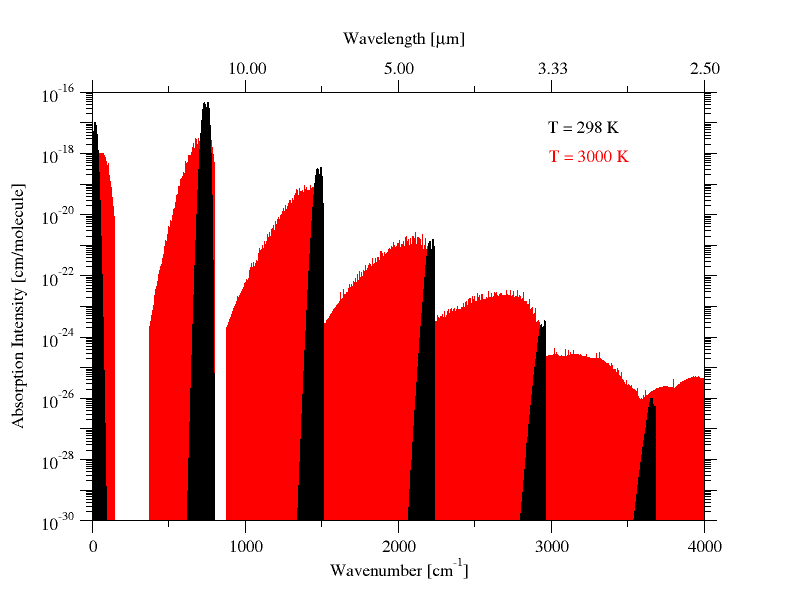
Figure 6 presents an overview of the SiS absorption spectrum as a function of temperature.
5 Conclusion
Accurate and complete line lists for 12 isotopologues of SiS are presented. The line lists, which we call UCTY, use potential energy curves based on the highly accurate study of Coxon & Hajigeorgiou (1992) and newly computed dipole moment functions. They represent the first complete line lists for these systems.
The detection of many hot rocky planets, so called lava planets, has significantly increased the number of small molecules whose spectra may be important in exoplanet atmospheres (Tennyson & Yurchenko, 2017a); SiS is one of these species. We hope that line lists such as the ones presented here will aid the characterisation of exoplanetary atmospheres by planned observational missions such as ARIEL (Tinetti & et al., 2018) and Twinkle (Savini et al., 2016).
Acknowledgements
This work was supported by the UK Science and Technology Research Council (STFC) grant No. ST/M001334/1 and the COST action MOLIM No. CM1405. This work made extensive use of UCL’s Legion high performance computing facility.
References
- Azzam et al. (2016) Azzam A. A. A., Yurchenko S. N., Tennyson J., Naumenko O. V., 2016, MNRAS, 460, 4063
- Barklem & Collet (2016) Barklem P. S., Collet R., 2016, A&A, 588, A96
- Barrow (1946) Barrow R. F., 1946, Proc. Phys. Soc. London, 58, 606
- Barrow & Jevons (1938) Barrow R. F., Jevons W., 1938, Proc. Roy Soc. A, 169, 45
- Barrow et al. (1961) Barrow R. F., Lagerqvist A., Deutsch J. L., Westerlund B., 1961, Proc. Phys. Soc. London, 78, 1307
- Barton et al. (2013) Barton E. J., Yurchenko S. N., Tennyson J., 2013, MNRAS, 434, 1469
- Bernath (1996) Bernath P. F., 1996, Chem. Soc. Rev., 25, 111
- Birk & Jones (1990) Birk H., Jones H., 1990, Chem. Phys. Lett., 175, 536
- Boyle et al. (1994) Boyle R. J., Keady J. J., Jennings D. E., Hirsch K. L., Wieldemann G. R., 1994, ApJ, 420, 863
- Bredohl et al. (1975) Bredohl H., Cornet R., Dubois I., Wilderia D., 1975, J. Phys. B: At. Mol. Opt. Phys., 8, L259
- Bredohl et al. (1976) Bredohl H., Cornet R., Dubois I., 1976, J. Phys. B: At. Mol. Opt. Phys., 9, L207
- Cernicharo et al. (2000) Cernicharo J., Guelin M., Kahane C., 2000, A&A Suppl. Ser., 142, 181
- Chattopadhyaya et al. (2002) Chattopadhyaya S., Chattopadhyay A., Das K. K., 2002, J. Phys. Chem. A, 106, 833
- Coxon & Hajigeorgiou (1992) Coxon J. A., Hajigeorgiou P. G., 1992, Chem. Phys., 167, 327
- Coxon & Hajigeorgiou (1991) Coxon J. A., Hajigeorgiou P. G., 1991, J. Mol. Spectrosc., 150, 1
- Danilovich et al. (2017) Danilovich T., Van de Sande M., De Beck E., Decin L., Olofsson H., Ramstedt S., Millar T. J., 2017, A&A, 606, A124
- Fonfria Exposito et al. (2006) Fonfria Exposito J. P., Agundez M., Tercero B., Pardo J. R., Cernicharo J., 2006, ApJ, 646, L127
- Frum et al. (1990) Frum C. I., Engleman R., Bernath P. F., 1990, J. Chem. Phys., 93, 5457
- Gamache et al. (2017) Gamache R. R., et al., 2017, J. Quant. Spectrosc. Radiat. Transf., 203, 70
- Henkel et al. (1983) Henkel C., Matthews H. E., Morris M., 1983, ApJ, 267, 184
- Hoeft et al. (1969) Hoeft J., Lovas F. J., Tiemann E., Torring T., 1969, Z. Natuurforschung A, 24, 1422
- Hoeft et al. (1970) Hoeft J., Lovas F. J., Tiemann E., Torring T., 1970, J. Chem. Phys., 53, 2736
- Huber & Herzberg (1979) Huber K. P., Herzberg G., 1979, Molecular Spectra and Molecular Structure IV. Constants of Diatomic Molecules. Van Nostrand Reinhold Company, New York
- Huzinaga et al. (1993) Huzinaga S., Miyoshi E., Sekiya M., 1993, J. Comput. Chem., 14, 1440
- Irikura (2007) Irikura K. K., 2007, J. Phys. Chem. Ref. Data, 36, 389
- Johansson et al. (1984) Johansson L. E. B., et al., 1984, A&A, 130, 227
- Kahane et al. (1988) Kahane C., Gomez-Gonzalez J., Cernicharo J., Guelin M., 1988, A&A, 190, 167
- Lakshminarayana et al. (1985) Lakshminarayana G., Shetty B. J., Gopal S., 1985, J. Mol. Spectrosc., 112, 1
- Le Roy (2017) Le Roy R. J., 2017, J. Quant. Spectrosc. Radiat. Transf., 186, 167
- Li et al. (1988) Li S. Z., Moncrieff D., Zhao J. G., Brown F. B., 1988, Chem. Phys. Lett., 151, 403
- Li et al. (2014) Li R., Zhang X.-M., Li Q.-N., Luo W., Jin M.-X., Xu H.-F., Bing Y., 2014, Acta Physica Sinica, 63, 113102
- Linton (1980) Linton C., 1980, J. Mol. Spectrosc., 80, 279
- Lodi & Tennyson (2010) Lodi L., Tennyson J., 2010, J. Phys. B: At. Mol. Opt. Phys., 43, 133001
- Maroulis et al. (2000) Maroulis G., Makris C., Xenides D., Karamanis P., 2000, Mol. Phys., 98, 481
- Mauersberger et al. (2004) Mauersberger R., Ott U., Henkel C., Cernicharo J., Gallino R., 2004, A&A, 426, 219
- Medvedev et al. (2015) Medvedev E. S., Meshkov V. V., Stolyarov A. V., Gordon I. E., 2015, J. Chem. Phys., 143, 154301
- Morris et al. (1975) Morris M., Gilmore W., Palmer P., Turner B. E., Zuckerman B., 1975, ApJ, 199, L47
- Mueller et al. (2007) Mueller H. S. P., et al., 2007, Phys. Chem. Chem. Phys., 9, 1579
- Muller-Plathe & Laaksonen (1989) Muller-Plathe F., Laaksonen L., 1989, Chem. Phys. Lett., 160, 175
- Müller et al. (2005) Müller H. S. P., Schlöder F., Stutzki J., Winnewisser G., 2005, J. Molec. Struct. (THEOCHEM), 742, 215
- Murty & Curl (1969) Murty A. N., Curl R. F., 1969, J. Mol. Spectrosc., 30, 102
- Nair et al. (1965) Nair K. P. R., Singh R. B., Rai D. K., 1965, J. Chem. Phys., 43, 3570
- Owens et al. (2017) Owens A., Yurchenko S. N., Yachmenev A., Thiel W., Tennyson J., 2017, MNRAS, 471, 5025
- Paulose et al. (2015) Paulose G., Barton E. J., Yurchenko S. N., Tennyson J., 2015, MNRAS, 454, 1931
- Pineiro et al. (1987) Pineiro A. L., Tipping R. H., Chackerian C., 1987, J. Mol. Spectrosc., 125, 184
- Prajapat et al. (2017) Prajapat L., Jagoda P., Lodi L., Gorman M. N., Yurchenko S. N., Tennyson J., 2017, MNRAS, 472, 3648
- Robbe et al. (1981) Robbe J. M., Lefebvre-Brion H., Gottscho R. A., 1981, J. Mol. Spectrosc., 85, 215
- Sanz et al. (2003) Sanz M. E., McCarthy M. C., Thaddeus P., 2003, J. Chem. Phys., 119, 11715
- Savini et al. (2016) Savini G., Tennyson J., 37 others 2016, Proc. SPIE
- Shi et al. (2011) Shi D., Xing W., Zhang X., Sun J., Zhu Z., Liu Y., 2011, Comput. Theor. Chem., 969, 17
- Tennyson (2014) Tennyson J., 2014, J. Mol. Spectrosc., 298, 1
- Tennyson & Yurchenko (2012) Tennyson J., Yurchenko S. N., 2012, MNRAS, 425, 21
- Tennyson & Yurchenko (2017a) Tennyson J., Yurchenko S. N., 2017a, Mol. Astrophys., 8, 1
- Tennyson & Yurchenko (2017b) Tennyson J., Yurchenko S. N., 2017b, Intern. J. Quantum Chem., 117, 92
- Tennyson et al. (2016) Tennyson J., et al., 2016, J. Mol. Spectrosc., 327, 73
- Tiemann et al. (1972) Tiemann E., Renwanz E., Hoeft J., Torring T., 1972, Z. Naturforschung A, A 27, 1566
- Tinetti & et al. (2018) Tinetti G., et al. 2018, Exp. Astron.
- Tsuji (1973) Tsuji T., 1973, A&A, 23, 411
- Turner (1987) Turner B. E., 1987, A&A, 183, L23
- Underwood et al. (2016a) Underwood D. S., Tennyson J., Yurchenko S. N., Huang X., Schwenke D. W., Lee T. J., Clausen S., Fateev A., 2016a, MNRAS, 459, 3890
- Underwood et al. (2016b) Underwood D. S., Tennyson J., Yurchenko S. N., Clausen S., Fateev A., 2016b, MNRAS, 462, 4300
- Vago & Barrow (1946) Vago E. E., Barrow R. F., 1946, Proc. Phys. Soc. London, 58, 538
- Velilla Prieto et al. (2015) Velilla Prieto L., et al., 2015, ApJL, 805, L13
- Vidler & Tennyson (2000) Vidler M., Tennyson J., 2000, J. Chem. Phys., 113, 9766
- Werner et al. (2012) Werner H.-J., Knowles P. J., Knizia G., Manby F. R., Schütz M., 2012, WIREs Comput. Mol. Sci., 2, 242
- Yorke et al. (2014) Yorke L., Yurchenko S. N., Lodi L., Tennyson J., 2014, MNRAS, 445, 1383
- Yurchenko et al. (2018a) Yurchenko S. N., Bond W., Gorman M. N., Lodi L., McKemmish L. K., Nunn W., Shah R., Tennyson J., 2018a, MNRAS
- Yurchenko et al. (2018b) Yurchenko S. N., Sinden F., Lodi L., Hill C., Gorman M. N., Tennyson J., 2018b, MNRAS, 473, 5324
- Ziurys et al. (1984) Ziurys L. M., Cu D. P., Saykally R. J., Colvin M., Schaefer H. F., 1984, ApJ, 281, 219