The 3CR Chandra snapshot survey: extragalactic radio sources
with redshifts between 1 and 1.5
Abstract
The aim of this paper is to present an analysis of newly acquired X-ray observations of 16 extragalactic radio sources, listed in the Third Cambridge Revised (3CR) catalog, and not previously observed by Chandra. Observations were performed during Chandra Cycle 17, extending X-ray coverage for the 3CR extragalactic catalog up to =1.5. Among the 16 targets, two lie at 0.5 (i.e., 3CR 27, at =0.184 and 3CR 69, at =0.458), all the remaining 14 have redshifts between 1.0 and 1.5. In the current sample there are three compact steep spectrum (CSS) sources, three quasars and an FR I radio galaxy, while the other nine are FR II radio galaxies. All radio sources have an X-ray counterpart. We measured nuclear X-ray fluxes as well as X-ray emission associated with radio jet knots, hotspots or lobes in three energy bands: soft (0.5-1 keV), medium (1-2 keV) and hard (2-7 keV). We also performed standard X-ray spectral analysis for the four brightest nuclei. We discovered X-ray emission associated with: the radio lobe of 3CR 124; a hotspot of the quasar 3CR 220.2; another hotspot of the radio galaxy 3CR 238; and the jet knot of 3CR 297. We also detected extended X-ray emission around the nuclear region of 3CR 124 and 3CR 297 on scales of several tens of kpc. Finally, we present an update on the X-ray observations performed with Chandra and XMM-Newton on the entire 3CR extragalactic catalog.
Subject headings:
galaxies: active — X-rays: general — radio continuum: galaxies1. Introduction
The last revised version of the Third Cambridge catalog (3CR) of extragalactic radio sources (Spinrad et al., 1985) remains one of the best studied samples of radio-loud active galactic nuclei (AGNs) being critical for statistical analysis of their properties (see e.g., Shields, 1999; Tadhunter, 2016). The 3CR catalog is a 178 MHz radio flux-limited sample, with a 9 Jy cut-off, that covers the redshift range 0.00052.5. As a low frequency selected sample, it is unbiased with respect to viewing angle, X-ray properties (e.g., total X-ray nuclear flux and spectrum), and optical spectroscopic classification of the sources.
In recent years, the large majority of the 298 3CR extragalactic sources have been observed with several photometric and spectroscopic surveys, in the radio, infrared (IR) and optical wavebands, so that a vast suite of data is now available to facilitate multifrequency analyses. Radio images with arcsecond resolution for the majority of the 3CR sources are available from the National Radio Astronomy Observatory Very Large Array (VLA) Archive Survey (NVAS) and in the archive of the MERLIN observatory. Recently, several snapshot surveys of 3CR radio sources were carried out using the Spitzer satellite (see e.g., Ramírez et al., 2014; Dicken et al., 2014; Ghaffari et al., 2017) and the Hubble Space Telescope (HST) (see e.g., Privon et al., 2008; Tremblay et al., 2009), reaching a coverage of about 90% of the entire extragalactic catalog including new observations of high redshift sources at 1.0 (see also Leipski et al., 2010; Hilbert et al., 2016). Several high redshift 3CR radio galaxies and quasars were detected in the far-infrared also by the Herschel Space Observatory (Podigachoski et al., 2016). Moreover, ground-based spectroscopic observations were carried out with the Telescopio Nazionale Galileo (Buttiglione et al., 2009, 2011).
To extend the wavelength coverage of the 3CR catalog, we started an X-ray snapshot survey with Chandra, the only X-ray facility with angular resolution comparable to that at optical and radio frequencies (see Massaro et al., 2015, for a recent review). The main aims of the Chandra snapshot survey can be summarised as: i) studying the X-ray emission, as a function of and radio power, arising from jet knots, hotspots and nuclei of radio sources, ii) investigating the nature of their large-scale environment and iii) searching for observational evidence of AGN interactions with the hot gas in galaxies, groups and clusters of galaxies. This interaction, known as feedback, is observed, for example, in cool-core galaxy clusters where extended structures (e.g., lobes) of radio sources, expand into the X-ray emitting intracluster medium creating cavities filled with radio-emitting plasma (see e.g., Fabian, 2012; Kraft et al., 2012). Chandra observations also allow us to search for new galaxy clusters via the presence of extended X-ray emission unrelated to the radio structures on kpc and Mpc scales around the sources (see e.g., Belsole et al., 2007; Ineson et al., 2013; Mannering et al., 2013).
Before Cycle 9, only of 3CR extragalactic sources were observed by Chandra: the snapshot survey allowed us to observe 113 more targets and all those with 1.5 have at least a snapshot (20 ks exposure) observation available in the Chandra archive111http://cda.harvard.edu/chaser/ to date. In the previous subsamples, observed during Cycles 9, 12, 13 and 15, we detected significant X-ray emission from all but two active nuclei and from 22 hotspots (see Massaro et al., 2010, 2012, 2013, 2018). Extended X-ray emission, possibly arising from the hot gas of a surrounding galaxy group or cluster, was also detected around 16 sources. Moreover, the Chandra snapshot survey inspired follow-up observations on several interesting objects such as 3CR 171 (Hardcastle et al., 2010), 3CR 305 (Hardcastle et al., 2012) and the tailed radio galaxy 3CR 89 (Dasadia et al., 2016). Our final goal of completing the Chandra observational coverage of the entire 3CR extragalactic catalog could be achieved in the next Cycle, with the observation of the remaining 9 sources.
Here, we present the X-ray analysis of Chandra observations carried out during Cycle 17, including 16 3CR radio sources previously unobserved by Chandra. Among the 16 targets, 14 are in the redshift range 1.0-1.5, while revised spectroscopic observations yielded an updated redshift estimate for the other two: 3CR 27, =0.184, and 3CR 69, =0.458 (Hiltner & Röser, 1991).
The paper is organised as follows: a brief description of the observations and data reduction procedures is given in § 2 while general results and source details are described in § 3. A brief summary and conclusions are given in § 4. Finally, we present in Appendix A X-ray images with radio contours overlaid for all the sources in the current high redshift sample, and in Appendix B the updated summary of X-ray observations, including Chandra and XMM-Newton informations, for the entire 3CR extragalactic portion of the catalog.
Throughout, we assumed a flat cosmology with km s-1 Mpc-1, and (Bennett et al., 2014), and we adopted cgs units, unless stated otherwise. Spectral indices, , are defined by the flux density, S.
| 3CR | Classaafootnotemark: | R.A. (J2000)bbfootnotemark: | Dec. (J2000)bbfootnotemark: | ccfootnotemark: | DL | Scale | NH,Galddfootnotemark: | mveefootnotemark: | S178fffootnotemark: | Chandra | Obs. Date |
| (hh mm ss) | (dd mm ss) | (Mpc) | (kpc/″) | (1020 cm-2) | (Jy) | ObsID | (yyyy-mm-dd) | ||||
| 27* | FR II-HERG | 00 56 01.0 | +68 22 30 | 0.184 | 900 | 3.113 | 41.2 | 18.2 | 26.5 | 18090 | 2016-03-15 |
| 69 | FR II-HERG | 02 38 02.673 | +59 11 50.56 | 0.458 | 2577 | 5.877 | 68.5 | 19.0 | 20.9 | 18092 | 2016-04-09 |
| 36 | FR II-HERG | 01 17 59.555 | +45 36 22.43 | 1.301 | 9293 | 8.510 | 6.35 | 20.0+ | 8.2 | 18091 | 2016-03-05 |
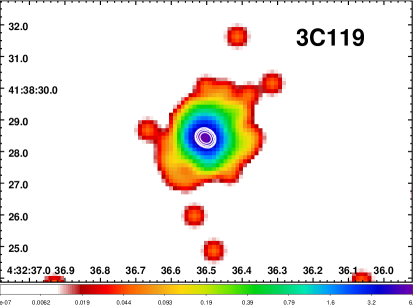
| 119 | CSS | 04 32 36.505 | +41 38 28.44 | 1.023 | 6893 | 8.166 | 36.7 | 20.0+ | 15.7 | 18093 | 2015-12-20 |
| 124 | FR II-HERG | 04 41 59.129 | +01 21 01.10 | 1.083 | 7399 | 8.267 | 8.75 | 22.0 | 10.3 | 18094 | 2015-12-15 |
| 173 | CSS - HERG | 07 02 20.474 | +37 57 22.54 | 1.035 | 6994 | 8.187 | 9.42 | 21.3+ | 8.7 | 18095 | 2015-12-03 |
| 194 | FR II-HERG | 08 10 03.636 | +42 28 05.02 | 1.184 | 8266 | 8.402 | 4.76 | 20.0+ | 9.9 | 18096 | 2015-12-17 |
| 208.1 | QSO | 08 54 39.373 | +14 05 52.06 | 1.020+ | 6868 | 8.160 | 3.35 | 20.0+ | 8.1 | 18097 | 2016-03-01 |
| 220.2 | QSO | 09 30 33.541 | +36 01 25.14 | 1.157+ | 8033 | 8.370 | 1.20 | 19.0+ | 7.2 | 18098 | 2016-02-08 |
| 222 | FR I | 09 36 32.023 | +04 22 10.18 | 1.339 | 9632 | 8.535 | 3.10 | 23.0+ | 11.3 | 18099 | 2016-01-15 |
| 230* | FR II-HERG | 09 51 58.8 | – 00 01 27 | 1.487 | 10970 | 8.599 | 3.63 | – | 21.1 | 18100 | 2016-01-13 |
| 238 | FR II-HERG | 10 11 00.350 | +06 24 39.02 | 1.405+ | 10225 | 8.570 | 1.96 | 22.5+ | 16.6 | 18101 | 2016-01-28 |
| 255 | FR II(?)-HERG | 11 19 25.292 | – 03 02 51.36 | 1.355 | 9775 | 8.545 | 4.29 | 23.0 | 12.5 | 18102 | 2016-02-07 |
| 297* | QSO | 14 17 24.0 | – 04 00 48 | 1.406+ | 10234 | 8.571 | 3.29 | 21.9+ | 10.3 | 18103 | 2016-03-27 |
| 300.1 | FR II-HERG | 14 28 31.230 | – 01 24 07.04 | 1.159 | 8050 | 8.372 | 3.13 | 19.0+ | 14.1 | 18104 | 2015-12-21 |
| 305.1* | CSS - LERG | 14 47 09.5 | +76 56 21 | 1.132+ | 7817 | 8.338 | 3.12 | 21.4+ | 4.6 | 18105 | 2016-08-07 |
Notes. The two sources above the line are outside the redshift range 1.01.5.
aafootnotemark: The “Class” column contains both a radio morphology descriptor (Fanaroff-Riley class I or II), quasar (QSO) or Compact Steep Spectrum (CSS) and
the optical spectroscopic designation, LERG, “Low Excitation Radio Galaxy”, HERG, “High Excitation Radio Galaxy”, when present in the literature.
bbfootnotemark: The celestial positions listed are those of the radio cores which we used to register the X-ray images, except for the four sources lacking an obvious radio nucleus: 3CR 27, 3CR 230, 3CR 297 and 3CR 305.1, labelled with “ * ”, for which the coordinates are taken from the NASA/IPAC Extragalactic Database (NED).
ccfootnotemark: Redshift measurements are taken from Spinrad (Spinrad et al., 1985) or from NED. Data from Spinrad are labeled with “+”.
ddfootnotemark: Galactic neutral hydrogen column densities (Kalberla et al., 2005).
eefootnotemark: is the visual magnitude from Spinrad (Spinrad et al., 1985) or from NED. Data from Spinrad are again labeled with “+”. The value of visual magnitude reported by NED for 3CR 230 is affected by a star nearby in projection on the sky and it is not reported here.
fffootnotemark: S178 is the flux density at 178 MHz (Spinrad et al., 1985).
2. Observations, Data Reduction, and Analysis
We adopted the data reduction and analysis procedures described in previous works, thus only basic details are reported here (see e.g. Massaro et al. 2009a, ; Massaro et al., 2011, for a complete description). We compared radio images, ranging from 1.4 to 14.9 GHz, and Chandra observations searching for a spatial coincidence between X-ray emission and extended radio structures (i.e., jet knots, hotspots or lobes).
2.1. Radio Observations
Radio images were retrieved from the NVAS222https://archive.nrao.edu/nvas and the DRAGN333http://www.jb.man.ac.uk/atlas/ webpage.
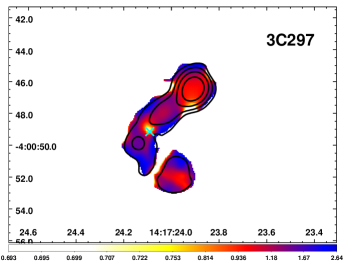
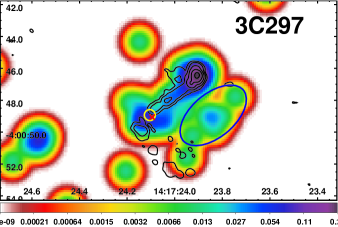
For the peculiar case of 3CR 297 (see § 3), we also computed the radio spectral index map, using archival observations at 4.85 and 8.4 GHz. The radio spectral index, , is a diagnostic tool to obtain useful informations on the particle energy distribution of electrons emitting via synchrotron emission. Spatial variations in spectral index across the radio structure were used to distinguish different regions of 3CR 297, since they could indicate differences in the underlying physical processes occurring in cores and in jets: radio emission arising from compact cores has typically a flat radio spectrum (i.e., ), while that from extended structures is characterised by a steeper spectrum (see e.g., Pauliny-Toth & Kellermann, 1968).
Archival VLA data analysed are from project ID AE0059 (4.85 GHz) and AV0164 (8.4 GHz) and were obtained on 30 October 1988 and 11 May 1990, respectively. In both observing runs the VLA configuration was A. We performed post-correlation processing and imaging with the Common Astronomy Software Applications (CASA).
We first calibrated the images in amplitude and phase with the primary calibrators 1127-145 (4.85 GHz) and 1328+307 (8.4 GHz). We set the uv-range for the computation of gain solutions in the latter case to a maximum of 400 k, following the specification on the VLA fringe calibrators444https://science.nrao.edu/facilities/vla/observing/callist. For the 4.85 GHz data, we flagged the antenna VA20 in the RR correlation in the bin time 14:28:55.0 to remove the bad response and achieve better gain solutions. Then, a self-calibration procedure was iteratively applied to improve the signal-to-noise, using the CASA task gaincal + applycal. We obtained the model image through the clean task using the weighting parameter set on natural first, and uvtaper at the end, to model also the extended emission. During this procedure we flagged additional deviating data (at 8.4 GHz the antenna VA22 for time less than 06:42:00 and VA13 between 07:00:0 and 07:01:15).
We computed the two final continuum maps with the same beam (0.98″, 0.88″, -35∘, task clean using uvtaper) and we re-gridded both to the same cell size (task imregrid) to properly compute the spectral index image for pixels with values with the relation: with GHz, GHz, and being the respective flux at the two frequencies (task immath). The resulting average rms of 3CR 297 radio map was 0.4 ( 0.15) mJy/beam and the peak flux was 0.510 (0.299) Jy at 4.85 (8.4) GHz. Typical uncertainties for flux density measurements in 3CR 297 radio maps are 10% for 4.85 GHz and 3% for 8.4 GHz.
2.2. X-ray Observations
The 3CR source sample observed during Cycle 17 is listed in Table 1, together with the basic parameters of each source (e.g., radio and optical classification, celestial coordinates, redshift, visual magnitude and radio flux). Sources were observed for a nominal exposure time of 12 ksec, but actual livetimes are given in Table 2. All Chandra observations were performed with the ACIS-S back illuminated chip in VERY FAINT mode to provide high sensitivity and a low background level. The four chips turned on were I2, I3, S2, and S3 with the nominal aim point centered on S3.
We performed the data reduction following the standard reduction procedure described in the Chandra Interactive Analysis of Observations (CIAO) threads555http://cxc.harvard.edu/ciao/guides/index.html, using CIAO version 4.9 and the Chandra Calibration Database (CALDB) version 4.7.3. Level 2 event files were generated using the acis_process_events task, and events were filtered for grades 0,2,3,4,6 and corrected for bad pixels. Light curves for every data set were extracted and checked for high background intervals, but none were found.
Since the on-axis width of the point spread function of the Chandra telescope is smaller than the size of the ACIS pixels (0″.492), to recover the native angular resolution, it is necessary to avoid the under-sampling. This is achieved by re-gridding all the images to 1/4 of the native size to obtain a common pixel size of 0″.123.
When possible, we registered X-ray images, changing the appropriate keywords in the header of the event file so as to align the nuclear X-ray position with that of the radio. In most cases, the total angular shift (reported for each registered source in Table 2) was less than 1″, as occurred in all previous sources analysed and collected in the XJET website666http://hea-www.harvard.edu/XJET/ (Massaro et al., 2011). The registration facilitates accurate searches for X-ray emission from within the extended radio structures by comparing radio and X-ray data with similar angular resolution. The distribution of the offsets in Table 2 is consistent with the level of uncertainty in the Chandra absolute astrometry (0″.8 at 90% confidence, 1″.4 at 99%777http://cxc.harvard.edu/cal/ASPECT/celmon/). We have also confirmed by eye the identification of the X-ray, radio and optical nuclei in all cases.
| 3CR | Shiftaafootnotemark: | LivTimbbfootnotemark: | ccfootnotemark: | Ext. Ratioddfootnotemark: | f(Soft)eefootnotemark: | f(Medium)eefootnotemark: | f(Hard)eefootnotemark: | f(Total)eefootnotemark: | HRfffootnotemark: | LXggfootnotemark: |
| (″) | (ks) | (counts) | 0.5-1 keV | 1-2 keV | 2-7 keV | 0.5-7 keV | (1044 erg s-1) | |||
| 27 | — | 11.91 | 61(8) | 0.90(0.06) | — | 2.3(1.0) | 86(11) | 88(11) | 0.94 | 0.09(0.01) |
| 69 | 0.62 | 11.92 | 497(22) | 0.94(0.01) | 9(2) | 74(5) | 350(20) | 433(21) | 0.65(0.03) | 3.4(0.2) |
| 36 | 0.66 | 11.91 | 335(18) | 0.94(0.01) | 27(4) | 65(5) | 143(13) | 235(15) | 0.37(0.05) | 24.3(1.6) |
| 119 | 0.60 | 11.90 | 383(20) | 0.97(0.01) | 18(4) | 64(5) | 220(16) | 303(17) | 0.54(0.04) | 17.2(0.9) |
| 124 | 0.48 | 11.92 | 21(5) | 0.49(0.09) | 1.5(1.0) | 0.5(0.5) | 22(5) | 24(5) | 0.96 | 1.6(0.3) |
| 173 | 1.10 | 12.40 | 124(11) | 0.96(0.03) | 11(3) | 21(3) | 43(7) | 76(8) | 0.34(0.09) | 4.4(0.5) |
| 194 | 0.36 | 11.91 | 125(11) | 0.87(0.03) | 0.8(0.8) | 18(3) | 89(10) | 108(11) | 0.67(0.05) | 8.8(0.9) |
| 208.1 | 0.73 | 11.91 | 228(15) | 0.92(0.02) | 25(4) | 35(4) | 102(11) | 162(12) | 0.48(0.06) | 9.1(0.7) |
| 220.2 | 0.44 | 11.92 | 684(26) | 0.94(0.01) | 78(7) | 119(7) | 273(18) | 470(20) | 0.39(0.04) | 36.3(1.5) |
| 222 | 0.68 | 11.91 | 3(2) | — | — | 0.8(0.6) | 1.5(1.5 ) | 2.3(1.6) | — | 0.3(0.2) |
| 230 | — | 12.35 | 25(5) | 0.7(0.1) | — | 2.4(1.0) | 21(5) | 24(5) | 0.80 | 3.5(0.7) |
| 238 | 0.13 | 11.91 | 23(5) | 0.5(0.1) | 2.0(1.0) | 3.5(1.2) | 8(3) | 14(3) | — | 1.8(0.4) |
| 255 | 0.73 | 11.92 | 5(2) | — | 0.7(0.7) | 1.0(0.6) | 1.4(1.4) | 3.1(1.7) | — | 0.4(0.2) |
| 297 | 0.54 | 12.34 | 17(4) | 0.24(0.06) | 1.3(0.9) | 2.5(0.9) | 8(3) | 12(3) | — | 1.5(0.4) |
| 300.1 | 0.24 | 11.92 | 19(4) | 0.42(0.09) | 0.6(0.6) | 0.8(0.6) | 22(6) | 23(6) | 0.93 | 1.8(0.5) |
| 305.1 | — | 11.91 | 16(4) | 0.7(0.2) | 0.8(0.8) | — | 20(5) | 20(5) | 0.92* | 1.5(0.4) |
Notes. Fluxes are given in units of 10-15 erg cm-2 s-1. Values in parentheses are 1 uncertainties.
aafootnotemark: Angular shift imposed to the X-ray image to align the nuclear X-ray position with that of the radio. The symbol “ – ” marks the sources without astrometric registration.
bbfootnotemark: LivTim is the observation live time.
ccfootnotemark: Total number of counts within a circle of radius r=2″ centered on the source position. The uncertainties given in parentheses are computed as .
ddfootnotemark: “Extent Ratio”: the ratio of the net counts (i.e., background subtracted) in the r=2″ circle to the net counts in the
r = 10″ circle. Values less than 0.5 indicate the presence of extended emission around the nuclear component of 3CR 124, 3CR 297, and 3CR 300.1. We did not report values of “Extent Ratio” for 3CR 222 and 3CR 255, having less than 9 counts in the 2″ circle . A 1 uncertainty is derived from the Poisson uncertainties on the number of counts in the circular region of radius 2″ and in the annular region between the radii 2″ and 10″, taking into account the covariance of the terms and the uncertainty on the number of background counts measured on the CCD.
eefootnotemark: Fluxes extracted from the flux maps in the three energy bands (0.5-1 keV, 1-2 keV, 2-7 keV) and the total flux in the energy range 0.5-7 keV. The uncertainties are derived from the relative uncertainties on the number of counts in the source and background regions, added in quadrature. The symbol “ – ” indicates that no counts were detected in the photometric region in the respective energy range.
fffootnotemark: The observed nuclear fluxes have been used to determine the hardness ratios with the relation: , where and are the X-ray fluxes in the hard and the medium bands, respectively. We computed the for those sources having more than 9 counts in the hard and medium band, while we only estimated the upper bound of the HR value for those sources with 9 or more counts in the hard band alone. The upper bound for the source 3CR 305.1, labelled with “ * ”, was computed with the soft X-ray flux (i.e., ) due to the lack of counts detected in the medium band. The uncertainties have been derived from the X-ray flux uncertainties.
ggfootnotemark: X-ray luminosity in the range 0.5 to 7 keV, computed using the values of DL given in Table 1. A 1 uncertainty is derived from the uncertainties on the flux.
2.2.1 Flux maps
We created flux maps in three energy ranges: 0.5-1 keV (soft band), 1-2 keV (medium band) and 2-7 keV (hard band), by filtering the event file with the appropriate energy range and taking into account exposure time and effective area. Since the effective area is a function of the photon energy, we created monochromatic exposure maps with nominal energies, , of 0.8 keV, 1.4 keV, and 4 keV for the soft, medium and hard band, respectively. To obtain flux maps in units of ergs cm-2 s-1 pixel-1, we multiplied each event by the nominal energy of its respective band. Throughout the paper, we used the re-gridded pixels of size 0″.123.
To measure observed fluxes for nuclei and for any X-ray detected component, we chose an appropriate circular region. For nuclei, we used circular regions of 2″ radius (see Table 2), while the radius of the circular regions used for other detected components is reported in Table 3. X-ray fluxes were computed using the flux maps for each source region in the three energy ranges previously defined. Since the nominal energy was used only to recover the correct units in the flux maps, for each particular region we applied a correction by multiplying the flux by a factor of , where is the mean energy computed in the photometric aperture, for the soft, medium and hard band, respectively. This correction ranged from a few to 15%. For each radio feature, we chose two adjacent source-free background regions, with the same size described above, to avoid contaminating X-ray emission (as well as radio emission) and to sample both sides of the extended radio structure. The one uncertainties on the fluxes were computed using the relative uncertainties on the number of counts, estimated assuming a Poisson distribution and taking into account the background. The background level in the Chandra images is sufficiently low that small changes in the background regions used does not result in significant changes in the derived flux uncertainties.
We used the nuclear fluxes measured with this procedure to determine the X-ray hardness ratios () through the simple relation: , where and are the X-ray fluxes in the hard and the medium bands, respectively. In Table 2, the uncertainties on the observed value of were propagated from the uncertainties of and , taking into account the covariance terms (see e.g., Park et al., 2006). We did not use the soft band flux values because they are the most affected by Galactic absorption, except in the case of 3CR 305.1 where no counts were detected in the medium band (see Table 2). We did not compute the for those sources having less than 9 counts in each band, while for those with high counts in the hard band alone we estimated the upper bound for the values.
Finally, we computed X-ray luminosities using the values of DL given in Table 1. X-ray fluxes and luminosities for the nuclei are given in Table 2 while those of the detected components are given in Table 3, together with their detection significance evaluated adopting Poisson statistics. In the latter table, the component classification is indicated by a letter (i.e., hotspot , lobe , jet knot , respectively), a cardinal direction as viewed from the nucleus and a number indicating the distance from the nucleus in arcseconds (as in Massaro et al., 2011).
| 3CR | Componentaafootnotemark: | Radiusbbfootnotemark: | Total (bkg)ccfootnotemark: | Detection | f(Soft)eefootnotemark: | f(Medium)eefootnotemark: | f(Hard)eefootnotemark: | f(Total)eefootnotemark: | LXfffootnotemark: |
|---|---|---|---|---|---|---|---|---|---|
| (arcsec) | (counts) | Significanceddfootnotemark: | 0.5-1 keV | 1-2 keV | 2-7 keV | 0.5-7 keV | 1044 erg s-1 | ||
| 124 | 2.5 | 5(1)* | 3 | — | 1.2(0.7) | 1.9(1.9) | 3(2) | 0.2(0.1) | |
| 220.2 | 2.0 | 11(0.3) | 7 | 1.8(1.1) | 0.9(0.7) | 4(3) | 7(3) | 0.5(0.2) | |
| 238 | 2.0 | 9(0.2) | 7 | 1.3(0.9) | 1.2(0.6) | 2.9(1.7) | 5(2) | 0.7(0.3) | |
| 297 | 2.0 | 33(0.2) | 7 | 3.9(1.8) | 5.6(1.5) | 9(3) | 19(4) | 2.4(0.5) |
Notes. Fluxes are given in units of 10-15 erg cm-2 s-1.
aafootnotemark: The component designation is comprised
of a letter indicating the classification (i.e., hotspot , lobe , jet knot ),
a cardinal direction (as viewed from the nucleus) plus the distance from the nucleus in arcseconds (as in Massaro et al., 2011).
bbfootnotemark: Size of the aperture used for photometry.
ccfootnotemark: Total counts in the photometric circle, with the background estimated from the CCD and rescaled on the component region, in parentheses; both counts refer to the total 0.5 to 7 keV band. In particular, for the source 3CR 124, labelled with “*”, since there is diffuse X-ray emission surrounding the nuclear region, we estimated the local background at the same angular separation of the radio lobe/relic, within an annulus of 5 inner radius and 10 outer radius (see also § 3.3).
ddfootnotemark: The confidence level of each detection evaluated adopting a Poisson distribution.
eefootnotemark: Fluxes extracted from the flux maps in the three energy bands (0.5-1 keV, 1-2 keV, 2-7 keV) and the total flux in the energy range 0.5-7 keV. The 1 uncertainties in parentheses are derived from the uncertainties on the number of counts in the source and background regions, added in quadrature.
fffootnotemark: X-ray luminosity in the range 0.5 to 7 keV, computed using the values of luminosity distance DL given in Table 1. A 1 uncertainty is derived from the uncertainties on the flux and it is given in parentheses.
2.2.2 X-ray Spectral Analysis of the stronger nuclei
We performed X-ray spectral analysis for the nuclei containing 300 or more total counts to estimate their X-ray spectral indices, . The 400 counts threshold adopted in previous analysis (see e.g., Massaro et al., 2018) was lowered for this higher redshift sample. We carried out the analysis on the level 2 event files using Xspec version 12.9 (Arnaud, 1996) and CIAO 4.9 Sherpa version 1 (Freeman et al., 2001) software packages, with consistent results.
We extracted the spectral data from the same 2″ photometric aperture centered around the nuclei described above, using the ciao routine specextract while the background spectra were extracted in nearby rectangular regions, not containing obvious X-ray sources. Then, we binned the background-subtracted spectra to a 30 counts per bin minimum threshold to ensure the validity of statistics, and we selected the energy range 0.5-7 keV for the spectral fitting.
We fitted the photon fluxes of the four brightest sources with a simple multiplicative model, phabspowerlaw in xspec syntax: a power law absorbed by the Galactic equivalent hydrogen column density, (Table 1, Kalberla et al., 2005). The normalisation parameter and the X-ray spectral index, , were allowed to vary. Results of the fit procedure are reported in Table 4.
We also considered the possible presence of mild pileup in Chandra observations of the two nuclei with the highest number of counts in our sample: 3CR 69 and 3CR 220.2. Pileup occurs on X-ray CCDs for sources with high flux levels when two or more photons arrive within the same detector pixel within a single CCD frame integration time, and they are counted as a single photon of higher energy.
We first produced pileup maps with the CIAO pileup_map tool, which indicated a pileup fraction of 5% and 10% in the nuclei of 3CR 69 and 3CR 220.2, respectively. To constrain more precisely the pileup amount in this observations we performed a spectral fitting with Sherpa, adding to the previous model the jdpileup model (Davis, 2001). Following the Sherpa thread888http://cxc.harvard.edu/sherpa/ahelp/jdpileup.html we fixed the parameters: grade zero probability, , number of detection cells, , and maximum number of photons considered for pileup in a single frame, . In addition, the frame time, , and fractional exposure, , parameters were fixed to the values of the keywords EXPTIME and FRACEXPO of the event and ARF files. The probability of a good grade when two photons pile together, , and the fraction of flux falling into the pileup region, , were left free to vary during the fit.
The power-law spectral index we obtained for 3CR 69 is consistent with the 0.4 value reported in Table 4, obtained without the pileup model, and the pileup fraction as evaluated from the get_pileup_model Sherpa command is zero. Since the quality of the data collected for 3CR 36 and 3CR 119, observed to have lower flux levels, is not sufficient to allow a more detailed spectral analysis, we conclude that these sources are affected by a pileup fraction 5% and that the estimate of their spectral index is not compromised.
In the case of 3CR 220.2 the pileup fraction obtained from the spectral fitting with Sherpa is 8.5%, comparable with that evaluated from the pileup map and the spectral index obtained with the pileup model is reported in Table 4. Although the two values are consistent within the 1 range, we note that the pileup effect tends to be more severe in this source, hardening the spectrum. The spectral fit performed with the pileup model yields estimates of the flux in the soft, medium, hard and total bands of 1.3, 1.6, 3.7, and 6.6 10-13 erg cm-2 s-1, respectively. The total source luminosity is 5.1 1045 erg s-1.
| 3CR | aafootnotemark: | (dof)ccfootnotemark: | |
|---|---|---|---|
| 36 | 335(18) | 0.7(0.1) | 5.68(7) |
| 69 | 492(22) | 0.4(0.1) | 21.38(13) |
| 119 | 381(20) | 0.5(0.1) | 8.49(9) |
| 220.2ddfootnotemark: | 683(26){ | 0.60(0.07) | 13.7(19) |
| 13.2(17) |
Notes. These four nuclei have 300 or more total counts in the photometric aperture and are thus suitable for spectral analysis.
aafootnotemark: Total number of counts within a circle of radius=2″. The uncertainties given in parentheses are computed as .
bbfootnotemark: X-ray spectral index with 1 uncertainties derived from the fit in parenthesis.
ccfootnotemark: of the fit procedure with degrees of freedom in parentheses.
ddfootnotemark: For the source 3CR 220.2, whose observation was found to be affected by a pileup fraction of , we reported fit results obtained with the simple model of a power law with Galactic absorption (first row) and with the addition of the jdpileup model (second row).
3. Results
3.1. General
In the current sample of 16 X-ray detected sources, three are classified as compact steep spectrum (CSS) radio sources, namely: 3CR 119, 3CR 173 and 3CR 305.1 (O’Dea, 1998). Among the other sources, three are quasars, nine are FR II radio galaxies and one is an FR I. Radio classifications reported in Table 1 are based on a literature search, with the exception of the radio galaxy 3CR 255 for which we propose an FR II classification.
We detected X-ray emission for all the nuclei in the sample with a level of significance higher than 3. All the results of the X-ray photometry (i.e., nuclear X-ray fluxes in the three energy bands, together with their X-ray hardness ratios and luminosities) are reported in Table 2 (see also § 3.3 for more details on each source). X-ray images are presented in Appendix A with contours of the radio structures overlaid.
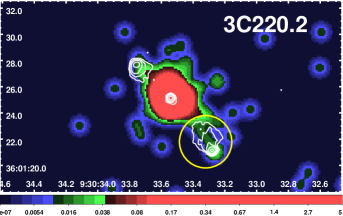
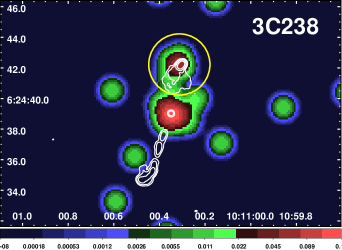
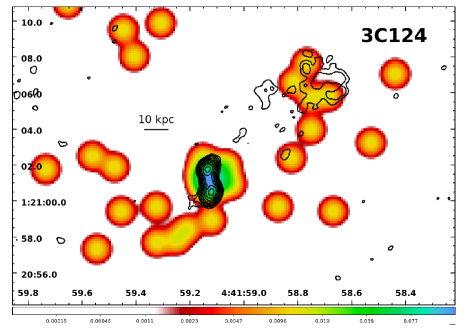
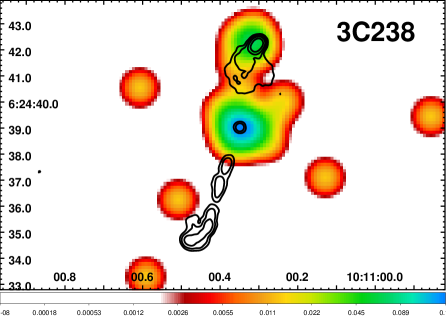
We detected the high energy counterpart of two hotspots: one in the quasar 3CR 220.2 and one in 3CR 238 (see Figure 1). We discovered also X-ray emission associated with a lobe in 3CR 124 (Figure 2), and with a jet knot in the quasar 3CR 297 (Figure 3). Detection significances, fluxes and luminosities of the components are reported in Table 3.
Results of the X-ray spectral analysis performed for the brightest nuclei (i.e., 3CR 36, 3CR 69, 3CR 119 and 3CR 220.2) are reported in Table 4: all spectra are consistent with a power-law model with Galactic absorption.
3.2. Extended emission
In Table 2 we also listed the total number of counts within a circular region of radius 2″, , centered on the source radio nucleus. We used the radio position given in Table 1 for those sources for which the X-ray image was not registered while for 3CR 297 we used the radio core position suggested from the flattening of the radio spectrum (see § 3.3). As for the previous analyses of 3CR sources observed, we computed the “Extent Ratio” dividing by the number of counts in a region of radius 10″, , centered on the same position, after the subtraction of background counts measured on the CCD from both values (i.e., Ext. Ratio shown in Table 2). We used the “Extent Ratio” as a diagnostic tool for the presence of extended X-ray emission around the source region (e.g. Massaro et al., 2010; Massaro et al. 2009b, ), though it does not provide information on whether the emission is related to any extended radio structure or not. We expect values close to unity for an unresolved (i.e., point-like) source since the on-axis encircled energy for r=2″ is 0.97, so there is only a small increase between r=2″ and r=10″ for an unresolved source. We found that 3 of the 16 sources in our sample show values of “Extent Ratio” less than 0.5, namely: 3CR 124, 3CR 297, and 3CR 300.1; indicating the possible presence of diffuse X-ray emission. For 3CR 300.1, the indication of the presence of extended X-ray emission, given by the low value of “Extent Ratio”, is not reliable because its value is affected by the presence of an X-ray point source at 7″distance from its nucleus.
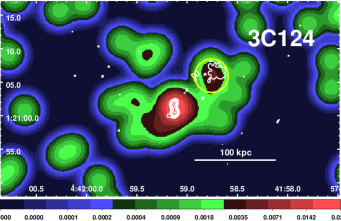
All sources showing extended X-ray emission are at 1.0, thus the combination of their radio projected size, close to the limit of Chandra resolution, and the short exposures of snapshot observations do not always allow us to distinguish between X-ray extended emission arising from the hot intergalactic medium (IGM) in their large-scale environment and the X-ray radiation related to their large-scale radio structure (i.e., as for example IC/CMB in their radio lobes). We interpret the diffuse X-ray emission as due to the high energy counterpart of the extended radio structure when the peaks of X-ray surface brightness appear coincident with those of the radio intensity. Otherwise we conclude that it could be due to the presence of thermal emitting gas in the IGM on a scale of several tens to hundreds kpc. Radio images in the MHz band, together with X-ray spectroscopic observations, are necessary to clearly disentangle the two above scenarios (Croston et al., 2005). An example is the radio galaxy 3CR 124 (see Fig. 2) with an “Extent ratio” of 0.49. In this source we detected both extended X-ray emission surrounding the radio source, on tens kpc scale and X-ray diffuse emission coincident with the external lobe, asymmetrically located with respect to the main radio axis (detection significance and fluxes of the lobe are all reported in Table 3). Both emission regions contribute to the low value of “Extent Ratio”.
We detected X-ray emission with a brightness peak to the west side of the quasar 3CR 297 (see Figure 3). Since the radio core position of this source is unclear, radio and X-ray images are registered with the surface brightness peak position of the knot -w 4 (see Table 3). The presence of diffuse X-ray emission in the westward direction is not related to any radio structure and we did not find an obvious optical counterpart in HST images, thus we interpreted it as X-ray radiation arising from the IGM. A detailed description of this peculiar source is given in § 3.3.
None of the 16 sources in our sample has been reported in the literature as a member of a galaxy cluster or group, although we found that, based on the literature search reported in § 3.3, 3CR 220.2, 3CR 255, and 3CR 300.1 could lie in large-scale (i.e., 100 kpc) galaxy-rich environments. For these sources we searched for possible X-ray emission due to the hot gas of the intracluster medium around their radio structures (see also Massaro et al., 2018). We measured the total number of photons in a circular region containing the entire extent of the radio source and we subtracted the X-ray counts within circular regions of 2″, corresponding to the radio nucleus, as well as that of point-like sources (e.g. hotspots and/or background/foreground objects) lying within the same region. Assuming a Poisson distribution for the background events, we computed the probability of obtaining the measured value. We did not find any X-ray excess above 3 significance on a few hundreds kpc scale environment.
3.3. Source details
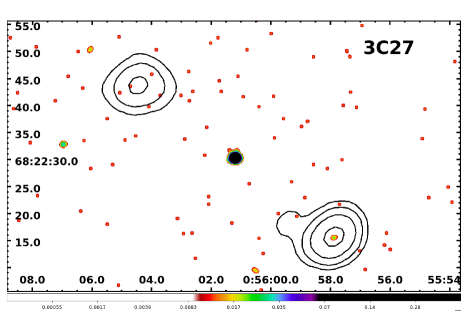
3CR 27 is a classical FR II radio galaxy at =0.184. From an optical perspective it is an elliptical High Excitation Radio Galaxy (HERG), as confirmed by the spectrum used to update its optical identification after the last revision of the 3CR catalog (Hiltner & Röser, 1991). It is located in a region of high optical obscuration at low Galactic latitude (i.e., =5∘.5). With the current radio map at 1.4 GHz, it was not possible to locate the radio core. However, its X-ray nucleus was probably detected with a total of 63 counts in a region of radius 2″ centered on the celestial coordinates reported in Table 1 (Hiltner & Röser, 1991) and located between the two lobes of the radio galaxy (see Figure 4). The SW hotspot has a flux density 4 times greater than the northern one at 1.4 GHz. Salter & Haslam (1980) reported the detection of a possible over density of sources in the radio observations at 408 MHz and at 2.7 GHz
over an area of 3.11.3∘ surrounding 3CR 27, without any information on its redshift. However given the estimate available in the literature this corresponds to a linear size 35 Mpc, making the possible detection of a galaxy rich environment around 3CR 27 unlikely.
In addition extended X-ray emission arising
from the intergalactic medium on a hundreds kpc
scale was not detected in our Chandra snapshot observation.
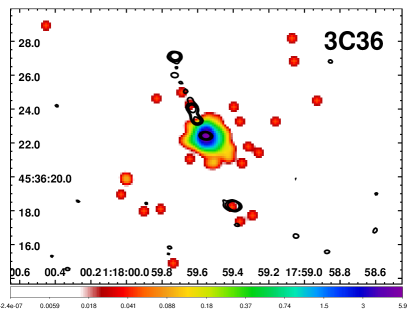
3CR 36 is classified as an FR II HERG at =1.301 (Hewitt & Burbidge, 1991; Jackson & Rawlings, 1997). In the 8.4 GHz map, its angular extension is , corresponding to a projected size of less than 80 kpc, with a dominant knotty jet in the north. In the HST optical image, 3CR 36 appears as a compact galaxy, and only a central nuclear component is detected (McCarthy et al., 1997). We detected the nucleus also in our Chandra snapshot survey (see Figure 5) and the total 335 X-ray photons observed in the nuclear region allowed us to perform a spectral analysis, which yielded a spectral index =0.7 (see Table 4).
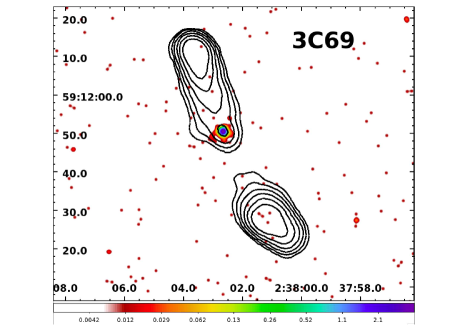
3CR 69 is an FR II radio galaxy, optically classified as HERG, at =0.458 (Hiltner & Röser, 1991). Since the source lies in a heavily obscured region at Galactic latitude =-0∘.9, its optical identification was made only after the last revision of the 3CR catalog. The radio image at 8.4 GHz shows two extended lobes and a fainter nucleus that was the only X-ray detection (see Figure 6). The spectral analysis of the nucleus yielded a spectral index =0.4, as reported in Table 4, and the pileup fraction estimate is 5%.
3CR 119 is a CSS radio source (O’Dea, 1998) and its updated redshift is =1.023 (Eracleous & Harpel, 1994). The source, which in our VLA 8.4 GHz map is a compact 0″.5 structure (5 kpc at the source redshift), shows a very complex radio morphology on the 1-kpc scale observed with the VLBI at 5 GHz: the nucleus was identified with a weak compact ( 0″.003) component with flat spectrum, while the extended structure has a spiral-like form with two knots along the jet (Fanti et al., 1986). This distorted morphology was interpreted as the result of the source interaction with dense clouds in its environment and this idea was supported by the presence of a large gradient of the rotation measure (i.e., 2300 rad/m2/mas in the 8.4-GHz band) and strong depolarisation between 8.4 and 5 GHz (Nan et al., 1999; Mantovani et al., 2010). The X-ray snapshot observation revealed point-like emission on a scale of ″, corresponding to 15 kpc at the source redshift, shown in Figure 7. The spectral analysis of its nucleus yielded a value of =0.5 (see also Table 4).
3CR 124 is an FR II radio galaxy at =1.083 (Hewitt & Burbidge, 1991). Optically, it is classified as a HERG (Jackson & Rawlings, 1997). The 8.4 GHz image shows a small scale compact double-lobe structure, with a fainter central core and angular extension of 2″.5 , corresponding to about 20 kpc. However, 3CR 124 also shows additional, more extended, asymmetric radio emission misaligned by measured in the west direction from the line connecting the other two, separated by 6″ (see Figure 8), suggestive of a relic lobe (McCarthy, 1989; Dunlop & Peacock, 1993). The optical galaxy observed with HST is more extended than the radio source, it has a highly curved morphology and shows an emission-line region which is very closely aligned with the radio one (McCarthy et al., 1997; Privon et al., 2008). The two radio components aligned in the NS direction can be interpreted as the two sides of an outflow, because a velocity gradient aligned with the radio axis was measured in the form of extended [O III] 5007 emission regions (Shih et al., 2013).
The value of “Extent Ratio” computed for this source, 0.490.09 (see Table 2), suggests the presence of diffuse emission around the nuclear region of the source. Examining the image more closely, we detect 22 photons in the 2″-10″ radial region, where we expect 5 background photons giving a detection of extended emission of more than 6. In this region the total luminosity is 1.10.2 1044 erg s-1.
We found an excess of X-ray photons with respect to the local background with more than 3 level of significance in a region of radius 2.5″(see Table 3). This is spatially coincident with the lobe/relic radio emission appearing in the NE direction (see Figure 2). The local background was estimated at the same angular separation of the radio lobe/relic, thus using an annulus of 5 inner radius and 10 outer radius. However, the low number of X-ray photons does not allow us to distinguish if such emission is due to a fluctuation of the diffuse X-ray radiation that appears surrounding the nucleus also in the SE direction or due to emission arising from particle accelerated in the NE radio structure.
We could favour the latter scenario because (i) the excess of X-ray photons, spatially coincident with the NE radio structure, is 2 times larger than the number of counts in the SE direction, at the same angular separation and measured over the same area, and since (ii) it lies at larger distance in the NE direction than the rest of the diffuse X-ray emission in the southern side.
Nuclear X-ray emission was also detected by Chandra (see Figure 8).
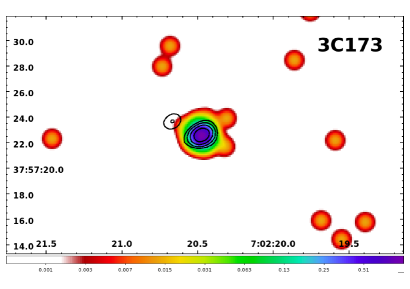
3CR 173 is a CSS at =1.035, optically classified as a HERG (Jackson & Rawlings, 1997). A double structure is visible in the radio image at 4.9 GHz, with the two peaks of radio surface brightness separated by only 2″, correspondent to 15 kpc at the source redshift (see Figure 9). The core is the dominant south-west component, characterised by a flattening of the integrated radio spectrum near 38 MHz (Tyul’bashev & Chernikov, 2000) and it is the only X-ray detection in this source.
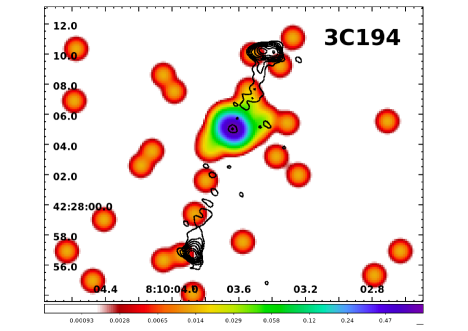
3CR 194, at =1.184 (Strom et al., 1990), was optically classified as a HERG (Jackson & Rawlings, 1997) and it is an FR II radio galaxy with a double hotspot in the NW lobe (see Figure 10). A high-sensitivity VLA image at 8.4 GHz showed that the two radio lobes are asymmetrically located with respect to the radio core and the north-western lobe does not extend along the radio source axis, but is almost perpendicular to it (Fernini, 2014). Weak radio emission in the EW direction was also observed at 5 GHz, giving an irregular quadrupolar shape and suggesting a movement of the source in the ambient medium in a westward direction (Strom et al., 1990). The optical galaxy in HST images is elongated North-South and composed of two components separated by 2″(Djorgovski et al., 1988; McCarthy et al., 1997). 3CR 194 displays rotation measures (in high resolution VLA observations at 1.4, 4.9 and 8.4 GHz) in excess of 1000 rad m-2 with an enhancement coincident with the NW hotspot (Taylor et al., 1992): the excess was interpreted as due to the compression of external gas and magnetic field by the terminal shock that created the hotspot. This suggests the presence of high density hot gas surrounding the galaxy, however lacking an X-ray detection. With 124 counts, the X-ray emission of the nuclear region of this galaxy was clearly observed by Chandra\̇\
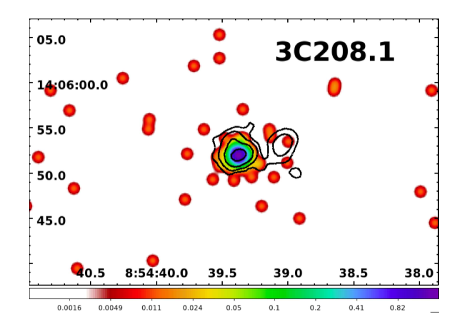
3CR 208.1 is a quasar (QSO). The optical counterpart was first identified with a N-type galaxy at =1.02 (Spinrad et al., 1985). Gravitational amplification due to a foreground source SE at = 0.159 was found to brighten the QSO by several tenths of a magnitude and to increase its radio flux by a factor of 1.5 (Le Févre & Hammer, 1990). The optical image of 3CR 208.1 has a compact nucleus and a secondary component 0.6″ NE (McCarthy et al., 1997) while the radio image at 14.9 GHz shows a lobe 5″ NW with a curved jet. The only feature detected by Chandra is the radio core (see Figure 11).
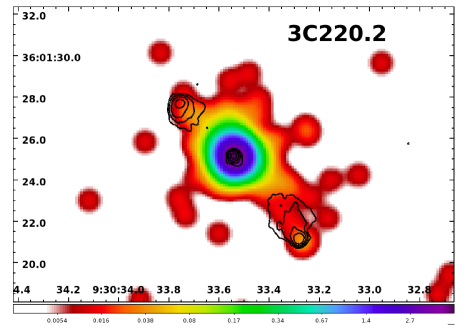
3CR 220.2 is a QSO at =1.157 (Spinrad et al., 1985). In the radio image at 4.9 GHz, both lobes, separated by 60 kpc, show a hotspot in the outer region. The peak of the radio surface brightness in the southern hotspot is coincident with a feature visible in the HST optical image, but also with the peak of the X-ray emission detected and designated as -s 5 in Table 3. Two X-ray photons are detected in the radio NE lobe/hotspot region. However, given the presence of X-ray photons at similar angular separation from the radio core with no radio counterparts, we cannot exclude that those in the northern lobe/hotspot are fluctuations of the local background. The X-ray nuclear emission is consistent with an unresolved point source, despite the presence of an elongation of the X-ray emission along the radio axis visible in Figure 1 and Figure 12.
In IR and optical images the source is aligned with a group of large spiral galaxies (Hilbert et al., 2016). Based on the photometric redshift estimations of the Sloan Digital Sky Survey (Albareti et al., 2017), these objects are probably foreground galaxies. However, we searched for extended X-ray emission on a scale of hundreds kpc in the field of 3CR 220.2 finding no neat detection.
The nucleus of 3CR 220.2 is the brightest one within the sample (i.e., =683) and it has a spectral index =0.6 (see Table 4). The pileup fraction obtained for this source is 8.5% but the spectral index obtained using a pileup model (i.e., ) is consistent with 0.6.
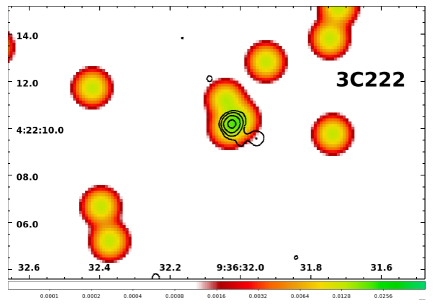
3CR 222 is known to be the most distant FR I radio galaxy of the 3CR catalog to date, having =1.339 (Heckman et al., 1994), although there is no published spectrum in the literature. It was classified as an ultra steep spectrum radio source, since it has a radio spectral index =1.52 in the frequency range from 10 MHz to 1 GHz (Roland et al., 1982). 3CR 222 was described as a compact double radio source, dominated by the nuclear emission at 1.4 GHz and with steep-spectrum emission coming from a region separated by 1″.2 to the south (Law-Green et al., 1995; Strom et al., 1990). The optical identification is the W member of an apparent faint quartet (Djorgovski et al., 1988). The X-ray nucleus is detected at 3 level of significance with only three photons observed by Chandra in a circular region of radius 2″ (see Figure 13).
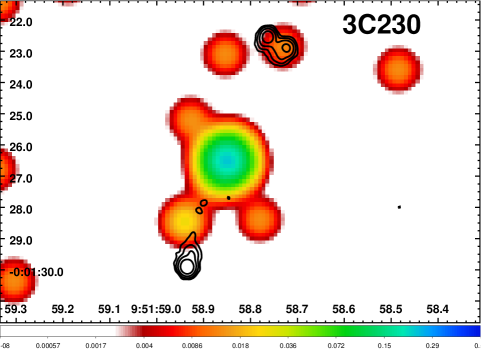
3CR 230 is an FR II radio galaxy at =1.487 with a double hotspot at the end of the northern lobe (Hewitt & Burbidge, 1991). It is optically classified as a HERG (Jackson & Rawlings, 1997). The radio image at 8.4 GHz shows two knots along the southern jet: it was claimed that the radio core position is coincident with the northern one, at R.A. = and = (J2000.0) (Steinbring, 2011). However, the comparison with the HST (Hilbert et al., 2016) and WISE (Wright et al., 2010) images of the sources shows that the optical nucleus is 0″.5 North of this position. Moreover, since the shift that should be applied to register the X-ray image with the radio core identified by Steinbring is 1″.5, more than twice the average shift imposed to the other sources, we used the unregistered image (see Figure 14).
By studying the relationship between source outflow and star formation in this galaxy, Steinbring noticed that the asymmetry of the 3CR 230 radio structure is mirrored in the optical surface brightness and in the strong turbulence in the direction of the shorter radio arm to the south-west. The optical galaxy runs along a central spine SE to NW aligned with the radio lobes and ends in broader tails, while the observed linear structures due to star formation are possibly induced by the jet (Hilbert et al., 2016). 3CR 230 is identified as a possible cluster candidate according to the red sequence method (Kotyla et al., 2016). The nucleus is the only X-ray detection although its position is uncertain.
3CR 238 is a HERG with a classical FR II morphology at =1.405 (Jackson & Rawlings, 1997). It could be affected by gravitational lensing by the Abell cluster A949 with an estimated redshift =0.142 along its line of sight (Le Févre et al., 1988). However, the core of this galaxy cluster is outside the field of view of the Chandra observation. The optical observation made with the HST shows a compact nucleus and faint extensions in the NS direction (McCarthy et al., 1997). In the 8.4 GHz image, the southern jet shows two elongated knots separated by 1″ and 2″ from the nucleus while the northern knot has a wider structure that is also detected in the X-ray (see Table 3 and Figure 1). The offset of between the peak of X-ray and radio emission is within the Chandra position error (see e.g., Massaro et al., 2011). We also checked the HST field and we did not find any optical source that could be associated with this X-ray emission. The “Extent Ratio” value computed for this source, as reported in Table 2, is 0.9 and it indicates the presence of extended emission ascribed to the X-ray radiation associated with the hotspot (see Figure 15).
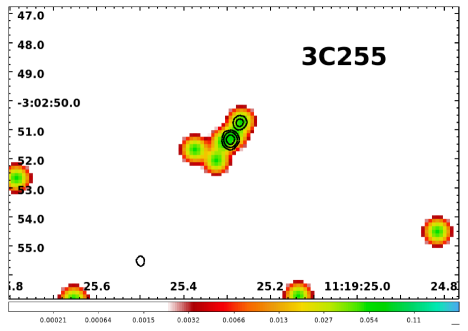
3CR 255 is a =1.355 radio galaxy with two radio components separated by 10 kpc (Giraud, 1990). It is optically classified as a HERG (Jackson & Rawlings, 1997). The 8.4 GHz map indicates a weak signal at the centre of the host galaxy, as well as a brighter, compact radio source to the southeast (see Figure 16). The northern radio component is located at the position of the optical galaxy, however more data are necessary to verify if it is compact and if it has a flat radio spectrum, as expected for the core of radio galaxies. In the optical band, the source appears elongated on 1″ scale and an over density of objects with optical magnitude in the R band between 22.5 and 24 was found in a 62″62″ area around the target (Giraud, 1990). This suggests the presence of a group or cluster of galaxies on the scale of 500 kpc. An IR HST image with 0″.1 resolution shows several extended sources in the vicinity of 3CR 255 (Hilbert et al., 2016). In the NASA/IPAC Extragalactic Database these objects are all catalogued as infrared sources with no redshift estimation. All of them have a clear optical counterpart, suggesting that active star formation is ongoing (Hilbert et al., 2016). The possible suggestion of the presence of a small group of galaxies in the field of 3CR 255 comes also from the red sequence method (Kotyla et al., 2016). However we did not detect extended X-ray emission in the hundreds kpc environment of this source. 3CR 255 lies entirely in a region of 2″ radius in which Chandra observed only five X-ray photons.
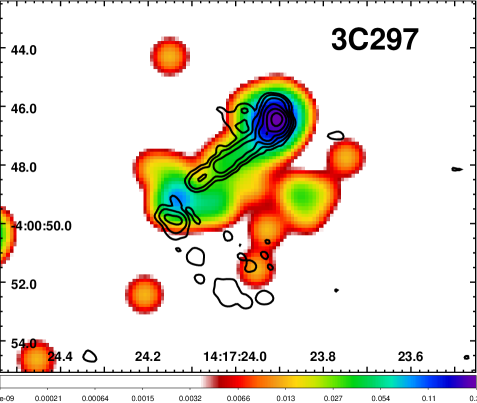
3CR 297 is a quasar with a peculiar radio morphology, lying at =1.406 (Spinrad et al., 1985). The emission observed in the 8.4 GHz and 4.85 GHz maps, computed in § 2.1, is elongated and curved with a knotty enhancement at the end of the northern jet (see Figure 3). In both radio images the emission to the south spreads over a much wider area, with a stronger concentration of signal centered on a double elongated source approximately 8 kpc (i.e., 1″) in projected distance from the host galaxy. The optical image shows two components separated by 0″.3 (McCarthy et al., 1997). Recent HST IR and optical images suggest the presence of ongoing merger activity in the area (Hilbert et al., 2016).
X-ray emission surrounding the radio jet is extended and there are 33 X-ray photons coincident with the position of the peak of the radio intensity of the jet knot in the NW (see Figure 17). Its detection, X-ray fluxes and luminosity are reported in Table 3. The precise location of the 3CR 297 nucleus in the radio maps available to us was uncertain, thus we decided to perform the astrometric registration using the radio position of the jet knot (i.e., R.A. = , = , J2000.0), assuming that the peak of X-ray surface brightness coincides with the radio peak. We then estimated the radio core position, indicated by the flattening of the radio power-law spectrum, using the spectral index map computed in § 2.1. As shown in Figure 3, the minimum value of spectral index, =0.68, is reached at: R.A. = , = (J2000.0), almost coincident with the optical host galaxy. We used also the HST observation to compare the morphology of the source in the radio, X-ray and optical bands.
X-ray diffuse emission was observed in a 2″4″ region west of the source with six X-ray counts and a total luminosity of 62 1043 erg s-1: since no optical counterpart was found in the HST image, this emission could be due to hot gas in the large scale environment.
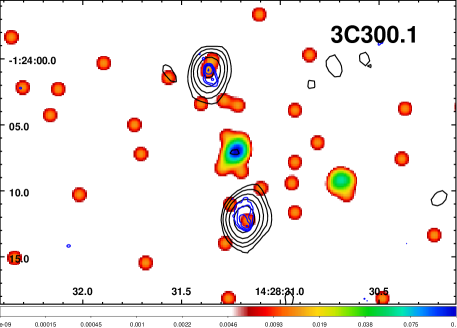
3CR 300.1 is a classical FR II HERG at =1.159 (Djorgovski et al., 1988), with two lobes separated by 10″ (i.e., 80 kpc at the source redshift) and a central core fainter than the lobes in the 14.9 GHz map (Jackson & Rawlings, 1997). The radio core is not detected in the 8.4 GHz radio image. In HST IR images, the galaxy appears as an extended irregular source with diffuse emission that suggests the presence of active star formation regions (Hilbert et al., 2016).
Kotyla et al. (2016) reported a possible presence of a source over density surrounding 3CR 300.1 and a possible cluster/group detection using “red sequence” method that does not appear clearly evident to us, however we checked for the presence of diffuse X-ray emission on tens of kpc scale in our Chandra snapshot observation. At a projected distance of 7″ in the SW direction, we detected an X-ray point source which has an IR counterpart in HST image (see Figure 18). The value of “Extent Ratio” computed in Table 2 indicates the presence of extended emission around its nucleus but we did not find a relevant detection in the annular region surrounding the radio source, if we exclude the background/foreground source.
The two radio lobes are detected with more than 2 level of significance using a local background. This was estimated in an annulus of 3″ inner radius and 8″ outer radius.
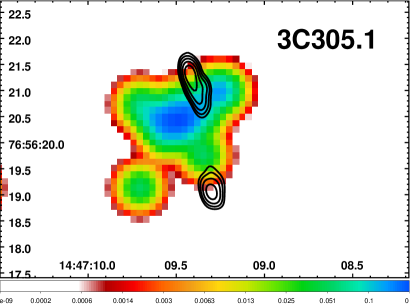
3CR 305.1 at =1.132 (Spinrad et al., 1985), is catalogued as a CSS (O’Dea, 1998) and optically it is the only Low Excitation Radio Galaxy (LERG) in our sample. The optical galaxy has a complex morphology suggestive of on-going merger activity (Hilbert et al., 2016): the optical emission can be seen over more than 2″ with a curved S-shaped structure in the inner 1″ radius and a close agreement between optical and radio orientation (McCarthy et al., 1997). Radio images at 8.4 GHz show the northern jet with more elongated emission and a southern circular lobe. In the 15 GHz radio map the northern jet shows three knots: the southernmost has a radio spectral index of 0.6, and it is highly polarised (60%), therefore unlikely to be the core (van Breugel et al., 1992). No nuclear emission is detectable in the radio maps available to us, ranging from 1.5 GHz to 22.5 GHz. Thus the registration was not performed. This source is detected with 16 X-ray photons in our Chandra image (see Figure 19).
4. Summary and conclusions
We presented new Chandra X-ray observations of 16 radio sources listed in the Third Cambridge Revised (3CR) catalog, observed during Chandra Cycle 17. The current sample lists three compact steep spectrum (CSS) sources, three quasars, nine FR II radio galaxies, and the most distant FR I radio galaxy within the 3CR extragalactic catalog. Fourteen targets lie at in the range 1.0-1.5, plus 3CR 27 and 3CR 69, which lie at =0.184 and =0.458, respectively.
Thanks to the Chandra snapshot survey, all 3CR extragalactic sources with 1.5 have at least an exploratory X-ray observation available to the astronomical community, enabling us to: i) search for X-ray emission from jet knots, hotspots and lobes in radio sources, and ii) investigate the high energy emission arising from the intergalactic medium in the environments of quasars and radio galaxies, at different scales.
Here, the basic source parameters for the newly acquired data are presented. We built flux maps for all the X-ray observations in three energy ranges (0.5–1 keV, 1–2 keV and 2–7 keV) and we provide basic parameters including: net counts, fluxes and luminosity, for the nuclei and other radio structures detected (i.e., jet knots, hotspots, lobes). In addition, we performed X-ray spectral analysis of the four brightest nuclei, finding consistency with a simple power-law spectrum with Galactic absorption.
The three CSS radio sources in our sample appear as point-like X-ray sources (see O’Dea et al., 2017, for a recent discussion of X-ray observations of CSS radio sources).
We discovered the X-ray counterparts of two radio hotspots one in 3CR 220.2 and the other in 3CR 238) and of a lobe/relic in 3CR 124. Moreover, we discovered extended X-ray emission around the nuclear regions of 3CR 124 and 3CR 297 on the scale of 10″and 5″, corresponding to 85 and 45 kpc, respectively. In the quasar 3CR 297 we discovered diffuse X-ray emission, of still unknown nature, along and parallel to the main radio axis.
Finally, a table summarising the state-of-the-art of the X-ray (i.e., Chandra and XMM-Newton) observations of 3CR extragalactic sources carried out to date is also reported at the end of the present manuscript (see Appendix B). Chandra detections are based on both our previous and current analysis and represent an update with respect to previous works, while those regarding XMM-Newton are only based on literature search carried out to date.
Facilities: VLA, CXO (ACIS)
References
- Albareti et al. (2017) Albareti, F. D. , Prieto, . A., Almeida, A. et al. 2017, arXiv, 1608, 02013
- Arnaud (1996) Arnaud, K.A., 1996, “Astronomical Data Analysis Software and Systems V”, eds. Jacoby G. and Barnes J., p17, ASP Conf. Series volume 101
- Balmaverde et al. (2012) Balmaverde, B., Capetti, A., Grandi, P. et al. 2012, A&A, 545, A143
- Belsole et al. (2007) Belsole, E., Worrall, D. M., Hardcastle, M. J. & Croston, J. H. 2007, MNRAS, 381, 1109
- Bennett et al. (2014) Bennett, C. L., Larson, D., Weiland, J. L., & Hinshaw, G. 2014, ApJ, 794, 135
- Buttiglione et al. (2009) Buttiglione, S., Capetti, A., Celotti, A. et al. 2009, A&A, 495 1033
- Buttiglione et al. (2011) Buttiglione, S., Capetti, A., Celotti, A. et al. 2011, A&A, L525, 28
- Croston et al. (2005) Croston, J. H., Hardcastle, M. J., Harris, D. E. et al. 2005, ApJ, 626, 733
- Croston et al. (2008) Croston, J. H., Hardcastle, M. J., Birkinshaw, M., Worrall, D. M. & Laing, R. A. 2008, MNRAS, 386, 1709
- Dasadia et al. (2016) Dasadia, S., Sun, M., Morandi, A. et al. 2016, MNRAS, 458, 681
- Davis (2001) Davis, J. E. 2001, ApJ, 562, 575
- Dicken et al. (2014) Dicken, D., Tadhunter, C., Morganti, R. et al. 2014, ApJ, 788, 98
- Djorgovski et al. (1988) Djorgovski, S., Spinrad, H., McCarthy, P. et al. 1988, AJ, 96, 836
- Dunkley et al. (2009) Dunkley, J., et al. 2009, ApJS, 180, 306
- Dunlop & Peacock (1993) Dunlop, J. S., & Peacock, J. A. 1993, MNRAS, 263, 936
- Eracleous & Harpel (1994) Eracleous, M., & Halpern, J. P. 1994, ApJS, 90, 1
- Evans et al. (2006) Evans, D. A., Worrall, D. M., Hardcastle, M. J., Kraft, R. P., & Birkinshaw, M. 2006, ApJ, 642, 96
- Fabian (2012) Fabian, A. C. 2012, ARAA, 50, 455
- Fanaroff & Riley (1974) Fanaroff, B. L. & Riley J. M. 1974, MNRAS, 167, P31
- Fanti et al. (1986) Fanti, C., Fanti, R., Schilizzi, R. T., Spencer, R. E., van Breugel, W. J. M. 1986, A&A, 170, 10
- Fernini (2014) Fernini, I. 2014, ApJS, 212, 19
- Freeman et al. (2001) Freeman, P., Doe, S., & Siemiginowska, A. 2001, SPIE, 4477, 76
- Ghaffari et al. (2017) Ghaffari, Z., Westhues, C., Haas, M. et al. 2017, arXiv, 1710, 02360
- Giraud (1990) Giraud, E. 1990, A&A, 234, 20
- Giraud (1991) Giraud, E. 1991, A&A, 253, L5
- Hammer & Le Févre (1990) Hammer, F. & Le Févre, O. 1990, ApJ, 357, 38
- Hardcastle et al. (2010) Hardcastle, M. J., Massaro, F., & Harris, D. E. 2010 MNRAS, 401, 2697
- Hardcastle et al. (2012) Hardcastle, M. J., Massaro, F., Harris, D. E. et al. 2012 MNRAS, 424, 1774
- Heckman et al. (1994) Heckman, T. M., O’Dea, C. P., Baum, S. A., & Laurikainen, E. 1994, ApJ, 428, 65
- Hewitt & Burbidge (1991) Hewitt, A., & Burbidge, G. 1991, ApJS, 75, 297
- Hilbert et al. (2016) Hilbert, B., Chiaberge, M., Kotyla, J. P. et al. 2016, ApJS, 225, 12
- Hiltner & Röser (1991) Hiltner, P. R. & Röser, H. J. 1991, A&A, 244, 37
- Ineson et al. (2013) Ineson, J., Croston, J. H., Hardcastle, M. J. et al. 2013, ApJ, 770, 136
- Ineson et al. (2017) Ineson, J., Croston, J. H., Hardcastle, M. J. & Mingo, B. 2017, MNRAS, 467, 1586
- Jackson & Rawlings (1997) Jackson, N. & Rawlings, S. 1997, MNRAS, 286, 241
- Kalberla et al. (2005) Kalberla, P. M. W., Burton, W. B., Hartmann, D. et al. 2005, A&A, 440, 775
- Kotyla et al. (2016) Kotyla, J. P., Chiaberge, M., Baum, S. et al. 2016, ApJ, 826, 12
- Kraft et al. (2012) Kraft, R. P., Birkinshaw, M., Nulsen, P. E. J. et al. 2012, ApJ, 749, 19
- Law-Green et al. (1995) Law-Green, J. D. B., Leahy, J. P., Alexander, P. et al. 1995, MNRAS, 274, 939
- Laskar et al. (2010) Laskar, T., Fabian, A. C., Blundell, K. M. & Erlund, M. C. 2010, MNRAS, 401, 1500
- Le Févre & Hammer (1988) Le Févre, O. & Hammer, F. 1988, ApJ, 333, 37
- Le Févre et al. (1988) Le Févre, O., Hammer, F. & Jones, J. 1988, ApJ, 331, 73
- Le Févre & Hammer (1990) Le Févre, O. & Hammer, F. 1990, ApJ, 350, 1
- Leipski et al. (2010) Leipski, C., Haas, M., Willner, S. P. et al. 2010, ApJ, 717, 766
- Mannering et al. (2013) Mannering, E., Worrall, D. M. & Birkinshaw, M. 2013 MNRAS, 431, 858
- Mantovani et al. (2010) Mantovani, F., Rossetti, A., Junor, W., Saikia, D. J. & Salter, C. J. 2010, A&A, 518, 33
- Maselli et al. (2016) Maselli, A., Massaro, F., Cusumano, G. et al. 2016, MNRAS, 460, 3829
- (48) Massaro, F., Harris, D. E., Chiaberge M. et al. 2009a ApJ, 696, 980
- (49) Massaro, F., Chiaberge, M., Grandi, P. et al. 2009b ApJ, 692, L123
- Massaro et al. (2011) Massaro F., Harris, D. E., & Cheung, C. C. 2011 ApJS, 197, 24
- Massaro et al. (2015) Massaro, F., Harris, D. E., Liuzzo, E. et al. 2015, ApJS, 220, 5
- Massaro et al. (2010) Massaro, F., Harris, D. E., Tremblay, G. R. et al. 2010, ApJ, 714, 589
- Massaro et al. (2013) Massaro, F., Harris, D. E., Tremblay, G. R. et al. 2013, ApJS, 206, 7
- Massaro et al. (2012) Massaro, F., Tremblay, G. R., Harris, D. E. et al. 2012, ApJS, 203, 31
- Massaro et al. (2018) Massaro, F. Missaglia, V., Stuardi, C., Harris, D. E. et al. 2018 ApJS, 234, 7
- McCarthy (1989) McCarthy, P. J. 1989, PhD Thesis, University of California at Berkeley
- McCarthy et al. (1997) McCarthy, P. J., Miley, G. K., de Koff, S. et al. 1997, ApJS, 112, 415
- Nan et al. (1999) Nan, R., Gabuzda, D.C., Kameno, S., Schilizzi, R.T. & Inoue, M. 1999, A&A, 344, 402
- O’Dea (1998) O’Dea, C. P. 1998, PASP, 110, 493
- O’Dea et al. (2017) O’Dea, C. P., Worrall, D. M., Tremblay, G. R. et al. 2017, ApJ, 851, 87
- Park et al. (2006) Park, T., Kashyap, V. L., Siemiginowska, A. et al. 2006, ApJ, 652, 610
- Pauliny-Toth & Kellermann (1968) Pauliny-Toth, I. I. K., & Kellermann, K. I. 1968, AJ, 73, 953
- Podigachoski et al. (2016) Podigachoski, P., Rocca-Volmerange, B., Barthel, P., Drouart, G. & Fioc, M. 2016, MNRAS, 462, 4183
- Privon et al. (2008) Privon, G. C., O’Dea, C. P., & Baum, S. A. 2008, ApJS, 175, 423
- Ramírez et al. (2014) Ramírez, E. A., Tadhunter, C. N., Dicken, D. et al. 2014, MNRAS, 439, 1270
- Roland et al. (1982) Roland, J., Véron, P., Stannard, D., & Muxlow, T. 1982, A&A, 116, 60
- Salter & Haslam (1980) Salter, C. J., & Haslam, C. G. T. 1980, A&A, 81, 240
- Shelton et al. (2011) Shelton, D. L., Hardcastle, M. J. & Croston, J. H. 2011, MNRAS, 418, 811
- Shields (1999) Shields, G. A. 1999, PASP, 111, 661
- Shih et al. (2013) Shih, H., Stockton, A. & Kewley, L. 2013, ApJ, 772, 138
- Spinrad et al. (1985) Spinrad, H., Marr, J., Aguilar, L. & Djorgovski, S. 1985, PASP, 97, 932
- Strom et al. (1990) Strom, R. G., Riley, J. M., Spinrad, H. et al. 1990, A&A, 227, 19
- Steinbring (2011) Steinbring, E. 2011, ApJ, 142, 7
- Tadhunter (2016) Tadhunter, C. 2016, A&AR, 24, 10
- Taylor et al. (1992) Taylor, G. B., Inoue, M. & Tabara, H. 1992, A&A, 264, 415
- Taylor (2005) Taylor, M. B. 2005, ASP Conf. Ser., 347, 29
- Tremblay et al. (2009) Tremblay, G. R., Chiaberge, M., Sparks, W. B. et al. 2009 ApJS, 183, 278
- Tyul’bashev & Chernikov (2000) Tyul’bashev, S. A. & Chernikov, P. A. 2000, ARep, 44, 286
- van Breugel et al. (1992) van Breugel, W. J. M., Fanti, C., Fanti, R. et al. 1992, A&A, 256,56
- Wilkes et al. (2013) Wilkes, B. J., Kuraszkiewicz, J., Haas, M. et al. 2013, ApJ, 773, 15
- Wright et al. (2010) Wright, E. L., Eisenhardt, P. R. M., Mainzer, A. K. et al. 2010, AJ, 140, 1868
Appendix A A. Images of the sources
Although for many radio sources in our sample the X-ray data are comprised of rather few counts, the radio morphologies are shown here via contour diagrams which are superposed on X-ray images. The Chandra images shown are in units of counts/pixel in the 0.5-7 keV energy range. All the X-ray images were re-gridded with a bin factor 1/4 to obtain a common pixel size of 0.123″, and then smoothed with a Gaussian function. The full width half maximum (FWHM) of the Gaussian smoothing function is given in the figure captions, as well as the increasing factors of the radio contours overlaid. Figures appear different from each other because of the wide range in angular size of the radio sources and it is worth noting that 3CR 27 and 3CR 69 are in a different redshift range than the other sources.
Appendix B B. X-ray observations of the 3CR sample
In Table LABEL:tab:3CRtab we list the summary of the X-ray observations for the 3CR extragalactic sample carried out with Chandra and XMM-Newton.
Chandra X-ray observations have been uniformly analysed, as reported in our previous and current investigations, as part of the Chandra 3CR survey project. The 3CR extragalactic portion of the catalog includes 298 sources (Spinrad et al., 1985). Adopting a step-wise strategy, we requested the observation of small subsamples in each cycle, to minimize the impact on the Chandra schedule. The full observational coverage of all 3CR sources with 0.3 was achieved during Chandra Cycles 9 and 12, for a total of 56 sources observed (Massaro et al., 2010, 2012). An additional 19 3CR radio galaxies were published in 2013 (0.30.5, Chandra Cycle 13, in Massaro et al., 2013) and a data paper presenting the most recent observations of 23 sources was accepted in 2017 (0.51.0, Cycle 15, in Massaro et al., 2018). We also performed a uniform re-analysis of 140 objects, listed in the Chandra archive, adopting the same data reduction procedures, from which we excluded 7 sources that have been extensively discussed in the literature and three other sources for PI reasons (Massaro et al., 2011, 2015, and references therein). Several subsets of the 3CR sample have been also observed by other groups (e.g. Balmaverde et al., 2012; Wilkes et al., 2013). Here we present an update of the summary also including the 16 targets analysed in the present work (Cycle 17).
Of the remaining 34 sources unobserved by Chandra, 25 are still unidentified, lacking an assigned optical/IR counterpart. We recently observed 21 of these 25 targets with Swift snapshot observations discovering X-ray counterparts of eleven of them, but even using optical and ultraviolet data available from the instruments on board of the Swift satellite, we could not discern their optical counterparts (Maselli et al., 2016).
The XMM-Newton archive covers to date 35% of the entire 3CR extragalactic catalog and all the information provided here is only based on literature search (see e.g. Croston et al., 2005; Evans et al., 2006; Belsole et al., 2007; Croston et al., 2008; Laskar et al., 2010; Shelton et al., 2011; Ineson et al., 2013; Mannering et al., 2013; Ineson et al., 2017, and references therein for more details)
We report the 3CR name, the updated value of the redshift and the radio classification of each source, labeling: radio galaxies (RG), according to the Fanaroff & Riley criterion (Fanaroff & Riley, 1974); quasars (i.e., QSO); Seyfert galaxies (Sy) and BL Lac objects (BL). We indicate as “UNID” those sources lacking a clear optical/IR counterpart. Then we also added a column reporting the radio morphology for the radio galaxies (FR I FR II classes) and indicating those objects that also show the radio structure of: (i) Compact Steep Spectrum (CSS) or X-shaped (XS) radio sources or (ii) have been classified in the literature as wide-angle tailed or narrow-angle tailed radio galaxies (WAT and NAT, respectively). We devoted a column to the optical classification of radio galaxies distinguishing between HERG or LERG. We used a “cluster flag” to label sources for which there is an associated optical group/cluster reported in the literature and/or those for which an archival X-ray observation confirms the presence of hot gas in the intracluster medium.
For what concerns the X-ray, we verified the presence of Chandra or XMM-Newton observations indicating with different symbols if the source was already observed by Chandra (c) and/or XMM-Newton (x). We report X-ray detections of radio components ,i.e., jet knot, hotspot or lobe, with the symbols , , and , respectively. The symbol was used to indicate the detection of X-ray emitting intergalactic medium. For Chandra observations we also adopted the symbol for the sources which show extended X-ray emission around the nucleus highlighted in our analyses by the “Extent Ratio” measurements (see § 3.2). For XMM-Newton observations we only adopted and labels due to the lower angular resolution with respect to Chandra that does not allow us to see counterparts of jet knots and hotspots in a large fraction of the 3CR sources.
| 3CRaafootnotemark: | bbfootnotemark: | Classccfootnotemark: | Radioddfootnotemark: | Opticaleefootnotemark: | Clusterfffootnotemark: | X-rayggfootnotemark: | Chandra hhfootnotemark: | XMM-Newtoniifootnotemark: |
|---|---|---|---|---|---|---|---|---|
| name | morph. | class | flag | obs. | detections | detections | ||
| 2.0 | 1.037 | QSO | c | e | ||||
| 6.1 | 0.840 | RG | FRII | HERG | c | h | ||
| 9.0 | 2.020 | QSO | LDQ | c | k;l | |||
| 11.1 | ? | UNID | - | - | x | |||
| 13.0 | 1.351 | RG | FRII | HERG | c-x | e;h | ||
| 14.0 | 1.469 | QSO | c | |||||
| 14.1 | ? | UNID | - | - | x | |||
| 15.0 | 0.074 | RG | FRI | LERG | c | k;l | ||
| 16.0 | 0.405 | RG | FRII | HERG | c-x | e;h;l | ||
| 17.0 | 0.220 | QSO | c | k | ||||
| 18.0 | 0.188 | RG | FRII | HERG | c | e | ||
| 19.0 | 0.482 | RG | FRII | LERG | ✓ | c-x | h;igm | |
| 20.0 | 0.174 | RG | FRII | HERG | c-x | |||
| 21.1 | ? | UNID | - | - | x | |||
| 22.0 | 0.936 | RG | FRII | c | ||||
| 27.0 | 0.184 | RG | FRII | HERG | c | |||
| 28.0 | 0.195 | RG | FRI | LERG | ✓ | c-x | igm | igm |
| 29.0 | 0.045 | RG | FRI | LERG | ✓ | c | k;igm | |
| 31.0 | 0.017 | RG | FRI | LERG | ✓ | c-x | k | igm |
| 33.0 | 0.060 | RG | FRII | HERG | ✓ | c-x | h:l | l;igm |
| 33.1 | 0.181 | RG | FRII | HERG | c | |||
| 33.2 | ? | UNID | - | - | x | |||
| 34.0 | 0.69 | RG | FRII | HERG | ✓ | c | igm | |
| 35.0 | 0.067 | RG | FRII | LERG | ✓ | c-x | e;l | l;igm |
| 36.0 | 1.301 | RG | FRII | HERG | c | |||
| 40.0 | 0.018 | RG | FRI-WAT | LERG | ✓ | c-x | igm | igm |
| 41.0 | 0.795 | RG | FRII | HERG | c | h | ||
| 42.0 | 0.396 | RG | FRII | HERG | c-x | |||
| 43.0 | 1.459 | QSO | CSS | c | ||||
| 44.0 | 0.66 | QSO | ✓ | c | ||||
| 46.0 | 0.437 | RG | FRII | HERG | ✓ | c-x | igm | |
| 47.0 | 0.425 | QSO | LDQ | c | h;l | |||
| 48.0 | 0.367 | QSO | CSS | c | ||||
| 49.0 | 0.236 | RG | FRII-CSS | HERG | c | |||
| 52.0 | 0.29 | RG | FRII-XS | HERG | ✓ | c | h | |
| 54.0 | 0.827 | RG | FRII | HERG | c | h | ||
| 55.0 | 0.735 | RG | FRII | HERG | c-x | |||
| 61.1 | 0.188 | RG | FRII | HERG | c-x | h | ||
| 63.0 | 0.175 | RG | FRII-XS | HERG | c | |||
| 65.0 | 1.176 | RG | FRII | HERG | c-x | e;h | ||
| 66A | ? | BL | - | ✓ | c-x | |||
| 66B | 0.0213 | RG | FRI | LERG | ✓ | c-x | k | igm |
| 67.0 | 0.310 | RG | FRII-CSS | c-x | ||||
| 68.1 | 1.238 | QSO | c | |||||
| 68.2 | 1.575 | RG | FRII | HERG | c | e;h | ||
| 69.0 | 0.458 | RG | FRII | HERG | c | |||
| 71.0 | 0.004 | SEY | - | Sy2 | c-x | |||
| 75.0 | 0.023 | RG | FRI-WAT | LERG | ✓ | c-x | igm | igm |
| 76.1 | 0.032 | RG | FRI | LERG | ✓ | c-x | igm | igm |
| 78.0 | 0.029 | RG | FRI | LERG | c | k | ||
| 79.0 | 0.256 | RG | FRII | HERG | ✓ | c-x | igm | |
| 83.1 | 0.025 | RG | FRI-NAT | LERG | ✓ | c-x | k;igm | igm |
| 84.0 | 0.018 | RG | FRI | LERG | ✓ | c-x | igm | igm |
| 86.0 | ? | UNID | - | - | ||||
| 88.0 | 0.030 | RG | FRI | LERG | ✓ | c-x | k;igm | igm |
| 89.0 | 0.140 | RG | FRI-WAT | LERG | ✓ | c | igm | |
| 91.0 | ? | UNID | - | - | ||||
| 93.0 | 0.357 | QSO | c | e | ||||
| 93.1 | 0.243 | RG | FRII-CSS | HERG | ✓ | c | ||
| 98.0 | 0.030 | RG | FRII | HERG | c-x | l | l | |
| 99.0 | 0.426 | SEY | - | Sy2 | c | |||
| 103.0 | 0.33 | RG | FRII | c | ||||
| 105.0 | 0.089 | RG | FRII | HERG | c-x | k;h | ||
| 107.0 | 0.785 | RG | FRII | HERG | c | e | ||
| 109.0 | 0.307 | RG | FRII | HERG | c-x | h;l | ||
| 111.0 | 0.049 | RG | FRII | c-x | k;h | |||
| 114.0 | 0.815 | RG | FRII | LERG | c | |||
| 119.0 | 1.023 | QSO | CSS | c | ||||
| 123.0 | 0.218 | RG | FRII | LERG | ✓ | c | h;igm | |
| 124.0 | 1.083 | RG | FRII | HERG | c | l | ||
| 125.0 | ? | UNID | - | - | ||||
| 129.0 | 0.021 | RG | FRI-NAT | ✓ | c-x | k;igm | igm | |
| 129.1 | 0.022 | RG | FRI | ✓ | c-x | igm | igm | |
| 130.0 | 0.109 | RG | FRI-WAT | ✓ | c | e | ||
| 131.0 | ? | UNID | - | - | ||||
| 132.0 | 0.214 | RG | FRII | LERG | ✓ | c-x | ||
| 133.0 | 0.278 | RG | FRII | HERG | c | |||
| 134.0 | ? | UNID | - | - | ||||
| 135.0 | 0.127 | RG | FRII | HERG | ✓ | c | ||
| 136.1 | 0.064 | RG | FRII-XS | HERG | c | e | ||
| 137.0 | ? | UNID | - | - | ||||
| 138.0 | 0.759 | QSO | CSS | c | ||||
| 139.2 | ? | UNID | - | - | ||||
| 141.0 | ? | UNID | - | - | ||||
| 142.1 | 0.406 | RG | FRII | c | ||||
| 147.0 | 0.545 | QSO | CSS | c | ||||
| 152.0 | ? | UNID | - | - | ||||
| 153.0 | 0.277 | RG | FRII | LERG | ✓ | c-x | ||
| 154.0 | 0.58 | QSO | c | e;k | ||||
| 158.0 | ? | UNID | - | - | ||||
| 165.0 | 0.296 | RG | FRII | LERG | c | e | ||
| 166.0 | 0.245 | RG | FRII | LERG | c | |||
| 169.1 | 0.633 | RG | FRII | HERG | c | |||
| 171.0 | 0.238 | RG | FRII | HERG | c-x | e | ||
| 172.0 | 0.519 | RG | FRII | HERG | c | |||
| 173.0 | 1.035 | QSO | CSS | HERG | c | |||
| 173.1 | 0.292 | RG | FRII | LERG | ✓ | c | h;l | |
| 175.0 | 0.77 | QSO | c | |||||
| 175.1 | 0.92 | RG | FRII | HERG | c | |||
| 180.0 | 0.22 | RG | FRII | HERG | c | |||
| 181.0 | 1.382 | QSO | c | h | ||||
| 184.0 | 0.994 | RG | FRII | HERG | ✓ | c-x | l | igm |
| 184.1 | 0.118 | RG | FRII | HERG | ✓ | c | ||
| 186.0 | 1.066 | QSO | CSS | ✓ | c | igm | ||
| 187.0 | 0.465 | RG | FRII | LERG | c | e;l | ||
| 190.0 | 0.246 | QSO | CSS | c | ||||
| 191.0 | 1.968 | QSO | c | k;l | ||||
| 192.0 | 0.060 | RG | FRII-XS | HERG | ✓ | c-x | l | igm |
| 194.0 | 1.184 | RG | FRII | HERG | c | |||
| 196.0 | 0.871 | QSO | c | |||||
| 196.1 | 0.198 | RG | FRII | LERG | ✓ | c | igm | |
| 197.1 | 0.128 | RG | FRII | HERG | ✓ | c | ||
| 198.0 | 0.081 | RG | FRII | HERG | ✓ | c | ||
| 200.0 | 0.458 | RG | FRII | LERG | ✓ | c | k;l | |
| 204.0 | 1.112 | QSO | c-x | |||||
| 205.0 | 1.532 | QSO | c-x | |||||
| 207.0 | 0.680 | QSO | LDQ | ✓ | c-x | k;l | igm | |
| 208.0 | 1.112 | QSO | c | |||||
| 208.1 | 1.02 | QSO | c-x | |||||
| 210.0 | 1.169 | RG | FRII | HERG | ✓ | c-x | e;h | igm |
| 212.0 | 1.049 | QSO | LDQ | c | e;h | |||
| 213.1 | 0.194 | RG | FRI-CSS | LERG | ✓ | c | e;h | |
| 215.0 | 0.411 | QSO | ✓ | c-x | k;l | |||
| 216.0 | 0.670 | QSO | c | |||||
| 217.0 | 0.898 | RG | FRII | HERG | c | |||
| 219.0 | 0.175 | RG | FRII | HERG | ✓ | c | k;l | |
| 220.1 | 0.61 | RG | FRII | HERG | ✓ | c | igm | |
| 220.2 | 1.156 | QSO | c | h | ||||
| 220.3 | 0.68 | RG | FRII | HERG | c | |||
| 222.0 | 1.339 | RG | FRI | c | ||||
| 223.0 | 0.137 | RG | FRII | HERG | ✓ | c-x | igm | |
| 223.1 | 0.108 | RG | FRII-XS | HERG | c | |||
| 225A | 1.565 | RG | FRII | HERG | c | |||
| 225B | 0.58 | RG | FRII | HERG | c | h | ||
| 226.0 | 0.818 | RG | FRII | HERG | c | |||
| 227.0 | 0.086 | RG | FRII | HERG | c | h | ||
| 228.0 | 0.552 | RG | FRII | HERG | c | e;h | ||
| 230.0 | 1.487 | RG | FRII | HERG | c | |||
| 231.0 | 0.001 | RG | FRI | LERG | c-x | |||
| 234.0 | 0.185 | RG | FRII | HERG | c-x | h | ||
| 236.0 | 0.101 | RG | FRII | LERG | c | |||
| 237.0 | 0.877 | RG | FRII-CSS | c | ||||
| 238.0 | 1.405 | RG | FRII | HERG | c | h | ||
| 239.0 | 1.781 | RG | FRII | HERG | x | |||
| 241.0 | 1.617 | RG | FRII | c-x | ||||
| 244.1 | 0.428 | RG | FRII | HERG | ✓ | c-x | e | |
| 245.0 | 1.028 | QSO | c | k | ||||
| 247.0 | 0.749 | RG | FRII | HERG | ✓ | c | ||
| 249.0 | 1.554 | QSO | x | |||||
| 249.1 | 0.312 | QSO | c-x | |||||
| 250.0 | ? | UNID | - | - | ||||
| 252.0 | 1.1 | RG | FRII | HERG | c | |||
| 254.0 | 0.737 | QSO | LDQ | c | e;h | |||
| 255.0 | 1.355 | RG | FRII(?) | HERG | c | |||
| 256.0 | 1.819 | RG | FRII | HERG | c | |||
| 257.0 | 2.474 | QSO | x | |||||
| 258.0 | 0.165 | RG | FRI-CSS | LERG | ✓ | c | ||
| 263.0 | 0.646 | QSO | LDQ | c | h | |||
| 263.1 | 0.824 | RG | FRII | HERG | c | |||
| 264.0 | 0.022 | RG | FRI | LERG | ✓ | c-x | k | igm |
| 265.0 | 0.811 | RG | FRII | HERG | c | h;l | ||
| 266.0 | 1.275 | RG | FRII | HERG | c-x | |||
| 267.0 | 1.14 | RG | FRII | HERG | c | |||
| 268.1 | 0.97 | RG | FRII | HERG | c | h | ||
| 268.2 | 0.362 | RG | FRII | HERG | ✓ | c-x | e;h | |
| 268.3 | 0.372 | RG | FRII-CSS | c | ||||
| 268.4 | 1.402 | QSO | c-x | |||||
| 270.0 | 0.007 | RG | FRI | LERG | ✓ | c-x | k | igm |
| 270.1 | 1.528 | QSO | c | |||||
| 272.0 | 0.944 | RG | FRII | HERG | c | |||
| 272.1 | 0.003 | RG | FRI | LERG | ✓ | c-x | k | |
| 273.0 | 0.158 | QSO | CDQ | c-x | k | |||
| 274.0 | 0.004 | RG | FRI | LERG | ✓ | c-x | k;igm | igm |
| 274.1 | 0.422 | RG | FRII | HERG | c-x | e | l | |
| 275.0 | 0.48 | RG | FRII | LERG | ✓ | c | ||
| 275.1 | 0.555 | QSO | LDQ | c | k;h;l | |||
| 277.0 | 0.414 | RG | FRII | c | ||||
| 277.1 | 0.320 | QSO | CSS | c | ||||
| 277.2 | 0.766 | RG | FRII | HERG | c-x | |||
| 277.3 | 0.085 | RG | FRII | HERG | c | |||
| 280.0 | 0.996 | RG | FRII | HERG | ✓ | c-x | k;h;l | |
| 280.1 | 1.667 | QSO | ||||||
| 284.0 | 0.240 | RG | FRII | HERG | ✓ | c-x | igm | |
| 285.0 | 0.080 | RG | FRII | HERG | c | l | ||
| 286.0 | 0.850 | QSO | CSS | c | ||||
| 287.0 | 1.055 | QSO | CSS | c-x | ||||
| 287.1 | 0.216 | RG | FRII | HERG | c | h | ||
| 288.0 | 0.246 | RG | FRI | LERG | ✓ | c | igm | |
| 288.1 | 0.963 | QSO | c | |||||
| 289.0 | 0.967 | RG | FRII | HERG | c | |||
| 292.0 | 0.71 | RG | FRII | HERG | ✓ | c-x | e | igm |
| 293.0 | 0.045 | RG | FRI | LERG | c | e | ||
| 293.1 | 0.709 | RG | FRII | c | ||||
| 294.0 | 1.779 | RG | FRII | HERG | ✓ | c | h;igm | |
| 295.0 | 0.464 | RG | FRII | LERG | ✓ | c | h;igm | |
| 296.0 | 0.025 | RG | FRI | LERG | ✓ | c-x | k;igm | igm |
| 297.0 | 1.406 | QSO | c | k;e | ||||
| 298.0 | 1.438 | QSO | CSS | ✓ | c-x | igm | ||
| 299.0 | 0.367 | RG | FRII | ✓ | c | h | ||
| 300.0 | 0.27 | RG | FRII | HERG | c-x | |||
| 300.1 | 1.159 | RG | FRII | HERG | c | |||
| 303.0 | 0.141 | RG | FRII | HERG | ✓ | c | k;l | |
| 303.1 | 0.270 | RG | FRII-CSS | HERG | c-x | e | ||
| 305.0 | 0.042 | RG | FRII | HERG | c-x | e | ||
| 305.1 | 1.132 | RG | FRII-CSS | LERG | c | |||
| 306.1 | 0.441 | RG | FRII | HERG | ✓ | c | e | |
| 309.1 | 0.905 | QSO | CSS | c | e | |||
| 310.0 | 0.054 | RG | FRI | LERG | ✓ | c | igm | |
| 313.0 | 0.461 | RG | FRII | HERG | ✓ | c | h;igm | |
| 314.1 | 0.120 | RG | FRI | LERG | ✓ | c-x | ||
| 315.0 | 0.108 | RG | FRI-XS | LERG | ✓ | c | e | |
| 317.0 | 0.034 | RG | FRI | LERG | ✓ | c-x | igm | igm |
| 318.0 | 1.574 | RG | FRII-CSS | ✓ | c-x | |||
| 318.1 | 0.045 | RG | FRI | LERG | ✓ | c-x | igm | igm |
| 319.0 | 0.192 | RG | FRII | LERG | ✓ | c-x | ||
| 320.0 | 0.342 | RG | FRII | LERG | ✓ | c | igm | |
| 321.0 | 0.096 | RG | FRII | HERG | c-x | h;l | ||
| 322.0 | 1.681 | RG | FRII | HERG | ✓ | x | igm | |
| 323.0 | 0.679 | RG | FRII | HERG | c | e | ||
| 323.1 | 0.264 | RG | FRII | HERG | ✓ | c | ||
| 324.0 | 1.206 | RG | FRII | HERG | ✓ | c-x | e;h | |
| 325.0 | 1.135 | RG | FRII | c | h | |||
| 326.0 | 0.090 | RG | FRII | LERG | c | l | ||
| 326.1 | 1.825 | RG | FRII | HERG | ||||
| 327.0 | 0.105 | RG | FRII | HERG | ✓ | c | h | |
| 327.1 | 0.462 | RG | FRI | HERG | c-x | k | ||
| 330.0 | 0.55 | RG | FRII | HERG | ✓ | c | h;l | |
| 332.0 | 0.151 | RG | FRII | HERG | ✓ | c | ||
| 334.0 | 0.555 | QSO | LDQ | c | k;l | |||
| 336.0 | 0.927 | QSO | c | |||||
| 337.0 | 0.635 | RG | FRII | HERG | ✓ | c-x | e | |
| 338.0 | 0.030 | RG | FRI | LERG | ✓ | c-x | igm | igm |
| 340.0 | 0.775 | RG | FRII | HERG | c | |||
| 341.0 | 0.448 | RG | FRII | HERG | ✓ | c-x | e;k | igm |
| 343.0 | 0.988 | QSO | CSS | c | ||||
| 343.1 | 0.75 | RG | FRII-CSS | c | ||||
| 345.0 | 0.593 | QSO | CDQ | ✓ | c-x | k | igm | |
| 346.0 | 0.162 | RG | FRI | HERG | ✓ | c | k | |
| 348.0 | 0.155 | RG | FRI | LERG | ✓ | c-x | igm | igm |
| 349.0 | 0.205 | RG | FRII | HERG | c-x | h | ||
| 351.0 | 0.372 | RG | FRII | c | h | |||
| 352.0 | 0.807 | RG | FRII | HERG | c | |||
| 353.0 | 0.030 | RG | FRII | LERG | ✓ | c-x | k:l:igm | igm |
| 356.0 | 1.079 | RG | FRII | HERG | c | e | ||
| 357.0 | 0.166 | RG | FRII | LERG | ✓ | c | ||
| 368.0 | 1.131 | RG | FRII | HERG | c | |||
| 371.0 | 0.051 | BL | - | c | k | |||
| 379.1 | 0.256 | RG | FRII-XS | HERG | c | |||
| 380.0 | 0.692 | QSO | CDQ | c | k | |||
| 381.0 | 0.161 | RG | FRII | HERG | c | |||
| 382.0 | 0.058 | RG | FRII | HERG | c-x | |||
| 386.0 | 0.017 | RG | FRI | LERG | ✓ | c-x | igm | |
| 388.0 | 0.092 | RG | FRII | LERG | ✓ | c | e | |
| 389.0 | ? | UNID | - | - | x | |||
| 390.0 | ? | UNID | - | - | ||||
| 390.3 | 0.056 | RG | FRII | HERG | c-x | k;h | ||
| 394.0 | ? | UNID | - | - | ||||
| 399.1 | ? | UNID | - | - | ||||
| 401.0 | 0.201 | RG | FRII | LERG | ✓ | c | igm | |
| 402.0 | 0.026 | RG | FRI | ✓ | c-x | k | ||
| 403.0 | 0.059 | RG | FRII-XS | HERG | c | k;h | ||
| 403.1 | 0.055 | RG | FRII | LERG | ✓ | c | ||
| 405.0 | 0.056 | RG | FRII | ✓ | c-x | h;igm | igm | |
| 409.0 | ? | UNID | - | - | ||||
| 410.0 | 0.249 | RG | FRII | c | ||||
| 411.0 | 0.467 | RG | FRII | HERG | c-x | |||
| 415.2 | ? | UNID | - | - | ||||
| 418.0 | 1.686 | QSO | ||||||
| 424.0 | 0.127 | RG | FRI | LERG | ✓ | c | e | |
| 427.1 | 0.572 | RG | FRII | LERG | ✓ | c | l;igm | |
| 428.0 | ? | UNID | - | - | ||||
| 430.0 | 0.056 | RG | FRII | LERG | ✓ | c | e | |
| 431.0 | ? | UNID | - | - | ||||
| 432.0 | 1.785 | QSO | c-x | |||||
| 433.0 | 0.102 | RG | FRII-XS | HERG | c | l | ||
| 434.0 | 0.322 | RG | FRII | LERG | ✓ | c | ||
| 435.0 | 0.471 | RG | FRII | HERG | c | |||
| 436.0 | 0.215 | RG | FRII | HERG | c-x | e;h | ||
| 437.0 | 1.48 | RG | FRII | HERG | c | e;h | ||
| 438.0 | 0.29 | RG | FRII | HERG | ✓ | c | igm | |
| 441.0 | 0.708 | RG | FRII | HERG | c | |||
| 442.0 | 0.026 | RG | FRI | LERG | ✓ | c | igm | |
| 445.0 | 0.056 | RG | FRII | ✓ | c-x | h | ||
| 449.0 | 0.017 | RG | FRI | LERG | ✓ | c-x | igm | igm |
| 452.0 | 0.081 | RG | FRII | HERG | ✓ | c-x | h;l | igm |
| 454.0 | 1.757 | QSO | CSS | x | ||||
| 454.1 | 1.841 | RG | FRII-CSS | ✓ | ||||
| 454.2 | ? | UNID | - | - | ||||
| 454.3 | 0.859 | QSO | CDQ | c-x | k | |||
| 455.0 | 0.543 | QSO | CSS | c | ||||
| 456.0 | 0.233 | RG | FRII | HERG | c | |||
| 458.0 | 0.289 | RG | FRII | HERG | ✓ | c | h | |
| 459.0 | 0.220 | RG | FRII | HERG | c-x | l | ||
| 460.0 | 0.268 | RG | FRII | LERG | ✓ | c-x | ||
| 465.0 | 0.030 | RG | FRI-WAT | LERG | ✓ | c-x | k;igm | igm |
| 468.1 | ? | UNID | - | - | ||||
| 469.1 | 1.336 | RG | FRII | HERG | c-x | l | ||
| 470.0 | 1.653 | RG | FRII | c | h |
Notes.
aafootnotemark: The 3CR name.
bbfootnotemark: Redshift . We also verified in the literature (e.g., NED/IPAC and/or SIMBAD databases) if updated values were reported after the release of the 3CR catalog.
ccfootnotemark: The source classification: RG stands for radio galaxies, QSO for quasars; Sy for Seyfert galaxies and BL for BL Lac objects. We used the acronym UNID for sources that are still unidentified.
ddfootnotemark: The radio morphological classification: FR I and FR II refer to the Fanaroff and Riley classification criterion (Fanaroff & Riley, 1974) while LDQ and CDQ is sometimes adopted for lobe-dominated and core-dominated quasars; we also indicated if in the literature the source is classified as CSS or if the radio structure is X-shaped (XS), or if it is a narrow or wide angle tailed radio galaxy (NAT and WAT, respectively).
eefootnotemark: The optical spectroscopic designation: LERG, “Low Excitation Radio Galaxy”, HERG, “High Excitation Radio Galaxy”.
fffootnotemark: The “cluster flag” marks sources for which there is a known optical group/cluster reported in the literature and/or those for which there is an archival X-ray observation indicating the presence of hot gas.
ggfootnotemark: The c flag indicates that at least one Chandra observation is present in its archive while the x flag refers to the XMM-Newton archive.
hhfootnotemark: In this column we report if the source has a radio component with an X-ray counterpart in a Chandra observation. We used the following labels: = jet knot; = hotspot; = lobe; = extended X-ray emission around the nucleus and = emission associated with the presence of hot gas.
iifootnotemark: The same as the previous column but for the XMM-Newton observations, we used only and .