Microscopic Investigation of Vortex Breakdown in a Dividing T-Junction Flow
Abstract
3D-printed microfluidic devices offer new ways to study fluid dynamics. We present the first clear visualization of vortex breakdown in a dividing T-junction flow. By individual control of the inflow and two outflows, we decouple the effects of swirl and rate of vorticity decay. We show that even slight outflow imbalances can greatly alter the structure of vortex breakdown, by creating a net pressure difference across the junction. Our results are summarized in a dimensionless phase diagram, which will guide the use of vortex breakdown in T-junctions to achieve specific flow manipulation.
pacs:
Microfluidic devices containing junctions serve as versatile platforms for studying many fundamental problems in physics, engineering and biology. These devices have been used to explore various flow phenomena, such as droplet generation Teh et al. (2008), liquid-liquid mixing Nguyen and Wu (2004), and hydrodynamic trapping Tanyeri et al. (2011). Moreover, they have been exploited for rheological measurements Pipe and McKinley (2009), single-molecule studies Hsiao et al. (2017); Klotz et al. (2017), and biophysical experiments Wheeler et al. (2003); Cha et al. (2012). Despite their simple geometries, junctions exhibit complex hydrodynamic behaviors such as the formation of vortices due to Dean instability Bălan et al. (2012); Zhang et al. (2015); Nivedita et al. (2017); Damian et al. (2017) or spontaneous symmetry breaking Haward et al. (2016), particularly when inertial effects (as quantified by the Reynolds number ) are dominant. Of particular interest is the dividing T-junction with square cross-section, for which the inflow splits in opposite directions through two symmetrical outlets. Here, axisymmetric vortex breakdown is predicted to occur when the inlet Reynolds number exceeds the critical threshold Vigolo et al. (2014); Chen et al. (2015); Ault et al. (2016); Chen et al. (2017).
Axisymmetric vortex breakdown, the development of bubble-like regions inside which the flow recirculates, is possible when vorticity decay is present in a swirling flow Lucca-Negro and O’Doherty (2001). Early studies were conducted in cylindrical tubes Harvey (1962); Cassidy and Falvey (1970); Sarpkaya (1971); Faler and Leibovich (1978); Escudier (1984); Escudier and Keller (1985); Chao et al. (1991); Brücker and Althaus (1992); Brücker (1993) or by delta wings Lowson (1964); Hummel and Srinivasan (1967); Gad-el Hak and Blackwelder (1985); McKernan et al. (1988), using dye-based flow visualization, Particle Tracking Velocimetry (PTV) Raffel et al. (2013) or Laser Doppler Anemometry (LDA) Abbiss et al. (1974). While much knowledge has been gained, there has still been no clear and unambiguous visualizations of the phenomenon, for it was difficult to capture the whole structure of vortex breakdown clearly in a single image using large experimental setups. For example, Bottausci and Petitjeans Bottausci and Petitjeans (2002) used small jets of dye to visualize the external spiraling structure of vortex breakdown, but the relatively small internal structure was invisible due to dye diffusion. In principle, microfluidics allows microscopic investigation of different flow phenomena, which opens a new door to uncovering the full structure of vortex breakdown. However, to date vortex breakdown in microfluidic devices has only been shown via numerical simulations and inferred experimentally from qualitative observations of the trapping of particles and air bubbles Vigolo et al. (2014); Chen et al. (2015); Ault et al. (2016); Chen et al. (2017). A main aim of this work is to make the first-ever direct observation of the vortex breakdown, and to provide new insight into its physical mechanism.
We use a unique setup that allows multiple planes of observation and high-contrast imaging of recirculating streamlines in a microfluidic device, to report the full structure of vortex breakdown in a dividing T-junction flow. We effectively control the vorticity decay in the two outlets for a fixed vorticity at the junction center, by manipulating the two fundamental flow parameters that govern the vortex breakdown in T-junctions: the inflow and the ratio of the two outflows. This is important for many flow systems, since outflow imbalances can easily arise due to imprecise control of the flowrates, or asymmetries in the channel dimensions and pressure drops. First, we show by micro-Particle Image Velocimetry (PIV) Meinhart et al. (1999) how vortices form at the junction, and that the vorticity at the junction center can be treated as a constant when the ratio of the two outflows is varied. Such variation of even a few percent can alter the structures of the vortex breakdown and the critical Reynolds number. Finally, we perform numerical simulations to gain further insights into the mechanism of the vortex breakdown.
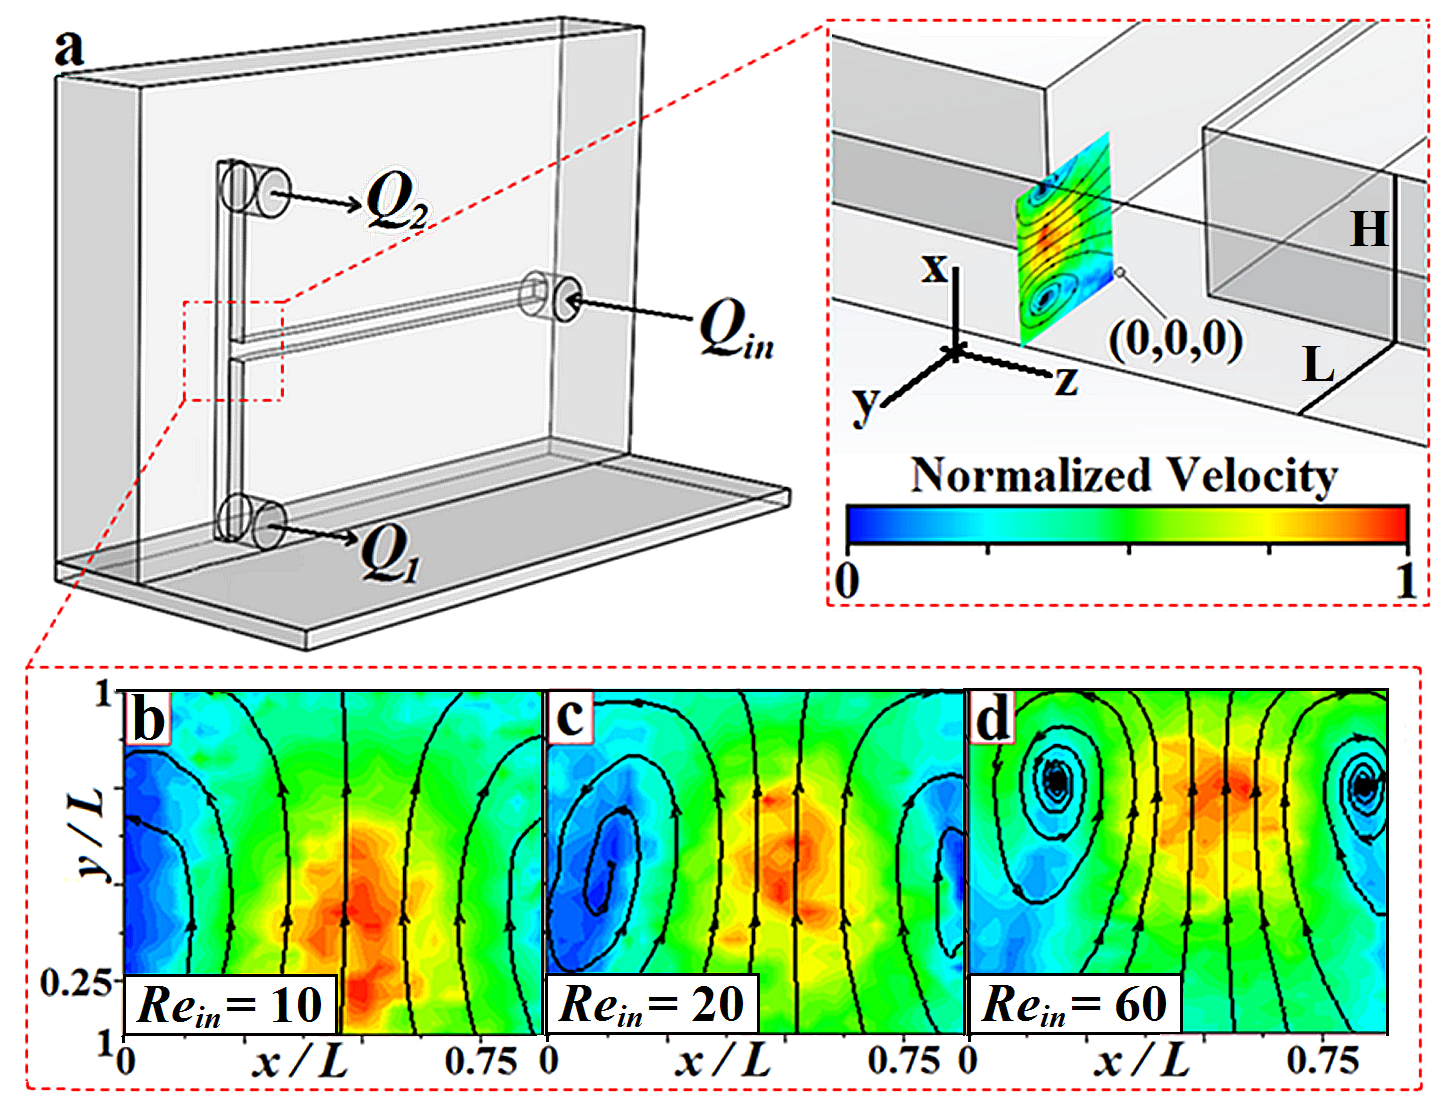
The microfluidic T-junction device [Fig. 1(a)], with square cross-section of sides m was fabricated in glass by Selective Laser-induced Etching (SLE) Hnatovsky et al. (2006). The device was mounted vertically on a glass slide to image the flow through the - or - plane. The inlet length was , which ensures the flow is fully developed before the junction. The outlet lengths were , corresponding to the working distance of the microscopes. Combining this device with PIV and flow visualization provides access to the formation process and breakdown structure of the vortices. We denote the inflow as , and the respective outflows towards outlets 1 and 2 as and . We use the inlet Reynolds number , where is the fluid density and is the viscosity, to describe the inlet flow velocity in a dimensionless form. Similarly, we use and for the two outflows. We define an imbalance index to quantify the level of imbalance between the two outflows. When , the outflows are balanced. When , the inflow is directed towards outlet 1 completely. To control and simultaneously, the T-junction flow was driven by three individually controlled neMESYS syringe pumps (Cetoni GmbH, Germany), which are equipped with ml glass syringes (Hamilton Gastight, Reno, NV). One of the syringes varies to control , while the other two vary and to control . The pumps were operated at a minimum of the specified lowest pulsation-free flowrate, above which the syringe pistons are moved without vibration.
For PIV, red fluorescent polystyrene particles of diameter m and density g/cm3 were seeded in deionized water and volumetrically illuminated by a nm dual-pulsed Nd:YLF laser (Terra PIV, Continuum Inc., CA) with averaged power of W, repetition rate of Hz and pulse duration of ns. The time separation between laser pulses was s s depending on the flowrate. Images were captured by a high speed CMOS camera (Phantom Miro M310, Vision Research Inc., NJ) connected to an inverted microscope (Nikon ECLIPSE T-S) with a NA objective. The measurement depth Meinhart et al. (2000) over which particles contribute to the determination of the flow field was m .
For flow visualization to trace flow streamlines, green fluorescent polystyrene particles of diameter m and density g/cm3 were seeded in M sodium metatungstate solution of density g/cm3 and shear viscosity Pas. Particles were volumetrically illuminated by a metal halide lamp with a nm excitation filter, their trajectories were recorded with exposure time of ms by a spinning-disk confocal imaging system (DSD2, Andor Technology Ltd) connected to an inverted microscope (Nikon ECLIPSE T). For a wider field of view, a NA objective was used, the spatial resolution was m/pixel. While for a zoomed-in view, a NA objective was used, the spatial resolution was m/pixel. The density ratio ensures that the number of trapped particles is low Vigolo et al. (2014). As the particles have Stokes number over the range of we considered, they trace the streamlines with negligible error Samimy and Lele (1991). By continuity, streamlines from the inlet must connect to the outlets, which ensures that the particles stay in the vortex breakdown regions temporarily. Also, as the flow has lower velocity in the vortex breakdown regions, more fluorescent signals from the particles can be collected locally per frame. The above factors enhance the contrast of the particle trajectories in the vortex breakdown regions, which permits us to visualize the recirculating streamlines clearly. Tracing the vortex breakdown streamlines would otherwise be impossible by using air bubbles, as they accumulate easily due to their large size and low density Vigolo et al. (2014), which disturbs the flow field.
To gain deeper insight, we also performed finite volume, steady state, single phase flow simulations using ANSYS Fluent. The inlet and outlets of our T-junction model have square cross-section of side and channels of length . The model was divided into half due to symmetry over the plane, and discretized into elements. To correctly capture boundary layer effects, we refined the elements near the channel walls. The flow profile was fully developed before the junction. Further increasing the outlet lengths or resolution of mesh results in no significant difference in the flow patterns.
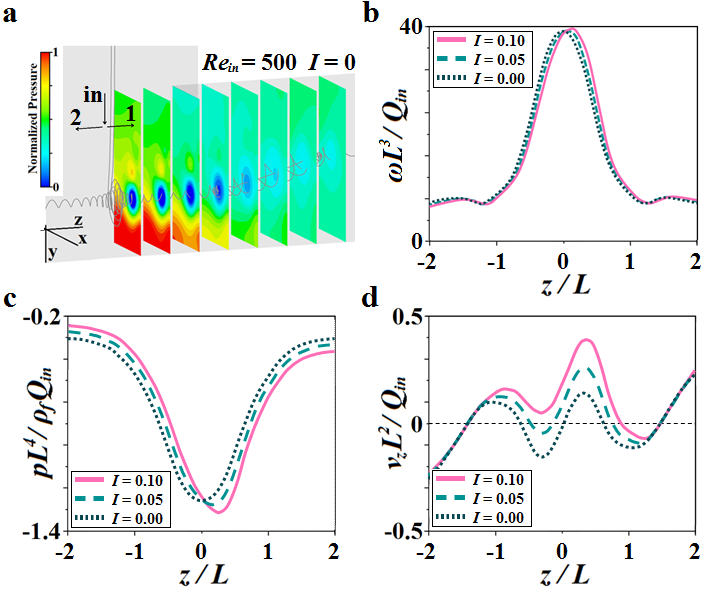
Before discussing vortex breakdown, it is helpful to first understand why vortices form within a T-junction. We performed PIV on the plane with (i.e., balanced outflows) [Figs. 1(b)-1(d)]. Increasing shifts the peak of the velocity distribution to the channel wall located at and creates a pair of counter-rotating vortices by the Dean mechanism Nivedita et al. (2017). As the flow changes direction at the junction, centrifugal force is generated, which drives the fluid and the peak of the velocity distribution to the channel wall. This induces high pressure at the wall and the induced pressure gradient then drives the fluid backward, thus forming the observed pair of vortices.
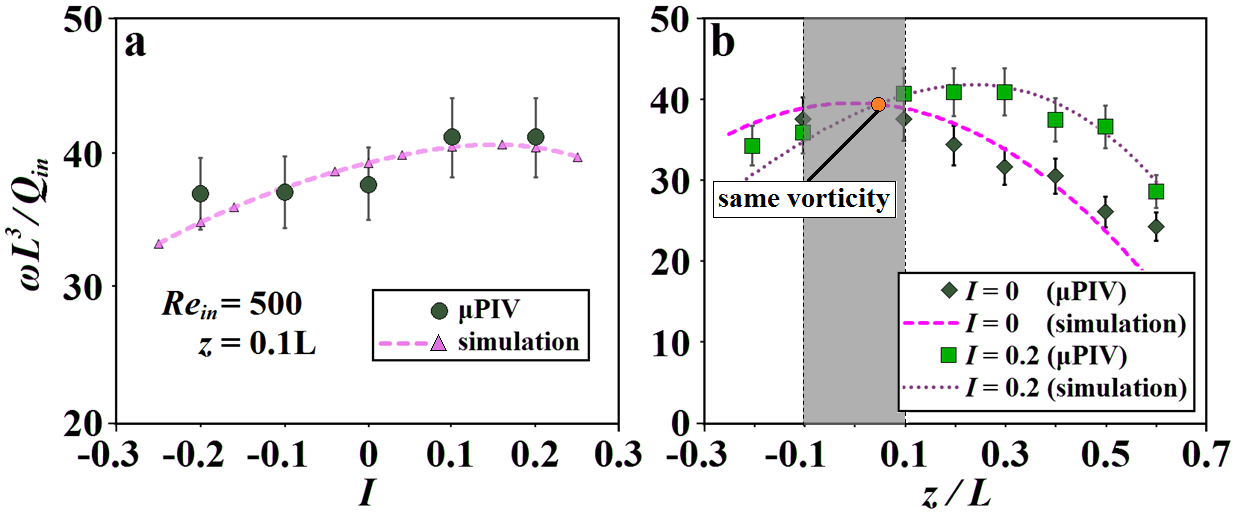
To investigate how outflow imbalances affect the Dean vortices, we measured the maximum vorticity of the PIV flow field, on , for ) and fixed [Fig. 2(a)]. The maximum vorticity corresponds to the vorticity of the vortex core. Measuring the vorticity for on is equivalent to measuring the vorticity for on , due to the mirror symmetry over . The data points of ) enclose that of . By the intermediate value theorem, within a narrow distance of , there exists at least one point on the vortex core of ) for which the vorticity is equal to that of . In other words, we can interpret that the vorticity is fixed at the junction center when is varied. To further justify this statement, we probed the core vorticities along the z-direction for and by both PIV and simulation [Fig. 2(b)]. Both results show that there exists a point between and (orange circle in Fig. 2(b)) where the core vorticities for and are equal. Hence, we can interpret that the effect of varying is to change the rate of vorticity decay in the two outlets at a fixed vorticity at the junction center. This provides a simple way to study how vorticity decay affects the vortex breakdown in a T-junction flow.
Next, to study how outflow imbalances affect vortex breakdown, we visualized the particle trajectories on the - plane (Fig. 3). With fixed and , we observed two symmetrical particle trapping regions in the two outlets [Figs. 3(a)-3(c)], whose size increases with . Here, the onset for particle trapping is consistent with the values reported previously Vigolo et al. (2014); Ault et al. (2016), where the T-junctions span over several length scales by combining our results. However, our results differ from those of Ault et al. Ault et al. (2016), for their observed trappings were mainly asymmetric, due to the accumulation of trapped air bubbles, which perturbs the flow field. With fixed and increasing , the trapping region in outlet 1 progressively shrinks until it vanishes at [Figs. 3(d)-3(f)]. Increasing further, the trapping region in outlet 2 also vanishes, the particles retract and then travel to outlet 1 [Fig. 3(g)]. Remarkably, we find trapping can be induced even for by increasing (see Fig. 3(h) for ). Zooming into the trapping region [Fig. 3(h)], we clearly observe that the particle trajectory resembles the vortex breakdown structure predicted numerically by Chen et al. Chen et al. (2017). Vigolo et al. Vigolo et al. (2014) also tracked the trajectories of air bubbles in the the T-junction, which showed spiraling shapes. However, our visualization is the first to simultaneously show both the internal and external spiraling structures of vortex breakdown. A movie corresponding to Fig. 3(a)-3(h) can be found in the Supplemental Material 35 (35).
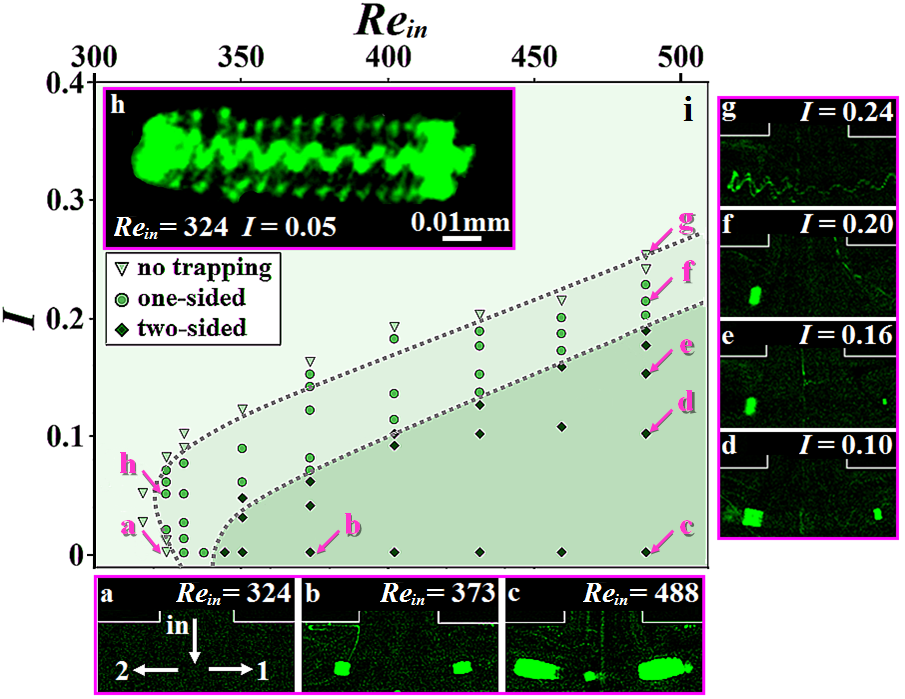
To summarize our experimental results, we constructed a phase diagram in the (-) plane based on the observed number of particle trapping regions (Fig. 3(i)). Here, our data extends the phase diagram in the - plane presented by Ault et al. Ault et al. (2016) into a new dimension at junction angle . Increasing extends the range of for which particles can get trapped. For and different , the trapping can be either one-sided or two-sided. As is increased from , two-sided trapping always occurs before one-sided trapping. For , one-sided trapping still occurs within a narrow range of . As the particle trapping phenomenon is described by two dimensionless parameters and , our phase diagram is applicable to all T-junctions having a square cross-section. Additionally, we have constructed two phase diagrams for T-junctions with the same inlet cross-sectional aspect ratio but outlet cross-sectional aspect ratios and (Figs. S1-S2). They are qualitatively similar to Fig. 3, there exists a range of and for which one-sided trapping occurs. However, we notice that modifies the flow separation at the junction corner, which in turns affects the orientation of the particle trapping regions. This constitutes a new physical phenomenon highlighting the wall-liquid interaction that deserves further investigation. The two additional phase diagrams are included in the Supplemental Material 35 (35).
With good agreement between the experimentally measured and numerically predicted vorticities [Fig. 2(a)-2(b)], we now use the T-junction model to relate our particle trapping observations to the vortex breakdown in the two outlets. The simulation result for and [Fig. 4(a)] agrees with that of Chen et al. Chen et al. (2017), for the flow recirculation zones in the two outlets are symmetric and bubble-like, which signifies axisymmetric vortex breakdown. Increasing , the recirculation zone in outlet 1 shrinks [Fig. 4(b)], corresponding to the particle trapping results [Figs. 3(d)-3(f)]. By contrast, the recirculation zone in outlet 2 enlarges, until its vortex core crosses and merges with the flow directing towards outlet 1 [Fig. 4(c)]. We note that the streamlines surrounding the merged vortex core are recirculating [Fig. 4(d)], which means particles can still be trapped. As the recirculation zone in outlet 2 keeps enlarging, more recirculating streamlines connect to outlet 1, which generates the particle retraction behavior [Fig. 3(g)].
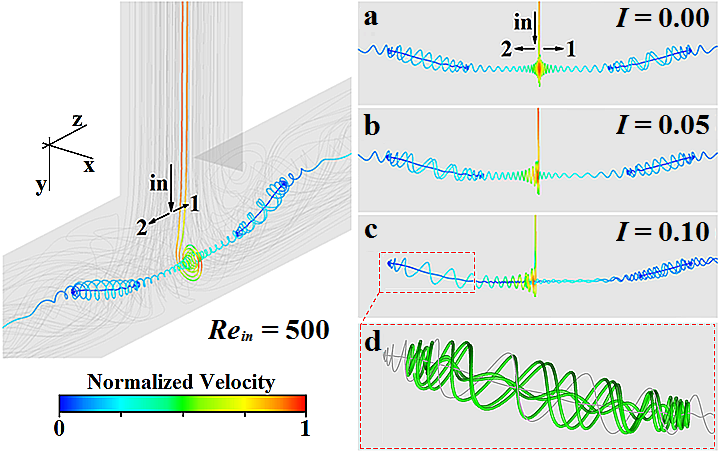
Essentially all the observations above can be explained by the change in pressure profiles in the two outlets. As the inflow impacts the channel wall, a pair of vortices is generated. Centrifugal force is induced, creating a radial pressure gradient along the vortex core. Due to viscous dissipation, the radial pressure gradient decays downstream, which in turn creates an adverse axial pressure gradient [Fig. 5(a)]. Together with the contribution from flow deceleration due to flowrate halving, this adverse pressure gradient can be strong enough to cause local flow recirculation (i.e., vortex breakdown). Here the effect of increasing is to decrease and increase the flow deceleration in outlets 1 and 2, respectively. This shifts the vorticity distribution [Fig. 5(b)] and creates a net pressure difference between the two outlets [Fig. 5(c)], the effect of which is to distort the velocity distribution along the vortex core [Fig. 5(d)]. This changes the number and positions of the internal stagnation points and thus the number and structures of the recirculation zones.
In a dividing T-junction flow, the deceleration between the inflow and outflows is constrained by the channel geometry, and the vorticity is coupled to the inflow by the Dean mechanism. Simply by varying the outflow imbalance, we decoupled all these factors to gain a fundamental understanding of the vortex breakdown. Our unique use of a 3D-printed microfluidic device to observe the flow from multiple perspectives can be applied to other fluid dynamics studies. Further, our phase diagram will guide designing devices to manipulate flow conditions using vortex breakdown. Finally, as inertial microfluidics is becoming more important in manipulating fluids in lab-on-a-chip devices Di Carlo (2009), our data shows the importance of accurate channel design and flow control to avoid failure in microfluidic experiments involving flow deceleration and vorticity decay.
References
- Teh et al. (2008) S. Y. Teh, R. Lin, L. H. Hung, and A. P. Lee, Droplet microfluidics, Lab Chip 8, 198 (2008).
- Nguyen and Wu (2004) N. T. Nguyen and Z. Wu, Micromixers–a review, J. Micromech. Microeng. 15, R1 (2004).
- Tanyeri et al. (2011) M. Tanyeri, M. Ranka, N. Sittipolkul, and C. M. Schroeder, A microfluidic-based hydrodynamic trap: design and implementation, Lab Chip 11, 1786 (2011).
- Pipe and McKinley (2009) C. J. Pipe and G. H. McKinley, Microfluidic rheometry, Mech. Res. Commun. 36, 110 (2009).
- Hsiao et al. (2017) K. W. Hsiao, C. Sasmal, J. Ravi Prakash, and C. M. Schroeder, Direct observation of DNA dynamics in semidilute solutions in extensional flow, J. Rheol. 61, 151 (2017).
- Klotz et al. (2017) A. R. Klotz, V. Narsimhan, B. W. Soh, and P. S. Doyle, Dynamics of DNA knots during chain relaxation, Macromolecules 50, 4074 (2017).
- Wheeler et al. (2003) A. R. Wheeler, W. R. Throndset, R. J. Whelan, A. M. Leach, R. N. Zare, Y. H. Liao, K. Farrell, I. D. Manger, and A. Daridon, Microfluidic device for single-cell analysis, Anal. Chem. 75, 3581 (2003).
- Cha et al. (2012) S. Cha, T. Shin, S. S. Lee, W. Shim, G. Lee, S. J. Lee, Y. Kim, and J. M. Kim, Cell stretching measurement utilizing viscoelastic particle focusing, Anal. Chem. 84, 10471 (2012).
- Bălan et al. (2012) C. M. Bălan, D. Broboană, and C. Bălan, Investigations of vortex formation in microbifurcations, Microfluid. Nanofluid. 13, 819 (2012).
- Zhang et al. (2015) C. P. Zhang, Y. F. Lian, C. H. Hsu, J. T. Teng, S. Liu, Y. J. Chang, and R. Greif, Investigations of thermal and flow behavior of bifurcations and bends in fractal-like microchannel networks: secondary flow and recirculation flow, Int. J. Heat Mass Transfer 85, 723 (2015).
- Nivedita et al. (2017) N. Nivedita, P. Ligrani, and I. Papautsky, Dean flow dynamics in low-aspect ratio spiral microchannels, Sci. Rep. 7, 44072 (2017).
- Damian et al. (2017) I. R. Damian, S. Hardt, and C. Balan, From flow focusing to vortex formation in crossing microchannels, Microfluid. Nanofluid. 21, 142 (2017).
- Haward et al. (2016) S. J. Haward, R. J. Poole, M. A. Alves, P. J. Oliveira, N. Goldenfeld, and A. Q. Shen, Tricritical spiral vortex instability in cross-slot flow, Phys. Rev. E 93, 031101 (2016).
- Vigolo et al. (2014) D. Vigolo, S. Radl, and H. A. Stone, Unexpected trapping of particles at a T junction, Proc. Natl. Acad. Sci. 111, 4770 (2014).
- Chen et al. (2015) K. K. Chen, C. W. Rowley, and H. A. Stone, Vortex dynamics in a pipe T-junction: recirculation and sensitivity, Phys. Fluids 27, 034107 (2015).
- Ault et al. (2016) J. T. Ault, A. Fani, K. K. Chen, S. Shin, F. Gallaire, and H. A. Stone, Vortex-breakdown-induced particle capture in branching junctions, Phys. Rev. Lett. 117, 084501 (2016).
- Chen et al. (2017) K. K. Chen, C. W. Rowley, and H. A. Stone, Vortex breakdown, linear global instability and sensitivity of pipe bifurcation flows, J. Fluid Mech. 815, 257 (2017).
- Lucca-Negro and O’Doherty (2001) O. Lucca-Negro and T. O’Doherty, Vortex breakdown: a review, Prog. Energy Combust. Sci. 27, 431 (2001).
- Harvey (1962) J. K. Harvey, Some observations of the vortex breakdown phenomenon, J. Fluid Mech. 14, 585 (1962).
- Cassidy and Falvey (1970) J. J. Cassidy and H. T. Falvey, Observations of unsteady flow arising after vortex breakdown, J. Fluid Mech. 41, 727 (1970).
- Sarpkaya (1971) T. Sarpkaya, On stationary and travelling vortex breakdowns, J. Fluid Mech. 45, 545 (1971).
- Faler and Leibovich (1978) J. H. Faler and S. Leibovich, An experimental map of the internal structure of a vortex breakdown, J. Fluid Mech. 86, 313 (1978).
- Escudier (1984) M. P. Escudier, Observations of the flow produced in a cylindrical container by a rotating endwall, Exp. Fluids 2, 189 (1984).
- Escudier and Keller (1985) M. P. Escudier and J. J. Keller, Recirculation in swirling flow- a manifestation of vortex breakdown, AIAA J. 23, 111 (1985).
- Chao et al. (1991) Y. C. Chao, J. H. Leu, Y. F. Hung, and C. K. Lin, Downstream boundary effects on the spectral characteristics of a swirling flowfield, Exp. Fluids 10, 341 (1991).
- Brücker and Althaus (1992) C. Brücker and W. Althaus, Study of vortex breakdown by particle tracking velocimetry (ptv), Exp. Fluids 13, 339 (1992).
- Brücker (1993) C. Brücker, Study of vortex breakdown by particle tracking velocimetry (PTV), Exp. Fluids 14, 133 (1993).
- Lowson (1964) M. V. Lowson, Some experiments with vortex breakdown, Aeronaut. J. 68, 343 (1964).
- Hummel and Srinivasan (1967) D. Hummel and P. S. Srinivasan, Vortex breakdown effects on the low-speed aerodynamic characteristics of slender delta wings in symmetrical flow, Aeronaut. J. 71, 319 (1967).
- Gad-el Hak and Blackwelder (1985) M. Gad-el Hak and R. F. Blackwelder, The discrete vortices from a delta wing, AIAA J. 23, 961 (1985).
- McKernan et al. (1988) J. F. McKernan, F. Payne, and R. C. Nelson, Vortex breakdown measurements on a 70 deg sweepback delta wing, J. Aircr. 25, 991 (1988).
- Raffel et al. (2013) M. Raffel, C. E. Willert, S. T. Wereley, and J. Kompenhans, Particle image velocimetry: a practical guide (Springer, 2013).
- Abbiss et al. (1974) J. B. Abbiss, T. W. Chubb, and E. R. Pike, Laser doppler anemometry, Opt. Laser Technol. 6, 249 (1974).
- Bottausci and Petitjeans (2002) F. Bottausci and P. Petitjeans, Visualizations of vortex filaments, Phys. Fluids 14, S13 (2002).
- Meinhart et al. (1999) C. D. Meinhart, S. T. Wereley, and J. G. Santiago, Piv measurements of a microchannel flow, Exp. Fluids 27, 414 (1999).
- Hnatovsky et al. (2006) C. Hnatovsky, R. S. Taylor, E. Simova, P. P. Rajeev, D. M. Rayner, V. R. Bhardwaj, and P. B. Corkum, Fabrication of microchannels in glass using focused femtosecond laser radiation and selective chemical etching, Appl. Phys. A 84, 47 (2006).
- Meinhart et al. (2000) C. D. Meinhart, S. T. Wereley, and M. H. B. Gray, Volume illumination for two-dimensional particle image velocimetry, Meas. Sci. Technol. 11, 809 (2000).
- Samimy and Lele (1991) M. Samimy and S. K. Lele, Motion of particles with inertia in a compressible free shear layer, Phys. Fluids A 3, 1915 (1991).
- (39) See Supplemental Material at [URL will be inserted by publisher] for additional information.
- Di Carlo (2009) D. Di Carlo, Inertial microfluidics, Lab Chip 9, 3038 (2009).