Multiband Mechanism for the Sign Reversal of Coulomb Drag Observed in Double Bilayer Graphene Heterostructures
Abstract
Coupled 2D sheets of electrons and holes are predicted to support novel quantum phases. Two experiments of Coulomb drag in electron-hole (e-h) double bilayer graphene (DBLG) have reported an unexplained and puzzling sign reversal of the drag signal. However, we show that this effect is due to the multiband character of DBLG. Our multiband Fermi liquid theory produces excellent agreement and captures the key features of the experimental drag resistance for all temperatures. This demonstrates the importance of multiband effects in DBLG: they have a strong effect not only on superfluidity, but also on the drag.
pacs:
81.05.ue , 72.80.Vp , 73.21.-bElectron-hole (e-h) double-sheet van der Waals heterostructures are attracting great interest because they are predicted to support novel quantum phases. These phases include superfluidity, coupled Wigner crystals, and charge density waves.Lozovik and Yudson (1976); Eisenstein and MacDonald (2004); Świerkowski et al. (1991); De Palo et al. (2002); Perali et al. (2013); Zarenia et al. (2017) Novel quantum phases are a major motivator for experimental studies of Coulomb drag in coupled e-h sheets in: GaAs double quantum wellsCroxall et al. (2008); Seamons et al. (2009), graphene double monolayersKim et al. (2011); Gorbachev et al. (2012), hybrid graphene-GaAs systemsGamucci et al. (2014); Simonet et al. (2017), and graphene double bilayers (DBLG)Lee et al. (2016); Li et al. (2016). In a drag measurement, the measured quantity is the transresistivity , the ratio of the generated voltage in the open-circuit drag sheet (2) to the current density in the drive sheet (1) (Fig. 1(a)). In conventional momentum drag, the dragged hole is expected to travel in the same direction as the drive electron, corresponding to a positive drag resistivity, .
Deviations of from a standard Fermi-liquid temperature dependence, are commonly accepted as evidence of correlationsŚwierkowski et al. (1995) or the existence of exotic many-body phasesVignale and MacDonald (1996); Efimkin and Galitski (2016). Two recent experimental studies of e-h drag in DBLGLee et al. (2016); Li et al. (2016) reporting large anomalous behavior in the have therefore attracted a lot of attention and discussion. Even more puzzling, Lee et al.Lee et al. (2016) reported that reverse sign as the carrier density was decreased at low . The magnitudes of the increase dramatically with decreasing , eventually becoming comparable to the sheet resistivity. Independently, Li et al.Li et al. (2016) also reported that reversed sign as a function of the density for as high as K. These are completely unexpected results, with the reversal of sign in the a major conundrum. The in double GaAs quantum wellsGramila et al. (1991); Świerkowski et al. (1995) and double graphene monolayersGorbachev et al. (2012), show no sign reversal and their drag mechanisms are substantially understood.Narozhny and Levchenko (2016); Hwang et al. (2011) However there exists no explanation for the recent DBLG results.
We show that these striking effects can be explained in detail by the multiband character of bilayer graphene (BLG) taken together with the increase in the carrier effective masses () at low densities and . Our theory of a linear screened Fermi-liquid in multiband BLG produces excellent agreement with the observed structure in the , capturing the key features of the recent experiments over the full range of and highlighting the dramatic consequences of multiband transport on the drag.
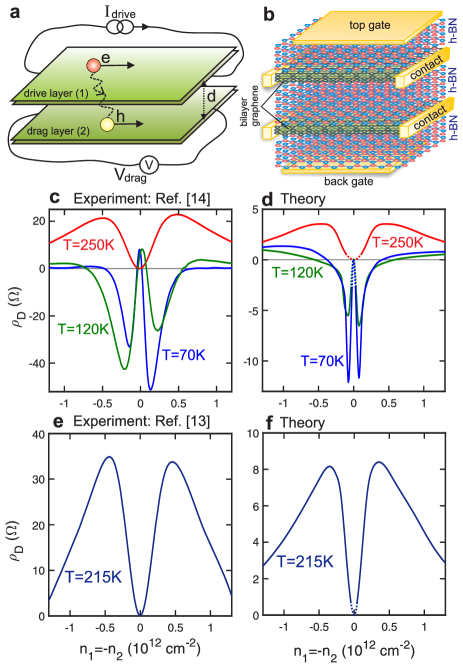
Figure 1(b) schematically depicts electron and hole BLG sheets, () and (), encapsulated in insulating hexagonal Boron Nitride (hBN) to prevent tunneling between the sheets and e-h recombination. Metal gates control the sheet densities and . Unlike monolayer graphene, BLG has single-particle energy bands with quadratic dispersion at low-energies, and its conduction band (CB) and valence band (VB) are separated by a small variable bandgap induced by the perpendicular electric fields from the gates. In contrast, monolayer graphene has linearly dispersing bands with no bandgap, while GaAs has quadratic bands with a fixed large bandgap . We find in DBLG that there is significant multiband transport in both the CB and VB of each sheet which must be included in calculations. An understanding of the nature of the multiband mechanisms lying behind these surprising experimental results paves the way for future drag experiments. Multiband effects have already been shown to be important for e-h superfluidity in coupled 2D materials.Conti et al. (2017)
Figures 1(c)-1(f) compare our at fixed as a function of matched densities with the data of Refs. 13,14. Figure 1(c) shows data from Ref. 14 of the drag. For all , the system displays conventional positive drag at high densities, but unexpected sharp negative peaks appear as the density is reduced at lower .
Figure 1(d) shows our calculated for the experimental parameters in Ref. 14: hBN barrier thickness nm; the transverse electric fields at the dual neutrality point (DNP) due to unintentional doping are not precisely specified and we take reasonable values, meV.nm-1. Our results in Fig. 1(d) capture the key structure of the unusual positive and negative peaks in the experimental at fixed , as well as the change of sign of the when is increased. The asymmetries in the negative peaks in Figs. 1(c) and 1(d) are reversed. We will see later (Fig. 3(b)) that, unlike the positions of the peaks, their asymmetries are very sensitive to and , and small changes can reverse the asymmetry. Lacking precise experimental values for and , we chose not to attempt to reproduce the asymmetries through small adjustments of and .
Consistent with experiment, we obtain positive e-h drag for K and K, but strong negative drag at small densities for K and K. A discrepancy is that our theory does not reproduce the small positive peak in observed at the DNP for K and K. This peak is known to be associated with energy drag from e-h puddle density fluctuations not considered by our theory. Our must vanish at the DNP, and very close to the DNP we extrapolate to zero (dotted lines). Our theory also reproduces the key features of drag measured in different samples in another laboratory. Figure 1(e) shows data from Sample A of Ref. 13, and Fig. 1(f) the calculated drag using the experimental parameters nm and meV.nm-1.
We use a well-established procedure for determining the drag transresistivity in e-h DBLG at fixed as a function of equal densities, . We use the Random Phase Approximation (RPA) linear-response screening theory for Fermi liquids in the clean limit. The consistent underestimate of the magnitude of in our model may be due to many-body correlations, which are expected to increase the magnitude of but not to strongly modify its overall shape.Świerkowski et al. (1995) New in our approach is the inclusion of the induced variable bandgaps between the conduction and valence bands of the bilayers, the link between the variable bandgaps and the carrier densities, and the increase in near the DNP at low .
is related to the drag conductivity by,Rojo (1999); Narozhny and Levchenko (2016)
| (1) |
is the longitudinal conductivity for sheet () with momentum independent scattering time, . Charge impurity scattering and short-range impurity scattering both lead to transport scattering times independent of momentum in BLGHwang et al. (2011). When there are transverse electric fields at the DNP from unintentional doping, is expected to be enhanced at low densitiesMcCann and Fal’ko (2006), as recently observed experimentallyLee et al. (2014, 2016).
is a convolution of the density fluctuations within the sheets represented by , the imaginary part of the nonlinear susceptibility of each sheet,
| (2) |
| (3) |
, labels the CB and VB. The form factors come from the overlap of the wave-functions in the gapped BLG.Wang and Chakraborty (2010) In band of sheet (), is the Fermi-Dirac function with chemical potential , is the -component of the velocity, and is the single-particle energy, obtained using the four-band Hamiltonian for biased BLG subbandsMcCann and Koshino (2013) with variable bandgap . For the small gaps we work with, meV, and for the low densities, cm-2, our results are not changed significantly if we use the quadratic energy dispersion obtained with the corresponding two-band Hamiltonian.
In the limit, the analytic solutions for in a clean system become numerically tedious to solve, and since for , we extrapolate it to zero in this limit. This extrapolation may not even be relevant to experiments, since it will be masked by the peak in due to disorder-induced e-h puddle density fluctuationsSong and Levitov (2012) that are absent in the clean system.
The bandgap in sheet () depends on the transverse electric fields Castro et al. (2007); Zhang et al. (2009) from the metallic gates. Thus changes slightly with the carrier density . Through the doping of each bilayer, can be described as (see supplementary information, Ref. 13),
| (4) |
According to the experimental data from Refs. 29; 24, the induced bandgap , with C.nm for weak , and and in meV and mV.nm-1. Typically in the samples in Refs. 13; 14, meV.
At low when the system is degenerate, we take a typical value for the gap at the DNP of meV to calculate the enhancement of at small densities, using the density-dependent expression for in Ref. 30. At room temperature, the number of thermally excited carriers will be large enough to suppress this enhancement. Hence we interpolate from the density-dependent values for low to the unrenormalized, constant value Zou et al. (2011) at room temperature.
The dynamically screened Coulomb interaction between sheets () and () within the RPA is , where is the bare Coulomb interaction and , with the RPA polarization function for sheet ().Wang and Chakraborty (2010) At low electric fields, meV.nm-1, the for an isolated BLG encapsulated in hBN layers increases from for few layers to for many layers.Kumar et al. (2016) For our DBLG encapsulated in hBN, we expect . Across this range of , we find the shape of the drag peaks in does not significantly vary, but their height increases with increasing (the strength of screening in depends on ). For our results we have set .
We numerically solve Eqs. (1) to (Multiband Mechanism for the Sign Reversal of Coulomb Drag Observed in Double Bilayer Graphene Heterostructures) for . We fix the chemical potential for sheet () using,
| (5) |
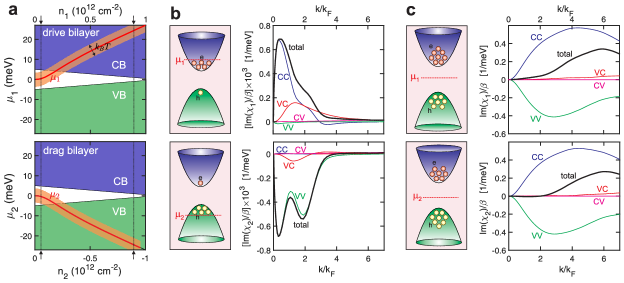
To understand the origins of the drag response structure, in Fig. 2 we examine the four terms in the summation in Eq. (Multiband Mechanism for the Sign Reversal of Coulomb Drag Observed in Double Bilayer Graphene Heterostructures) over the CB and VB, and . For Fig. 2 we set K, comparable to the bandgaps that correspond to meV.nm-1. Figure 2(a) shows schematically the evolution of the CB and VB structure with density in the e-doped drive bilayer () and h-doped drag bilayer (). Unlike conventional semiconductors, the bandgaps are small and depend on density. At higher densities, the chemical potentials (red lines) are in the CB and VB, leading to asymmetric band populations, schematically represented in the left panels of Fig. 2(b). The large contributions to the summations in Eq. (Multiband Mechanism for the Sign Reversal of Coulomb Drag Observed in Double Bilayer Graphene Heterostructures) are the intraband terms from the CB in bilayer (1), (blue curve in right panels of Fig. 2(b)), and the VB in bilayer (2), (green curve). Since and have opposite signs, the total and (black curves) also have opposite signs. The e-h drag is then everywhere positive, as in a conventional semiconductor.
Figure 2(c) is at a smaller density where the lie near the midgaps. Thermal fluctuations ensure there are significant carrier populations in the CB and VB (left panels Fig. 2(c)), which makes each term in Eq. (Multiband Mechanism for the Sign Reversal of Coulomb Drag Observed in Double Bilayer Graphene Heterostructures) similar for the two sheets, (compare the curves in right panels of Fig. 2(c)). Since and (black curves) are similar and have the same sign, is negative. This is the key mechanism behind the sign change in . A change of sign occurs with increasing density when moves from the midgap to one of the bands, and it thus represents a crossover from multiband to single-band physics.
At higher (not shown), the evolve with increasing density similarly to Fig. 2(a). However this evolution occurs much faster because of the smaller at higher . For K, the negative peaks in are confined to such an extremely narrow band of densities around the DNP that they would be practically unobservable due to disorder, and the is essentially everywhere positive. We note that the renormalization of at low is essential for the negative peaks; if is not renormalized, the negative drag in Fig. 1d for K and K would similarly be unobservable, being narrowly confined around the DNP.
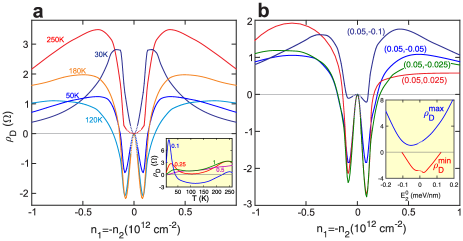
Figure 3(a) shows the evolution of for different for barrier thickness nm and V.nm-1. Note for K we predict will be everywhere positive, since thermal excitations are small. When increases, the thermal excitations make the bilayers nearly intrinsic at lower densities (see Fig. 2(c)), while at higher densities, the have moved to the CB and VB, resulting in asymmetric band populations and a positive (see Fig. 2(b)). For K, the reduction in away from the DNP drives the rapidly to the CB or VB, again resulting in asymmetric band populations and a positive . The inset shows the dependence of at fixed densities. Consistent with the experimental data in the inset of Fig. 2(c) in Ref. 14, at low densities changes sign: from positive at small to negative at intermediate , and back to positive as approaches room temperature. At higher densities, the is positive for all because the are in the CB and VB, making the interband contributions negligible.
Figure 3(b) highlights the sensitivity of the drag to the transverse electric fields . is shown at K for different combinations of . The barrier thickness nm. The maximum and minimum both increase with . When the (and hence the bandgaps) are sufficiently large, , and is positive for all densities, since thermal excitations are negligible. When the , the is asymmetric upon interchanging the e- and h-doped sheets. The inset shows the amplitudes of the positive and negative peaks for fixed as a function of . The drag maximum and minimum both increase with . At very large , the saturates. A one-band analysis is then sufficient. The drag becomes entirely positive when meV.nm-1. Thus, while the change in sign of is relatively robust, when the asymmetry of the two bandgaps becomes too pronounced, the sign change is eventually lost. By tuning the initial band gaps in the graphene bilayers with respect to the thermal excitation energy, the sign of the drag at a fixed density and can be reversed.
No sign reversal of drag has been observed for e-h graphene monolayers or GaAs double quantum wells. For graphene monolayers away from the DNP, the move rapidly to the CB and VB, and so negative drag peaks would only occur so close to the DNP that they would be undetectable. For GaAs the large bandgap of eV means always, so the remain near the CB and VB. Then the and have opposite signs, leading to positive .
The main limitation of our approach is that our calculations are made within RPA in the clean limit. Our agreement with the experimental peak structures of the indicates that the effects of disorder and correlations can have no major impact on the position of the peaks at fixed . Possible effects of superfluidityPerali et al. (2013); Zarenia et al. (2014) on the drag would occur at much lower than we consider.
This work reveals a new mechanism of drag in coupled multiband 2D sheets with small bandgaps, and our multiband theory predicts negative drag not only in DBLG but also in related systems. Our theory shows that for small bandgap systems, multiband effects have a dramatic effect on the drag even for a Fermi liquid. The reversals of sign in observed in Refs. 13; 14 as high as KLi et al. (2016) suggest that correlation effects, e-h puddles, or superfluidity are not the primary mechanisms for the observed anomalous drag. The structure in the drag from multiband effects needs to be fully mapped out. Correlations, e-h puddles, and superfluidity should be studied in the presence of multiband effects in BLG, in trilayer graphene, and in other new 2D materials with small or zero bandgaps. Our theory also predicts that hybrid systems containing one small and one large bandgap material could also exhibit changes of sign in , as recently observed in a BLG-GaAs hybrid system.Simonet et al. (2017)
Acknowledgements. We are grateful to Cory Dean, Emanuel Tutuc, and their research groups for discussing details of their experiments with us. This work was partially supported by the Flemish Science Foundation (FWO-Vl) and the Methusalem program of the Flemish government. A.R.H. acknowledges support from the ARC Centre of Excellence for Future Low Energy Electronics Technologies. D.N. acknowledges support from the University of Camerino FAR project CESEMN.
References
- Lozovik and Yudson (1976) Y. E. Lozovik and V. Yudson, Zh. Eksp. Teor. Fiz 71, 738 (1976), (Sov. Phys. JETP 44, 389-397 (1976)).
- Eisenstein and MacDonald (2004) J. P. Eisenstein and A. H. MacDonald, Nature 432, 691 (2004).
- Świerkowski et al. (1991) L. Świerkowski, D. Neilson, and J. Szymański, Phys. Rev. Lett. 67, 240 (1991).
- De Palo et al. (2002) S. De Palo, F. Rapisarda, and G. Senatore, Phys. Rev. Lett. 88, 206401 (2002).
- Perali et al. (2013) A. Perali, D. Neilson, and A. R. Hamilton, Phys. Rev. Lett. 110, 146803 (2013).
- Zarenia et al. (2017) M. Zarenia, D. Neilson, and F. M. Peeters, Scientific Reports 7, 11510 (2017).
- Croxall et al. (2008) A. Croxall, K. D. Gupta, C. Nicoll, M. Thangaraj, H. Beere, I. Farrer, D. Ritchie, and M. Pepper, Phys. Rev. Lett. 101, 246801 (2008).
- Seamons et al. (2009) J. Seamons, C. Morath, J. Reno, and M. Lilly, Phys. Rev. Lett. 102, 026804 (2009).
- Kim et al. (2011) S. Kim, I. Jo, J. Nah, Z. Yao, S. Banerjee, and E. Tutuc, Phys. Rev. B 83, 161401 (2011).
- Gorbachev et al. (2012) R. V. Gorbachev, A. K. Geim, M. I. Katsnelson, K. S. Novoselov, T. Tudorovskiy, I. V. Grigorieva, A. H. MacDonald, S. V. Morozov, K. Watanabe, T. Taniguchi, and L. A. Ponomarenko, Nat. Phys. 8, 896 (2012).
- Gamucci et al. (2014) A. Gamucci, D. Spirito, M. Carrega, B. Karmakar, A. Lombardo, M. Bruna, L. N. Pfeiffer, K. W. West, A. C. Ferrari, M. Polini, and V. Pellegrini, Nat. Comm. 5, 5824 (2014).
- Simonet et al. (2017) P. Simonet, S. Hennel, H. Overweg, R. Steinacher, M. Eich, R. Pisoni, Y. Lee, P. Mrki, T. Ihn, K. Ensslin, M. Beck, and J. Faist, New Journal of Physics 19, 103042 (2017).
- Lee et al. (2016) K. Lee, J. Xue, D. C. Dillen, K. Watanabe, T. Taniguchi, and E. Tutuc, Phys. Rev. Lett. 117, 046803 (2016).
- Li et al. (2016) J. Li, T. Taniguchi, K. Watanabe, J. Hone, A. Levchenko, and C. Dean, Phys. Rev. Lett. 117, 046802 (2016).
- Świerkowski et al. (1995) L. Świerkowski, J. Szymański, and Z. W. Gortel, Phys. Rev. Lett. 74, 3245 (1995).
- Vignale and MacDonald (1996) G. Vignale and A. H. MacDonald, Phys. Rev. Lett. 76, 2786 (1996).
- Efimkin and Galitski (2016) D. K. Efimkin and V. Galitski, Phys. Rev. Lett. 116, 046801 (2016).
- Gramila et al. (1991) T. J. Gramila, J. P. Eisenstein, A. H. MacDonald, L. N. Pfeiffer, and K. W. West, Phys. Rev. Lett. 66, 1216 (1991).
- Narozhny and Levchenko (2016) B. N. Narozhny and A. Levchenko, Rev. Mod. Phys. 88, 025003 (2016).
- Hwang et al. (2011) E. Hwang, R. Sensarma, and S. D. Sarma, Phys. Rev. B 84, 245441 (2011).
- Conti et al. (2017) S. Conti, A. Perali, F. M. Peeters, and D. Neilson, Phys. Rev. Lett. 119, 257002 (2017).
- Rojo (1999) A. G. Rojo, Journal of Physics: Condensed Matter 11, R31 (1999).
- McCann and Fal’ko (2006) E. McCann and V. I. Fal’ko, Phys. Rev. Lett. 96, 086805 (2006).
- Lee et al. (2014) K. Lee, B. Fallahazad, J. Xue, D. C. Dillen, K. Kim, T. Taniguchi, K. Watanabe, and E. Tutuc, Science 345, 58 (2014).
- Wang and Chakraborty (2010) X.-F. Wang and T. Chakraborty, Phys. Rev. B 81, 081402 (2010).
- McCann and Koshino (2013) E. McCann and M. Koshino, Reports on Progress in Physics 76, 056503 (2013).
- Song and Levitov (2012) J. C. W. Song and L. S. Levitov, Phys. Rev. Lett. 109, 236602 (2012).
- Castro et al. (2007) E. V. Castro, K. S. Novoselov, S. V. Morozov, N. M. R. Peres, J. M. B. L. dos Santos, J. Nilsson, F. Guinea, A. K. Geim, and A. H. C. Neto, Phys. Rev. Lett. 99, 216802 (2007).
- Zhang et al. (2009) Y. Zhang, T. T. Tang, C. Girit, Z. Hao, M. C. Martin, A. Zettl, M. F. Crommie, Y. R. Shen, and F. Wang, Nature (London) 459, 820 (2009).
- McCann (2006) E. McCann, Phys. Rev. B 74, 161403 (2006).
- Zou et al. (2011) K. Zou, X. Hong, and J. Zhu, Phys. Rev. B 84, 085408 (2011).
- Kumar et al. (2016) P. Kumar, Y. S. Chauhan, A. Agarwal, and S. Bhowmick, The Journal of Physical Chemistry C 120, 17620 (2016).
- Zarenia et al. (2014) M. Zarenia, A. Perali, D. Neilson, and F. Peeters, Scientific Reports 4, 7319 (2014).