Novel shape evolution in Sn isotopes from magic numbers 50 to 82
Abstract
A novel shape evolution in the Sn isotopes by the state-of-the-art application of the Monte Carlo Shell Model calculations is presented in a unified way for the 100-138Sn isotopes. A large model space consisting of eight single-particle orbits for protons and neutrons is taken with the fixed Hamiltonian and effective charges, where protons in the 1 orbital are fully activated. While the significant increase of the value, seen around 110Sn as a function of neutron number (), has remained a major puzzle over decades, it is explained as a consequence of the shape evolution driven by proton excitations from the 1 orbital. A second-order quantum phase transition is found around =66, connecting the phase of such deformed shapes to the spherical pairing phase. The shape and shell evolutions are thus described, covering topics from the Gamow-Teller decay of 100Sn to the enhanced double magicity of 132Sn.
pacs:
21.60.-n, 23.20.Lv, 27.60.+jThe shape is one of the fundamental concepts in the physics of atomic nuclei, and its variation has been studied from many angles bohr_mottelson ; ring_schuck ; casten . In such studies, Sn isotopes, where the proton number () is equal to the magic number 50, have played an anchor point, as their shapes have been considered to be basically spherical. Consequently, their structure has been often described in the (generalized) seniority scheme deshalit1963 ; talmi1971 , where the ground state is a condensate of a collective pair of two valence neutrons coupled to the angular momentum , which can be regarded as a BCS pair with the isotropic amplitudes bohr_mottelson ; allaart1988 ; ring_schuck . The 2 state is then described as a seniority-two (i.e., two-quasiparticle) state, shlomo1972 ; vangunsteren1973 ; ring_schuck , while rather constant excitation energies are observed for isotopes with even neutron number () between the magic numbers =50 and 82 nudat2 (see Fig. 1(b)). E2 transition probabilities are direct indicators of the deformation from a sphere to an ellipsoid, and are quantified through values blatt_weisskopf ; bohr_mottelson . For Sn isotopes, anomalous deviations from the spherical picture were observed for the value as a function of radford2004 ; radford2005 ; banu2005 ; cederkall2007 ; vaman2007 ; doornenbal2008 ; ekstrom2008 ; kumar2010 ; allmond2011 ; jungclaus2011 ; guastalla2013 ; bader2013 ; doornenbal2014 ; allmond2015 ; umbartzki2016 ; kumar2017 ; faestermann2013 ; pietralla2017 ; reiter2018 , but a unified theoretical description of these anomalies is missing. In this Letter, we present, for the first time, results of state-of-the-art calculations with the Monte Carlo Shell Model (MCSM) mcsm_review1 ; mcsm_ptep on Sn isotopes, performed in a large model space including single-particle orbits below and above the magic numbers 50 and 82. We demonstrate that these anomalies, a long-standing challenge to nuclear theory, are now solved, clarifying how the shape and structure evolve in those Sn isotopes.
We perform shell-model (SM) calculations (called also Configuration Interaction calculations) by taking the full Harmonic Oscillator (HO) shell consisting of the 1, 2 and 3 single-particle orbits as well as the lower part of the next HO shell, i.e., the 1, 2 and 3 orbits. The same set of the orbits are taken for protons and neutrons, keeping the isospin () conserved. The conventional SM calculation is not tractable as the maximum dimension reaches , beyond times its current limit.
The SM calculations including only valence neutrons in the =50-82 shell have been carried out banu2005 ; vaman2007 ; guastalla2013 ; back2013 ; bader2013 ; faestermann2013 ; coraggio2015 . Another example was the SNBG3 Hamiltonian snbg3 , producing a perfect agreement of the 2 levels with experiment over =52-80 (see Fig. 1(b)). However, it failed to explain observed bump of values around =52-64 (see Fig. 2(a)). Although this objective has been pursued by various theoretical approachesansari2005 ; banu2005 ; back2013 ; bader2013 ; guastalla2013 ; coraggio2015 , no clear picture has been reporteddoornenbal2014 and, for instance, an -correlation was discussed instead of the then unsuccessful shell modelvaman2007 . It is therefore required to apply the MCSM to Sn isotopes, in order to see if this serious discrepancy can be solved and how. We mention that Sn isotopes are relevant to the neutrinoless decay horoi2016 and the processing of the long-lived fission product trs435 .
The MCSM can diagonalize the Hamiltonian with many active protons and neutrons in a wide model space mcsm_review1 ; mcsm_ptep . We use a single Hamiltonian throughout this work, aiming at a unified description of the varying structure of the even- Sn isotopes including proton degrees of freedom. The SM Hamiltonian is represented in general by so-called two-body matrix elements (TBME) of the effective nucleon-nucleon interaction between two-nucleon states where the nucleons are in assigned single-particle orbits and are coupled to given and . In the present work, TBMEs are grouped and were taken from existing, well-tested sets as much as possible, with minor modifications possibly due to different inert cores. The TBMEs involving only 1 are taken from the JUN45 set jun45 . The SNBG3 set is taken for other orbitals as stated later snbg3 . Note that the JUN45 (SNBG3) set was obtained, in the corresponding model space, by modifying TBMEs calculated from microscopic interactions called G-matrix hjensen1995 based on the CD-Bonn machleidt1989 (N3LO entem2003 ) interaction, so as to better reproduce relevant experimental energies jun45 ; snbg3 . The interaction vmu is taken for the rest of TBMEs except for some cases stated below. It consists of the central part given by a Gaussian function in addition to the - and -meson exchange tensor force vmu . The parameters of this Gaussian function were fixed from monopole components of known SM interactions vmu . No adjustment is made for the interaction. The =1 TBMEs for 1, 2, 3 and 1 are taken first from the SNBG3 set, and are fine-tuned based on the so-called LC method honma02 ; brown06 , so as to reproduce observed 2 and 4 levels of 102-138Sn. As the present calculation requires huge computer resources, we calculate only 0, 2 and 4 levels for the fitting purpose. With the next generation of supercomputers, the situation can be improved. Thus, levels considered in this fit are quite limited, and the fit here means a minor improvement. Regarding the remaining =1 TBMEs, most of them are given by the interaction, for which the central part is reduced by a factor of 0.75 except for TBMEs involving the and orbits, similarly to togashi2016 . On the other hand, =0+ TBMEs are given by the simple pairing ones, being for orbitals and with appropriately fitted strengths, as the interaction may not be so suitable. All TBMEs are scaled, as usual, in proportion to (=). The single-particle energies are determined so as to be consistent with the predictions of the JUN45 and SNBG3 sets, and those outside them are estimated by a standard Woods-Saxon potential. The SM Hamiltonian is thus fixed and kept unchanged, with the results labelled ”Present”. For the purpose of comparison, we show the results labelled ”Alternative”, where the diagonal TBME of =6- 3-1 state is changed by 0.1 MeV and the interaction is used for =1 =0+ TBMEs outside the SNBG3 model.
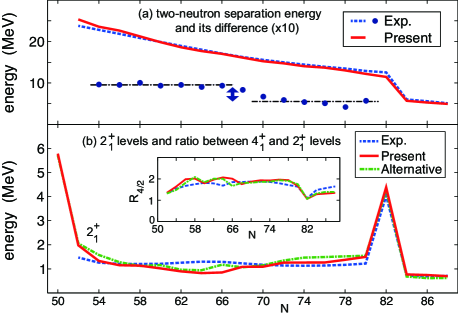
Figure 1(a) shows the two-neutron separation energies, , in comparison to experiment nudat2 . The Coulomb correction is included coulomb1 ; coulomb2 . Note that the fit to the excitation energies leaves an overall common shift for all single-particle energies open. It is fixed here to be -0.25 MeV. The agreement is quite good.
Figure 1(b) shows the 2 levels and, in the inset, the ratio of the 4 level over the 2 level energy, denoted . The results labeled “Present” show the overall trends rather well, with the 2 level and the ratio both being fairly flat and close to experiment, including certain variations near the magic numbers. These agreements suggest that the present Hamiltonian gives a reasonable description of the structure of the Sn isotopes, apart from fine details. We then look into signatures of novel characteristics of Sn isotopes, hidden in the constancy of the energy levels.
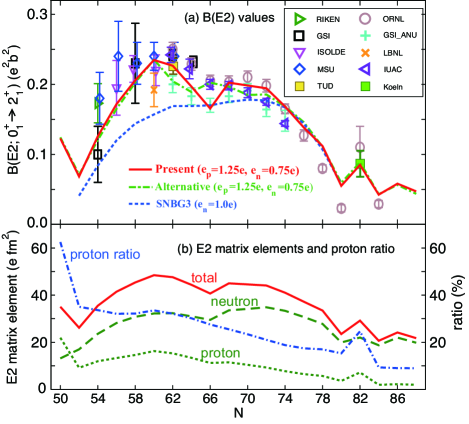
One of such signatures is the variation of E2 transition strength as changes. As mentioned earlier, Fig. 2(a) displays values, where the large bump of experimental values around =60 radford2004 ; radford2005 ; banu2005 ; cederkall2007 ; vaman2007 ; doornenbal2008 ; ekstrom2008 ; kumar2010 ; allmond2011 ; jungclaus2011 ; guastalla2013 ; bader2013 ; doornenbal2014 ; allmond2015 ; umbartzki2016 ; kumar2017 shows distinct discrepancy with theoretical calculations ansari2005 ; banu2005 ; vaman2007 ; back2013 ; bader2013 ; guastalla2013 ; coraggio2015 . This discrepancy must be resolved because is a sensitive and crucial probe of nuclear shape. The present calculation indeed reproduces the measured B(E2) trend quite well, with fixed effective charges, . Because of this salient agreement, it is of extreme interest to explore the essential underlying mechanism of the structure evolution in the Sn isotopes.
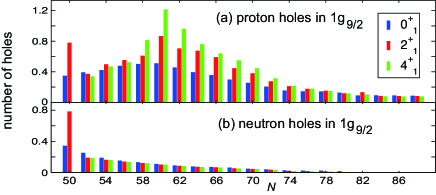
This mechanism is investigated first in terms of the occupation numbers of the 1 orbit, which is completely occupied in the models such as SNBG3. Figure 3(a,b) depict, respectively, the number of proton and neutron holes in the 1 orbit. This number is about 0.4 (0.8) for both protons and neutrons in the ground (2) state of 100Sn, yielding a larger B(E2). As shown in Fig. 3(b), this number for neutrons becomes swiftly smaller as increases, and almost vanishes for . In contrast, Fig. 3(a) shows that for protons, this number increases up to =60 for all states, and then decreases. These large numbers of proton holes suggest significant breaking of the =50 magic core and associated deformation bader2013 . Figure 2 (b) displays E2 matrix elements (including effective charges) as well as their decomposition into proton and neutron contributions. Figure 2(b) also shows the ratio of the proton contribution in the total matrix element, which exceeds 30% for =50-64, where the 1 2 excitation is most important. The strong proton excitations and the B(E2) bump are consequences of enhanced effects of the proton-neutron interaction leading to a stronger quadrupole deformation. These effects and resulting shapes vary as a function of . This proton-neutron interaction, thus crucial, is taken primarily from the interaction, which has been fixed vmu and well-tested, e.g. with Zr isotopes togashi2016 . We stress that the basic trend presented here is quite robust in this respect.
The MCSM eigenstate is given by a superposition of MCSM basis vectors. Each MCSM basis vector is a deformed Slater determinant, for which intrinsic quadrupole moments and can be calculated. Such and can be used as “partial coordinates”, and a given MCSM basis vector is placed as a circle on the Potential Energy Surface. The importance of this basis vector in the eigenstate is expressed by the area of a circle. This visualization of the shape is called the T-plot tsunoda2014 ; otsuka2016 .
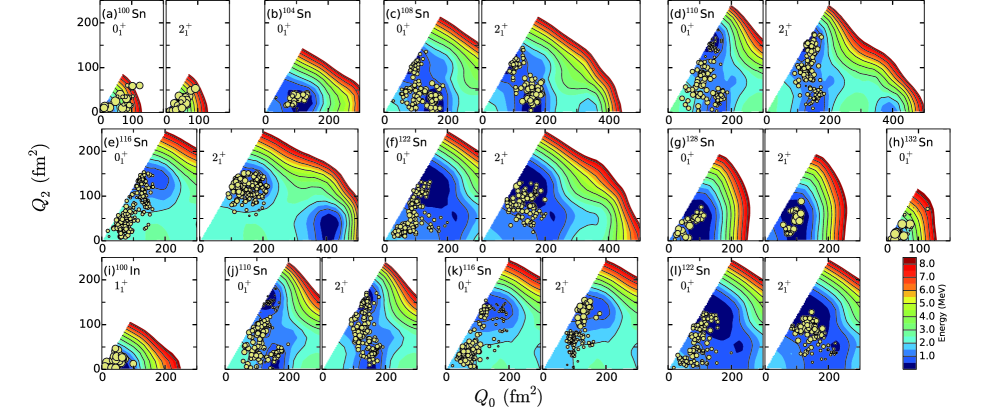
Figure 4 exhibits the T-plot for selected cases. While 100Sn shows a spherical shape (panel (a)), already in 104Sn (panel (b)) a moderate deformation emerges with no T-plot circles around the spherical limit. Such departure from the sphericity is further driven in 108Sn (panel (c)): the shape is more deformed due to more neutrons, and the tendency towards prolate shape arises. This is because neutrons occupying the 1 and 2 orbits favor the prolate deformation and likewise protons excited from the 1 orbit can cause the same, producing coherently a prolate shape. As the 1 and 2 orbits are more filled, the T-plot extends farthest in 110Sn (panel (d)) with the maximum calculated B(E2) (see Fig. 2 (a)), while the tendency is changed from the prolate to the oblate shape. Note that a recent B(E2) value on 112Sn, the next nucleus, pietralla2017 is in good agreement with the present work. For 116Sn (panel (e)), a notable displacement between the and T-plot circles appears, which will be discussed later. As shown in panel (f), the T-plot circles for the state of 122Sn are shifted from the oblate minimum to the spherical region due to the pairing correlation, whereas those for the state are around the minimum, being a quadrupole excitation from the spherical shape. In going from 122Sn to 132Sn (panels (f,g,h)), the overall spread of T-plot circles is reduced gradually, keeping relative “topological” relations unchanged to a good extent, as a new feature. The doubly magic 132Sn exhibits a concentration of T-plot circles near the spherical corner for the ground state (panel (h)). We note that the valence mirror symmetry of neutrons is broken severely; e.g. the T-plot of 104Sn (panel (b)) is more spread than that of 128Sn (panel (g)).
The quadrupole component of the proton-neutron interaction produces stronger deformation as increases up to 60. Beyond this, neutron 1 and 2 orbits are more-than-half filled, which makes the deformation saturated and then weaker. Beyond 66, the pairing correlations take over, and the spherical ground states appear. The shell evolution driven by the tensor and central forces otsuka2005 ; vmu contributes: the proton 1- 2 splitting, for instance, becomes wider, first ( up to 66) by neutrons in the 1 and 2 orbits and later by neutrons in the 1. Thus, the =50 gap increases gradually, leading to the highly stable doubly-magic 132Sn. This is not the full story, however.
Figure 2(b) depicts E2 matrix elements as functions of , with kinks at =66. These kinks imply that the dynamical mechanism may change there. Figure 1(a) shows =-, which is remarkably constant for =54-66 and for =70-80, separately. Figure 1(a) also shows their averages, including a discontinuity between them. Since corresponds to the second derivative of the ground-state energy, this discontinuity points to a second-order quantum phase transition with control parameter qpt1 ; qpt2 . While Figure 1(a) shows experimental values, a similar overall trend is obtained in the present calculation. Coming back to Fig. 2(b), the “derivative” of E2 matrix elements as a function of shows discontinuity similarly to . This is consistent with the change of the T-plot pattern. These experimental and theoretical observations imply coherently: until 66, the moderate deformation phase dominates the low-lying eigenstates, and the transition occurs such that the pairing phase takes over with the seniority-zero (pair-condensed) ground state and its excitations. We note that the present case differs from the first-order quantum phase transition in Zr isotopes, where a level crossing occurs between spherical and strongly deformed states without mixing togashi2016 . The search for other cases of the second-order quantum phase transition is of extreme interest in clarifying nuclear dynamics.
Certain properties of the critical (transition) point of the second-order phase transition are seen around =66. Figure 4(e) shows the T-plot of the state extending over a wide area though not reaching the spherical limit. This is consistent with a large quantum fluctuation typical for the critical point. The T-plot circles of the state are discretely displaced from those of the state, keeping the state in the deformed phase. The angular momentum can thus be another control parameter. This - difference causes a suppression of the B(E2) value, to be concrete, due to more neutrons in the 3 (1) orbit for the () state. Since some experiments do not show this suppression, the “Alternative” set of TBMEs was introduced mainly for obtaining a larger B(E2) value. Figure 4 (j,k,l) exhibit, respectively, T-plots for 110,116,122Sn obtained from this set. A notable difference from the “Present” set appears only for 116Sn, and the overall structure evolution remain unchanged. A consistent feature is seen in Fig. 2 (a), where the dip is shifted only to with the “Alternative” set. Thus, the features around the critical point may give certain constraints on particular TBMEs, keeping the present overall picture basically intact.
The magnetic moment of the 2 state has been measured recently allmond2015 , providing a sensible measure of configurations. The calculated g-factor of 112-124Sn is, respectively, 0.13, 0.08, 0.02, -0.01, -0.04, -0.05 and -0.07 in an agreement with these data, whereas other theoretical results are for limited nuclei or deviate more allmond2015 .
The T-plot of 100Sn (panel (a)) is similar to the one for 132Sn (panel (h)), but the circles are spread more outwards, i.e., stronger ground-state correlations, certainly because of the = nucleus. The Gamow-Teller decay of the 100Sn state to the 100In state was measured, giving the largest B(GT) value. The T-plots of these states (panels (a,i)) are similar to each other, suggesting a large B(GT). In fact, the calculated value, B(GT) =9.2 (10.3), with the usual quenching factor 0.70 (0.74), suzuki2012 (caurier2005 ), shows a good agreement with this recent experimental value 9.1 hinke2014 , implying that the amount of the holes in the 1 orbit shown in Fig. 3 is appropriate.
In summary, we present a unified description of the structure of even-A Sn isotopes for =50-88 owing to state-of-the-art Monte Carlo Shell Model calculations. The huge bump of the value around =60, a decade-long puzzle/challenge, is reproduced by activating protons in the 1 orbit. The second-order quantum phase transition is shown to occur around =66 from the moderately deformed phase to the pairing (seniority) phase, as seen in E2 matrix elements and values. The shape evolution in Sn isotopes is linked with the breaking of the =50 magic number, and this work presents a new picture involving the shell and shape evolutions and the quantum phase transition. Experimental studies on relevant physical observables, e.g., charge radius, are of urgent interest, as well as similar studies on neighboring nuclei.
I Acknowledgements
We thank Prof. A. Gade for valuable comments on the manuscript. This work was supported in part by HPCI Strategic Program (hp150224), in part by MEXT and JICFuS and a priority issue (Elucidation of the fundamental laws and evolution of the universe) to be tackled by using Post “K” Computer (hp160211, hp170230), in part by the HPCI system research project (hp170182), and by CNS-RIKEN joint project for large-scale nuclear structure calculations.
References
- (1) A. Bohr and B. R. Mottelson, Nuclear Structure, (World Scientific, Singapore, 1998).
- (2) P. Ring and R. Schuck, The Nuclear Many-Body Problem, (Springer-Verlag, Berlin, 1980).
- (3) R.F. Casten, Nuclear Structure from a Simple Perspective, (Oxford Univ. Press, Oxford, 2001).
- (4) A. de-Shalit and I. Talmi, Nuclear Shell Theory, (Academic Press, New York, 1963).
- (5) I. Talmi, Nucl. Phys. A 172, 1 (1971).
- (6) K. Allaart, E. Boeker, G. Bonsignori, M. Savoia, and Y.K. Gambhir, Phys. Rep. 169, 209 (1988).
- (7) S. Shlomo and I. Talmi, Nucl. Phys. A 198, 81 (1972).
- (8) W.F. van Gunsteren, E. Boeker and K. Allaart, Z. Phys. 267, 87 (1974).
- (9) NuDat 2.7, http://www.nndc.bnl.gov/nudat2/
- (10) J.M. Blatt and V.F. Weisskopf, Theoretical Nuclear Physics, (Wiley, New York, 1952; Springer Verlag, Berlin,1979).
- (11) D. C. Radford, C. Baktash, J. R. Beene et al., Nucl. Phys. A 746, 83c (2004).
- (12) D. C. Radford, C. Baktash, C. J. Barton et al., Nucl. Phys. A 752, 264c (2005).
- (13) A. Banu, J. Gerl, C. Fahlander et al., Phys. Rev. C 72, 061305(R) (2005).
- (14) J. Cederkäll, A. Ekström, C. Fahlander et al., Phys. Rev. Lett. 98, 172501 (2007).
- (15) C. Vaman, C. Andreoiu, D. Bazin et al., Phys. Rev. Lett. 99, 162501 (2007).
- (16) P. Doornenbal, P. Reiter, H. Grawe et al., Phys. Rev. C 78, 031303(R) (2008).
- (17) A. Ekström, J. Cederkäll, C. Fahlander et al., Phys. Rev. Lett. 101, 012502 (2008).
- (18) R. Kumar, P. Doornenbal, A. Jhingan et al., Phys. Rev. C 81, 024306 (2010).
- (19) J. M. Allmond, D. C. Radford, C. Baktash et al., Phys. Rev. C 84, 061303(R) (2011).
- (20) A. Jungclaus, J. Walker, J. Leske et al., Phys. Lett. B 695, 110 (2011).
- (21) V. M. Bader, A. Gade, D. Weisshaar et al., Phys. Rev. C 88, 051301(R) (2013).
- (22) G. Guastalla, D. D. DiJulio, M. Górska et al., Phys. Rev. Lett. 110, 172501 (2013).
- (23) P. Doornenbal, S. Takeuchi, N. Aoi et al., Phys. Rev. C 90, 061302(R) (2014).
- (24) J. M. Allmond, A. E. Stuchbery, A. Galindo-Uribarri et al., Phys. Rev. C 92, 041303(R) (2015).
- (25) G. J. Kumbartzki, N. Benczer-Koller, K.-H. Speidel et al., Phys. Rev. C 93, 044316 (2016).
- (26) R. Kumar, M. Saxena, P. Doornenbal et al., Phys. Rev. C 96, 054318 (2017).
- (27) T. Faestermann, M. Górska, and H. Grawe, Prog. Part. Nucl. Phys. 69, 85 (2013).
- (28) M. Schilling (Master Thesis, TU Darmstadt, 2016); V. Werner, N. Pietralla, priv. com.
- (29) P. Reiter, priv. com.
- (30) M. Horoi and A. Neacsu, Phys. Rev. C 93, 024308 (2016).
- (31) Implications of Partitioning and Transmutation in Radioactive Waste Managemant, Technical Reports Series No. 435, (IAEA, Vienna, 2004).
- (32) T. Otsuka, M. Honma, T. Mizusaki, N. Shimizu and Y. Utsuno, Prog. Part. Nucl. Phys., 47, 319, (2001).
- (33) N. Shimizu, T. Abe, Y. Tsunoda, Y. Utsuno, T. Yoshida, T. Mizusaki, M. Honma, and T. Otsuka, Prog. Theor. Exp. Phys. 2012, 01A205 (2012).
- (34) T. Bäck, C. Qi, B. Cederwall, R. Liotta, F. Ghazi Moradi, A. Johnson, R. Wyss, and R. Wadsworth, Phys. Rev. C 87, 031306(R) (2013).
- (35) L. Coraggio, A. Covello, A. Gargano, N. Itaco, and T.T.S. Kuo, Phys. Rev. C 91, 041301(R) (2015).
- (36) M. Honma, et al., RIKEN Accel. Prog. Rep. 45, 35 (2012).
- (37) A. Ansari, Phys. Lett. B 623, 37 (2005).
- (38) M. Hjorth-Jensen et al., Phys. Rep. 261, 125 (1995).
- (39) R. Machleidt, Adv. Nucl. Phys. 19, 189 (1989).
- (40) D. R. Entem, and R. Machleidt, Phys. Rev. C 68, 041001(R) (2003).
- (41) M. Honma, T. Otsuka, T. Mizusaki, and M. Hjorth-Jensen, Phys. Rev. C 80, 064323, (2009).
- (42) T. Otsuka, T. Suzuki, M. Honma, Y. Utsuno, N. Tsunoda, K. Tsukiyama, and M. Hjorth-Jensen, Phys. Rev. Lett. 104, 012501 (2010).
- (43) T. Togashi, Y. Tsunoda, T. Otsuka and N. Shimizu, Phys. Rev. Lett. 117, 172502 (2016).
- (44) M. Honma, B.A. Brown, T. Mizusaki, and T. Otsuka, Nucl. Phys. A 704, 134c (2002).
- (45) B.A. Brown and W.A. Richter, Phys. Rev. C 74, 034315 (2006).
- (46) W. D. Myers et al., Nucl. Phys. 81, 1 (1966).
- (47) M. S. Antony et al., Atomic Data and Nuclear Data Tables 66, 1 (1997).
- (48) Y. Tsunoda, T. Otsuka, N. Shimizu, M. Honma, and Y. Utsuno, Phys. Rev. C 89, 031301, (2014).
- (49) T. Otsuka and Y. Tsunoda, J. Phys. G: Nucl. Part. Phys. 43, 024009 (2016).
- (50) T. Otsuka, T. Suzuki, R. Fujimoto, H. Grawe and Y. Akaishi, Phys. Rev. Lett. 95, 232502 (2005).
-
(51)
Wikipedia, https://en.wikipedia.org/w/index.php?title=
Quantumphasetransition. - (52) S. Sachdev, Quantum Phase Transitions, (Cambridge Univ. Press, Cambridge, 2011).
- (53) T. Suzuki, T. Yoshida, T. Kajino and T. Otsuka, Phys. Rev. C 85, 015802, (2012).
- (54) E. Caurier, G. Martinez-Pinedo, F. Nowacki, A. Poves and A.P. Zuker, Rev. Mod. Phys. 77, 427 (2005).
- (55) C.B. Hinke, et al., Nature, 486, 341 (2012).