Confirmation of G6.31+0.54 as a part of a Galactic supernova remnant
Abstract
A combination of archival multi-frequency radio observations with narrow-band H optical imagery and new confirmatory optical spectroscopy have shown that candidate supernova remnant G6.31+0.54 can now be confirmed as part of a Galactic supernova remnant (SNR). It has non-thermal emission, an optical emission line spectrum displaying shock excitation and standard SNR line ratios, fine filamentary structures in H typical of optical remnants and closely overlapping radio and optical footprints. An X-ray ROSAT source 1RXS J175752.1-231105 was also found that matches the radio and optical emission though a definite association is not proven. Nevertheless, taken together, all these observed properties point to a clear SNR identification for this source. We provide a rough estimate for the kinematic distance to G6.31+0.54 of 4.5 kpc. The detected optical filaments are some 10 arcminutes in extent (or about 13 pc at the assumed distance). However, as only a partial arcuate structure of the SNR can be seen (and not a full shell) the full angular extent of the SNR is unclear. Hence the physical extent of the observed partial shell is also difficult to estimate. If we assume an approximately circular shell then a conservative fit to the optical arc shaped filaments gives an angular diameter of 20 arcminutes corresponding to a physical diameter of 26pc that shows this to be an evolved remnant.
keywords:
ISM:supernova remnants, ISM: individual objects: G6.31+0.54, x-rays:individual: 1RXS J175752.1-2311051 Introduction
Only Galactic supernova remnants are currently known (Green, 2014) while studies of Galactic SN explosion rates (1.9/per century, e.g. Cappellaro, Evans & Turatto (1999)) combined with pulsar birth rates (1 expected every 30 to 250 years e.g. Grimani 2004) and their average 100,000 year lifetimes, indicate there could be 1000 SNR currently present in the Galaxy (Case & Bhattacharya, 1998). Hence, a significant fraction either remains to be uncovered or our present understanding of SNR birth rates are out by a factor of 2-3. Either way the detection and confirmation on new Galactic supernova remnants is an important task.
This is the latest in series of follow-up papers (e.g. Stupar et al., 2007; Stupar, Parker & Filipović 2008; Stupar & Parker 2009; Stupar & Parker 2011 and Sabin et al., 2013) that have uncovered a significant new sample of optical detections for Galactic SNRs based on narrow-band H imagery from the SuperCOSMOS UKST/AAO H survey of the Southern Galactic plane (SHS hereafter: Parker et al., 2005; Frew et al., 2014a) or from the IPHAS H survey of the Northern plane (Drew et al.,, 2014). Optical counterparts to radio detected SNRs have had more prominence recently due to the advent of such wide-field, high sensitivity and fine resolution H surveys of the Galactic plane where they also form an SNR discovery medium in their own right (e.g. Stupar, Parker & Filipović 2008). The detection of SNRs in the optical, mostly in H is usually in the form of fine filamentary structures of different shape and size. Often they have the same overall morphological form as seen in the radio, infrared or X-ray images with overlapping complete or partial common footprints. However, it is also the case that filaments or diffuse H emission can be seen separately, without any obvious direct correlation with other wavebands (e.g. see certain objects in Stupar, Parker & Filipović 2008 or Fesen & Milisavljević 2010).
Boumis et al., (2004, 2005, 2008, 2009); Fesen & Milisavljević (2010) have also published first optical detections and subsequent spectroscopic confirmation for several additional SNRs based on CCD imagery. Multi-wavelength SNR investigations are also needed and are essential for understanding shock behaviour in the ISM, examining the correlation of shocked plasma with dust, non-thermal and thermal processes, the behaviour of radiative and non-radiative shocks, elemental abundances and heavy element ISM enrichment. The probable connection of Balmer shocks and X-ray/gamma ray emissions in the case of cosmic ray acceleration is also an important multi-frequency task.
This paper presents a new multi-wavelength investigation of SNR candidate G6.31+0.54 in a similar fashion to Stupar et al., (2007) and Stupar & Parker (2011). It was first noted a possible SNR by Brogan et al., (2006) as one of their “class III” candidates with positional coincidence with non-thermal emission but that required further deeper and more detailed follow-up for confirmation. It can also just be discerned in the 20 cm Multi-Array Galactic Plane Imaging Survey (MAGPIS) - Helfand et al., 2006 as source 6.3333+0.5500. Here we present multi-frequency radio observations from available radio surveys together with the first reported H optical detection. Integral field unit (IFU) 3-D spectroscopy at various positions across the optical filaments was undertaken and the integrated 1-D spectra are also presented. We discuss the probable association of G6.31+0.54 with a ROSAT X-ray source recognized within the region encompassed the by radio and optical data of the SNR.
2 Radio observations
2.1 First radio detection of G6.31+0.54
This possible SNR was first noted by Brogan et al., (2006) among 35 new SNRs and candidates reported using radio observations made by the VLA in the B, C and D configurations at 90 cm. This was combined with other archival data from different surveys at 20 cm (e.g from the Southern Galactic Plane Survey (SGPS), observed with the Australia Telescope Compact Array (McClure-Griffiths et al.,, 2005) and at 11 cm from the 4.3 arcminute higher resolution single-dish Bonn survey data (Reich, Reich & Fürst, 1990). See also further details in Brogan et al., (2006) where they established three main criteria for identification of an SNR at 90 cm: i) the object must be resolved, showing a whole or at least a reasonable and identifiable fraction of a typical SNR shell; ii) the radio continuum spectral index must be negative111where frequency is , radiative flux density is and the spectral index is , presenting non-thermal (synchrotron) emission and iii) the source must be distinct from mid-infrared emission at 8 m (compared with MSX 8 m sensitivity, e.g. Price et al.,, 2001).222This is due to fact that Hii regions and wind-blown bubbles are similar in morphological structure to SNRs, with flat radio spectra but surrounded with bright 8 m emission.
Brogan et al., (2006) divided the new SNR candidates into three classes (I, II or III) according to confidence they are real SNRs. G6.31+0.54 satisfied two criteria: the spectral index across three wavelengths of 11, 20 and 90 cm was indeed negative ( = –0.5 and =–0.8) and typical for SNRs. No association was found between the radio and mid infrared emission from the MSX 8 m band (for feasible optical/radio/MSX 8 m relationship see also Stupar & Parker, 2011). The third condition was not completely satisfied so G6.31+0.54 was assigned class III for sources: “coincident with non-thermal emission but very faint, very confused, or do not exhibit a typical shell-type SNR morphology”. Follow-up of this candidate was considered “essential”. Green (2014) does not include this object in his Galactic SNR catalogue.
2.2 G6.31+0.54 as seen at 6 cm (PMN) and 20 cm (NVSS and MAGPIS)
In addition to the 90, 20 and 11 cm observations noted by Brogan et al., (2006) using the NVSS data Condon et al., (1998), we made an additional search for G6.31+0.54 in other radio surveys. We found it was detected in the Parkes-MIT-NRAO (PMN - see Condon, Griffith & Wright, 1993) survey at 6 cm (4850 MHz) in the form of a partial shell (see Fig. 1) extended in the East-West direction at 115.5 arcminutes (c.f. Fig. 2 of Brogan et al., 2006). The strongest flux in the Western part was estimated to be 0.03 Jy beam-1. We could not estimate the radio flux of a partial shell at this wavelength due to the missing flux of extended objects in the PMN survey. A running median of 57 arcminutes was removed from the PMN scans - see details in Condon, Griffith & Wright (1993) and also in Stupar et al., (2005).

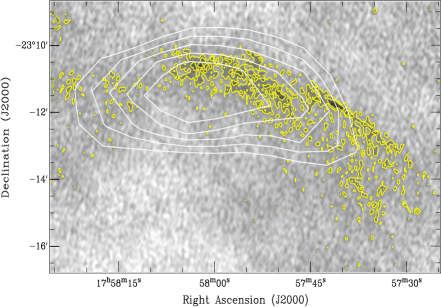
Fig. 1 shows a composite radio image of G6.31+0.54. The yellow contours are from the NVSS sky survey while white contours give the PMN data. The underlying greyscale image is the NVSS data. There is decent agreement but not a complete match between both wavelengths. This is probably because of the PMN survey’s lower resolution (5 arcminutes) compared to the NVSS of 45 arcseconds. The low NVSS surface brightness sensitivity can also influence visibility. The strongest NVSS yellow contours to the West are very close to the bright star TYC 6841-1665-1. In the NVSS radio catalogue there is a source 23 arcseconds away that agrees with star position to within the NVSS positional uncertainties (Condon et al.,, 1998). However, the radio contours indicate the source is slightly extended and so despite the close positional co-incidence and stellar brightness the radio source could be a background object, recalling that most stars are radio quiet. Most of the G6.31+0.54 radio flux at this wavelength lies to the East of this star. Brogan et al., (2006) used 20 cm data for a spectral index estimate, but from other surveys and not from the NVSS (details in Brogan et al.,, 2006), probably due to the bad quality imaging of this survey.333NVSS observations were performed with short “snapshots” giving bad quality imaging and sometimes highlighting artefacts in complex regions. At 20 cm G6.31+0.54 is also visible in the images the Multi-Array Galactic Plane Imaging Survey (MAGPIS) shown on Fig. 2 (see details in Helfand et al.,, 2006). It is clear that the definition of G6.31+0.54 in MAGPIS is much better compared to NVSS (Fig.1) due to the excellent resolution ( 5 arcsec) of the MAGPIS survey.
3 Infrared observations
An extensive search for infrared counterparts to G6.31+0.54 was made across available infrared surveys. This included all wavelength bands from the MSX mission, Price et al., (2001), the WISE survey Wright et al., (2010) and the GLIMPSE programs from the Spitzer observatory, Benjamin et al., (2003). No trace of this remnant was found in any infrared wavelength with the same or similar morphological form as seen in the radio (and optical) data. In several MIR images there does appear to be Galactic dust emission in the region but without any obvious connection to G6.31+0.54. We also noticed emission very close to the peak flux from the PMN 6 cm data that coincides with an infrared emitting star marked as IRAS 17550-2311. This is not to be confused with the peak in the NVSS data that is found in close proximity to a different, very bright star TYC6841-1665-1 that is itself unlikely to be the source of the radio emission.
However, further investigations of the Spitzer mission MPSGAL data of the region (Carey at al.,, 2009) does indicate a possible connection of 24 features with the radio emission of G6.31+0.54 at 20 cm where an infrared filament exhibits a morphological structure similar to the optical/radio structure though this filament is only 50 arseconds in length. This gives sufficient evidence to indicate that G6.31+0.5 may have infrared emission (at least at 24m).
4 Optical observations
4.1 Optical morphological structure
Recent high resolution, high sensitivity H surveys give fresh impetus to optical detection of previously known radio SNRs and have uncovered many new remnants not previously noted in the extant radio surveys (e.g. Stupar, Parker & Filipović, 2008). We present, for the first time, the optical counterpart to SNR candidate G6.31+0.53 from the SHS H survey of the Southern Galactic Plane (Parker et al.,, 2005). The survey has arcsecond resolution and the H imagery permits detection of faint, extended [N ii] H emission down to a H surface brightness erg cm-2 s-1 arcsec-2 ( Rayleighs). This makes the survey sensitive to evolved, low surface brightness nebulae (Frew et al.,, 2014a) such as evolved SNRs (e.g Stupar, Parker & Filipović 2008) and planetary nebulae (e.g. Parker et al., 2006).
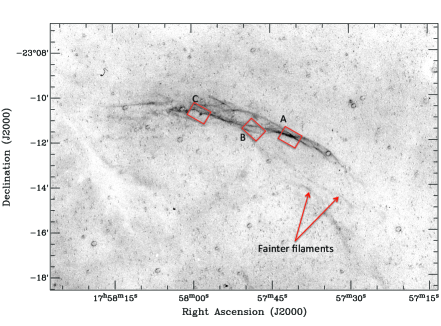
To better reveal G6.31+0.54 we present a quotient image from dividing the H data by the matching broad-band short red (SR) equivalent. G6.31+0.54 has elements of a classical SNR optical form (see Fig. 3). It is visible as a partial shell some 10 arcminutes in extension with fine filaments that usually represent the remnant’s shock front. A comparison with Fig. 1 shows an excellent match with the NVSS emission which completely follows the strongest H fine filaments, despite the low surface brightness of the NVSS survey. A decent match with the low resolution image taken from the PMN survey is also seen across the main optical features. A series of fainter optical filaments (indicated) are seen extending from the middle of the main optical arc to the South-West which could also be related (refer to later discussion).
We also searched the digital version of the earlier epoch Palomar Observatory Sky Survey photographic atlas (POSS-I) on the broad-band red exposures444See link http://stdatu.stsci.edu/cgi-bin/dss_form for any trace of the fine filaments seen in the SHS (Fig. 3) but could only find some very faint undefined 1-2 arcminute nebulosity at the Western part of the main filamentary structures. This demonstrates the power of narrow-band H imaging to reveal SNR optical counterparts (Stupar, Parker & Filipović 2008; Stupar & Parker 2011). The high sensitivity but low resolution (48 arcseconds/pixel) Southern H Sky Survey Atlas (SHASSA) of (2001) was also examined where G6.31+0.54 is seen in a form similar to the PMN radio image at this low optical resolution. Fine filamentary structures cannot be resolved but as the SHASSA survey is carefully flux calibrated a peak H emission of 730 deciRayleighs (dR) was estimated from this data.
4.2 Optical spectral observations
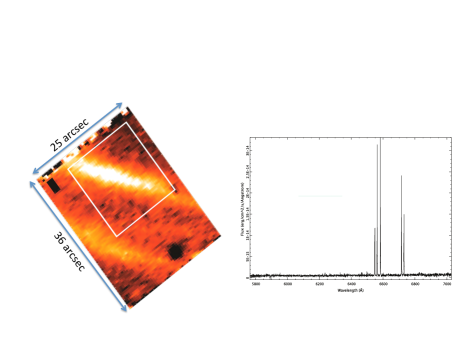
The SNR H detection indicates decent spectra would be obtained from pointings along the bright filaments seen in Fig. 3. Spectral observations were taken in June 2011 using the Wide-Field Spectrograph (WiFeS) on the 2.3m telescope of Mount Stromlo and Siding Spring Observatory (MSSSO). This was to confirm the nature of this candidate via the observed emission lines and associated diagnostic line ratios (e.g. see Figs 7 & 8 of Sabin et al., 2013). WiFeS is an image slicer and behaves as an integral field unit (IFU) providing spatial spectroscopy (see details in Dopita et al.,, 2007). WiFeS consists of arcsecond wide adjacent slits which are each 36 arcseconds in length to yield an effective arcseconds on-sky footprint. These footprints are also indicated in Fig. 3. The chosen gratings gave a combined low resolution coverage across the separate blue and red arms of the spectrograph. After standard processing with the WiFeS data reduction pipeline we chose suitable apertures from the WifeS footprint to extract summed 1-D spectra. These extracted apertures provide an integrated 1-D spectrum of all the flux within the selected region. Our choices were based both on selecting regions where the flux is strongest but also making sure to sample along the structure of the partial SNR shell.
Table 1 gives June 2011 observation log of SNR G6.31+0.54. The listed R.A. and Dec. are for the positions of the centre of each WiFeS footprint A, B and C. The blue and red arms of the spectrograph gave a combined wavelength coverage from 3200 and 7000Å using a medium resolution grating of 708 lines mm-1 for the blue arm and a higher resolution 1200 lines mm-1 gratings for the red arm for improved kinematic capability and to resolve the key [SII] doublet used to estimate electron densities.
Here we present 1-D flux calibrated red spectra extracted from selected apertures for two of the three IFU positions A and B from Table 1. For both nights we used observations of the EG274 photometric standard star to assist with determination of flux calibrated spectra.
| WiFes | Date | Exposure | Spectral | ||
|---|---|---|---|---|---|
| position | (sec) | range (Å) | RA | Dec. | |
| blue + red | |||||
| m | ∘ ’ ” | ||||
| A | 02/06/2011 | 1500 | 3200–7000 | 17 57 41 | –23 11 45 |
| B | 02/06/2011 | 1500 | 3200–7000 | 17 57 49 | –23 11 20 |
| C | 03/06/2011 | 1200 | 3200–7000 | 17 57 57 | –23 10 50 |
aThe rms dispersion error (in Å) was 0.08 and the relative percentage error in the flux estimate was
12%.
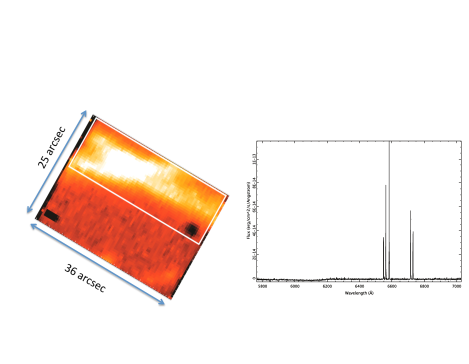
For position “A” from Table.1 we present red spectra in Fig. 5 where the left side shows a full slice from the WiFeS datacube centered on the strongest line in the optical spectrum of [N ii] at 6583Å. The selected aperture from footprint “A” was large, 2230 arcseconds which represents 73% of the entire WiFeS footprint at this position. This aperture was summed through all the cube to give the 1-D spectrum shown on the right side of Fig. 5.
The usual H, [N ii] 6548, 6583 and [S ii] 6716, 6731Å emission lines are widely used to identify the nature of the observed nebulae based on criteria established by Fesen et al., (1985) and refined by Frew & Parker (2010). All these major, red emission lines, typical for older supernova remnants, are present, i.e. [N ii] at 6548 and 6583Å, H and [S ii] at 6717 and 6731Å. The [N ii] lines are stronger than H which immediately rules out possible confusion with a Hii region (e.g. Frew & Parker 2010). While strong [N ii] emission is also seen in both planetary nebulae and massive star ejecta (Frew et al.,, 2014b), the resolved [S ii] lines in summation are stronger than H showing we are well in to the shock regime typically seen in SNR optical spectra. A [S ii] 6716 + [S ii] 6731/H ratio of 0.40.5 (see Fesen et al., 1985) is a main discriminator for the presence of shocked conditions of the energetic and turbulent regions of SNRs. Such values are very rarely found in Hii regions or planetary nebulae. The value found here is 1.2 and is obtained from using the integrated fluxes obtained from Gaussian fits to the line profiles. Furthermore, the observed [S ii] 6717/6731Å ratio is used to determine electron densities. For most SNRs this is likely to be in the low-density limit of 1.4 and indeed the measured value from position A is (see Table 2).
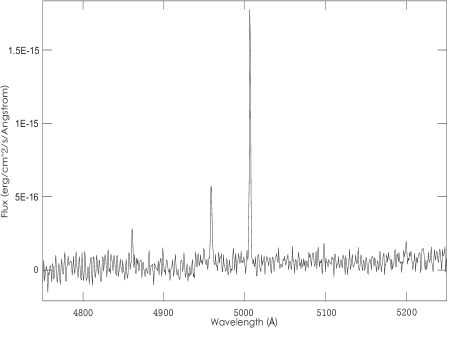
Due to extinction all blue footprints had low S/N but a reasonable blue spectrum was possible from the brightest “A” filament (see Fig 4) that shows classical lines of H and. [O iii] at 4959 and 5007Å.
Similarly, the integrated 1-D red spectrum at position B is presented in Fig. 6 where again the WiFeS 2-D cube slice seen at [N ii] 6583Å is shown. The selected aperture was 1620 arcseconds in size chosen to sample the most intense section of the filament. The 1-D spectrum on the right of the figure shows the same lines as seen extracted from position A but with slightly different observed ratios. The equivalent blue data gave weak detections of H and [O iii] at 5007Å due to extinction which is why only the ratio of [O iii] against H is given in Table 2.
Output from WiFeS position C shows the same lines seen in 1-D spectral extractions from WiFeS footprints A and B with similar line ratios though the spectrum extraction aperture was only a 3 arcsecond region from the brightest emission seen in the WiFeS cube and located some 11 arcseconds North from the R.A. and Dec. position given in the Table 1 was used. An exposure time of 1200 sec was used for position C and 1500 sec for positions A and B (refer Table 1). The blue spectrum is of too low S/N from this modest aperture and did not show any clearly detected spectral lines though the observing log shows clear nights and good seeing. Despite observations of spectrophotometric standard stars a reliable flux calibration for the combined blue and red spectra was not achieved due to the different blue and red gratings and different CCDs used for the independent blue and red spectrographs arms. Consequently it was not possible to estimate a reliable Balmer decrement and hence extinction in the direction of G6.31+0.54.
Values for selected line ratios obtained from positions A, B and C can be plotted on the so-called “SMB” H/[N ii] versus H/[S ii] diagnostic diagram of Sabbadin, Minello & Bianchini (1977) or the Baldwin, Phillips & Terlevich (1981) BPT [O iii] 5007/H versus [S ii]/H equivalent. Both can be used to help discriminate between various classes of emission nebulae including SNRs, Hii regions and PNe. These useful diagrams have been updated by our group (e.g. see Frew & Parker 2010 and Sabin et al., 2013) to include vetted spectroscopic data from the literature, supplemented with our own flux-calibrated spectroscopy for a large sample of objects of various kinds as reported in the HASH research platform (e.g Parker et al., 2016). These new data-points and their integrity have provided a better definition of the overall loci for the different object types with specific zones indicated. These SMB and BPT diagrams are presented in Fig. 7 with the larger black squares gives the data obtained from G6.31+0.54 positions A, B and C respectively. They all fall well within the SNR defined loci in this plot showing their highly likely SNR nature. A few PNe do seem to fall in the SNR delineated region of the SMB diagram but they are a small minority. Any even conservative physical extent of this nebulae is bigger than for even the largest PNe ever observed so there is no confusion.
| Date | Wifes | H | [O iii] | [O iii] | [N ii] | H | [N ii] | [S ii] | [S ii] | [N ii]/H | [S ii]/H | [S ii] | radial velocity | electron density |
|---|---|---|---|---|---|---|---|---|---|---|---|---|---|---|
| position | 4959Å | 5007Å | 6548Å | 6583Å | 6717Å | 6731Å | 6717/6731Å | (km s-1) | (cm3) | |||||
| 02/06/2011 | A | 100a | 267 | 690 | 42 | 100a | 140 | 70 | 52 | 1.8 | 1.2 | 1.3 | -12.21.4 | 102 |
| 02/06/2011 | B | 100b | – | 125 | 35 | 100b | 113 | 70 | 48 | 1.4 | 1.2 | 1.5 | -3.62.8 | LDL |
| 03/06/2011 | C | – | – | – | 66 | 100c | 196 | 112 | 85 | 2.6 | 2.0 | 1.3 | -22.23.3 | 102 |
aH flux = 1.1610-13 & H flux = 5.1610-16; bH flux = 4.4310-14 & H flux = 1.9110-16; cH flux = 2.0310-15 in units of erg cm2 s-1 Å -1
†Note the rms wavelength dispersion error from the arc calibrations was 0.08Åwhile the relative
percentage error in the flux determination from
the calibration using the brightest lines was estimated as 12%.
5 X-ray Observations
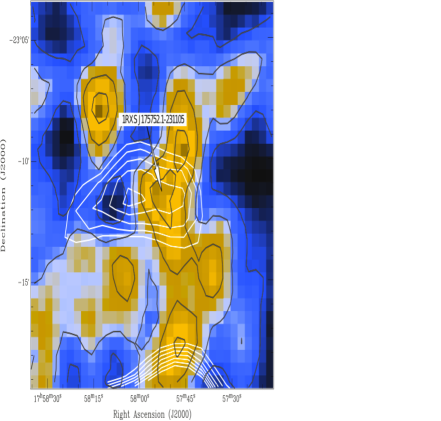
A search for X-ray sources around G6.31+0.54 revealed ROSAT object 1RXS J175752.1-231105 in the All-Sky Faint Source Catalogue (RASS-FSC) (Voges et al.,, 2000) 555see also link http://www.xray.mpe.mpg.de/rosat/survey/rass-fsc/ that has a match with the regions optical and radio emission in Fig. 8. This figure, with the ROSAT source 1RXS J175752.1-231105 indicated, is for the range 0.1 to 2.4 keV extracted and smoothed with a of 2-bins on the basis of the region’s ROSAT All Sky Survey image (using bas.fits file). This “basic” ROSAT file contains all essential calibrated science data such as photon event list with time of arrival, length of observations, sky and detector positions, corrected amplitude for each photon etc. The RASS-FSC does not give the diameter of this source but we estimate it is around 2 arcminutes. The source is in the group of faint objects with a likelihood detection of 12 where a likelihood scale of at least 7 indicates detection of at least 6 source photons. The ROSAT catalogue entry for this source gives only a coarse description of the spectrum for this object, or hardness ratio (HR1), defined as the ratio of lower energy end of the spectrum (soft end e.g. 0.1 to 0.4 keV) and the high-energy spectrum (hard end e.g. 0.5 to 2.0 keV). The listed hardness value, actually a ratio of counts of two different energy bands, is 1.0 for 1RXS J175752.1-231105 telling us we have very hard emission of hot X-ray gas in this region which is common to young SNRs and in cases where the ISM is heated by a strong shock. Although the observed hardness ratio is a rough estimate, it gives basic spectral properties of the object. Despite good positional agreement no firm association of the X-ray source with the SNR can be made at this time.
6 Discussion and Conclusions
If we compare the optical image of G6.31+0.54 (Fig. 3) with the NVSS 20 cm radio image (yellow contours in Fig. 1) we see an excellent positional match. The radio contours at 6 cm from the PMN survey are shifted a little towards the East compared with the NVSS and the optical, but this is likely due to the low angular resolution of the PMN survey (5 arcminutes). The peak emission at 6 cm is clearly defined while in the NVSS the peak emission is close to the position of the bright star TYC 6841-1665-1 but the slightly extended nature of the radio emission here indicates a likely background source rather than any direct association with the star itself.
The full extent of the multi-wavelength emission distribution of G6.31+0.54 is unclear but what is seen in all radio and optical images is a partial shell 10 arcminutes in extent that morphologically represents the shock front of an evolved Galactic SNR. If we assume the observed feature is part of an arc of a circular shell then the conservative approximate diameter would be about 20 arcminutes obtained by subjective fitting of a circle to the observed arc structure. The clear detection of radio emission at several frequencies and the resultant observed negative radio spectral index shows that it is still a radio active object and likely from an SNR but definitely not in the group of radio quiet remnants (see Stupar et al.,, 2007). That it is an older evolved remnant is corroborated by our optical spectra (see Fig. 5,6) where the observed ratios of the forbidden lines of [N ii], H and [S ii] do not vary too much across the visible remnant (see also Table 2). This is not the case with young remnants. Also, the ratio of [S ii]/H 0.4 (in our case it is 1.2, 1.2 and 2.0 for the three sampled positions) is an established metric for objects with shocks, e.g. SNRs or, in some cases Wolf-Rayet star nebula (see Stupar & Parker, 2011). Together, all these data tell us that G6.31+0.54 can be classified as a coming from a newly confirmed Galactic SNR whose full extent is unclear.
Very faint filamentary emission features appear to start in the middle of the main emission arc of G6.31+0.54 and extend South-West for several arcminutes (see Fig. 3). The nature of these faint filaments (arrowed in the figure) and their possible association with this SNR is not certain but could indicate continuation of the optical shell. Connection with the known Galactic SNR G6.4-0.1 (or W28) 10 arcminutes South-East from G6.31+0.54 (see middle image of top panel in Fig. 2 in Brogan et al., 2006) is possible but seems unlikely given the clear separation. Only future detailed study can offer a firm answer. G6.31+0.54 is also quite close to another SNR G6.10+0.53 but given the 13 arcminute separation in declination they appear unrelated (see see Fig. 3 in Stupar & Parker (2011)).
From the optical images presented in this work it is apparent that the filaments of G6.31+0.54 are on the rim (e.g. part of the rim) of the partial SNR shell and seen edge-on (tangentially). In this case (see also Boumis et al.,, 2004) we assume that radial velocities characterise the majority motion of the expanding system. Hence, from the estimated radial velocities we can calculate a crude kinematic distance to G6.31+0.54. For radial velocities for all three slit positions from Table 2 we measured shifts of the brightest well resolved lines of [N ii], H and [S ii] and estimated an average radial velocity of -12.7 km s-1. Taking the Sun’s radial distance from the Galactic center of 8.5 kpc gives an estimated distance of 4.5 kpc and therefore a tentative diameter of 26pc. Further spectra across the remnant would provide more accurate averaged velocities. We have estimated radial velocities from -3.6km s-12.8km s-1 for position B, to -22.2km s-13.3km s-1 for position C with position A giving an intermediate value of -12.2km s-13.1km s-1. Due to these observed variations in radial velocities the distance of 4.5 kpc could have an error of up to 50%.
In looking for evidence for SNR evolution over time and as a possible independent test our distance estimate we compared available optical images (in red light) from the early epoch Palomar Observatory Sky Survey (POSS I) and the much later SHS data to see if there was any discernible shift (expansion) in filament positions. Despite the 52 year time difference we do not see any evidence for change, perhaps not surprising given the small shifts of 0.2-0.3 arsceconds that might be expected with the supposed distance of this remnant and the coarser, earlier emulsions.
The spectra in Fig. 6 shows [N ii] 6583Å stronger than H but in Figs. 6 and for the spectrum of pointing C this line is much stronger. This is not common for evolved SNRs that have chemical compositions dominated by swept-up ISM and show an abundance gradient across the Galaxy (e.g. Binette et al., 1982; Fesen et al., 1985). Such enrichment can arise due to localised nitrogen variability and interaction with the ISM (see Stupar & Parker 2009 or Stupar et al., 2007). This variation in nitrogen abundance is more often seen in younger remnants. One more possibility is that strong [N ii] emission is due to a somewhat supersolar metallicity of the ISM closer to Galactic centre.
In the blue spectra, none shows [O ii] at 3727Å (common in evolved SNRs) which, according to Raymond (1979) represents slower moving shocks. Lack of detection is more likely due to high extinction affecting the data in the far blue. From the blue spectra at positions A and B (see Table 2) the [O iii] lines at 5007 and 4956Å are clearly seen telling us that the shock velocity of G6.31+0.54 is likely to be over 80 km s-1 (Raymond, 1979). We used Allen et al., (2008) to calculate the shock speed for the A and B IFU positions from Table 2. Strong lines of [S ii] at 6717 and 6731Å relative to H were used and very close values for both lines estimated, giving averaged shock velocity estimates of 240 km s-1 for these two positions under the model of solar abundance cm-3 and pre-shock magnetic field (see details in Allen et al.,, 2008). If the observed filament is off the perpendicular to the line of sight by an angle , then the observed radial velocity will be dominated by the filament peculiar velocity (240 km s-1 Sin() is much greater than the systemic velocity of the remnant). In this case the kinematic distance estimate would be unreliable. For the same calculations we also tried to use the [N ii] line at 6583Å relative to H but the subsequent estimated velocity was lower by some 50 km s-1, most probably due to the enhanced [N ii] line in which case it is not a real physical characteristic of the source.
We have presented the first optical detection of SNR G6.31+0.54 in H which exhibits typical filamentary emission structures common to SNRs and that overlaps substantially with the previous radio data. We also presented the first optical spectra from several locations across the optical partial shell that confirm shock excitation typical of evolved SNRs. Diagnostic emission line diagrams such as the SMB H/[N ii] versus H/[S ii] plot (e.g. Frew & Parker 2010, Sabin et al., 2013) places these spectra squarely in the locii of SNRs. We also identified this object in other radio surveys at different frequencies such as the PMN survey at 6 cm and NVSS at 20 cm. Finally, there is a ROSAT X-ray source 1RXS J175752.1-231105 that may be connected with G6.31+0.54 given the strong positional co-incidence. Taking the overall body of current observational evidence we have compiled with the earlier determination of a negative radio spectral index representative of shell SNRs, G6.31+0.54 should be classified as coming from a bona-fide Galactic SNR. Further, deeper observations with different radio frequencies to better define the radio spectral index and form would be useful together with more high dispersion optical spectroscopy and better X-ray data to confirm the possible association of 1RXS J175752.1-231105 with this SNR.
7 Acknowledgements
We gratefully thank an anonymous referee for diligent and careful work that has considerably improved the paper. We thank the Mount Stromlo and Siding Spring Observatory Time Allocation Committee for time for the spectroscopic follow-up. MS is thankful to the Physics Department and Laboratory for Space Research of The University of Hong Kong, for a senior research assistantship to work on this project. We thank Prof. Miroslav Filipović for helpful comments during work on this paper.
References
- Allen et al., (2008) Allen M.G., Groves B. A., Dopita M. A., Sutherland R. S., Kewley L. J., 2008, ApJS, 178, 20
- Baldwin, Phillips & Terlevich (1981) Baldwin J. A., Phillips M. M., Terlevich R., 1981, PASP, 93, 5
- Benjamin et al., (2003) Benjamin R. A. et al., 2003, PASP, 115, 953
- Binette et al., (1982) Binette L., Dopita M. A., Dodorico S., Benvenuti P., 1982, A&A, 115, 315
- Boumis et al., (2004) Boumis P., Meaburn J., López J.A., Mavromatakis F., Redman P.M., Harman D.J., Goudis C.D., 2004, A&A , 424, 583
- Boumis et al., (2005) Boumis P., Mavromatakis F., Xilouris E. M., Alikakos J., Redman M. P., Goudis C. D., 2005, A&A, 443, 175
- Boumis et al., (2008) Boumis P., Alikakos J., Christopoulou P. E., Mavromatakis F., Xilouris E. M., Goudis C. D., 2008, A&A, 481, 705
- Boumis et al., (2009) Boumis P., Xilouris E. M., Alikakos J., Christopoulou P. E., Mavromatakis F., Katsiyannis A. C., Goudis C. D., 2009, A&A, 499, 789
- Brogan et al., (2006) Brogan C.L., Gelfand J.D., Gaensler B.M., Kassim N.E., Lazio T.J.W., 2006, ApJ, 639, L25
- Cappellaro, Evans & Turatto (1999) Cappellaro E., Evans R., Turatto, M. 1999, A&A, 351, 459
- Carey at al., (2009) Carey S. J. et al., 2009, PASP, 121, 76
- Case & Bhattacharya (1998) Case G.L., Bhattacharya D., 1998, ApJ, 504, 761
- Condon, Griffith & Wright (1993) Condon J.J., Griffith M.R., Wright A.L., 1993, AJ, 106, 1095
- Condon et al., (1998) Condon J.J., Cotton W.D., Greisen E.W., Yin Q.F., Perley R.A., Taylor G.B., Broderick J.J., 1998, AJ, 115, 1693.
- Dopita et al., (2007) Dopita M., Hart J., McGregor P., Oates P., Bloxham G., Jones D., 2007, ApSS, 310, 255
- Drew et al., (2014) Drew, J. E. et al., 2014, MNRAS, 440, 2036
- Fesen et al., (1985) Fesen R.A., Blair W.P., Kirshner R.P., 1985, ApJ, 292, 29
- Fesen & Milisavljević (2010) Fesen R.A., Milisavljević D., 2010, AJ, 140, 1163
- Frew & Parker (2010) Frew D.J., Parker Q. A., 2010, Publ.Astron.Soc.Aus, 27, 129
- Frew et al., (2014a) Frew D.J., Bojičić, I.S., Parker Q. A., Pierce M.J., Gunawardhana M.L.P., Reid W.A., 2014a, MNRAS, 440, 1080
- Frew et al., (2014b) Frew D.J., Bojičić, I.S., Parker Q. A., Stupar, M., Wachter S., DePew K., Danehkar A., Fitzgerald M. T., Douchin, D., 2014b, MNRAS, 440, 1345
- (22) Gaustad J.E., McCullough P.R., Rosing W., Van Buren D., 2001, PASP, 113, 1326
- Green (2014) Green D.A., 2014, BASI, 42, 47 (also available online at http://www.mrao.cam.ac.uk/surveys/snrs/)
- Grimani (2004) Grimani C., 2004, A&A 418, 649
- Helfand et al., (2006) Helfand D.J., Becker R.H., White R.L., Fallon A., Tuttle S., 2006, AJ, 131, 2525
- McClure-Griffiths et al., (2005) McClure-Griffiths N. M., Dickey J. M., Gaensler B. M., Green A. J., Haverkorn M., Strasser S. 2005, ApJS, 158, 178
- Parker et al., (2005) Parker Q.A., Phillipps S., Pierce M.J., Hartley M., Hambly N.C., Read M.A. et al., 2005, MNRAS, 362, 689
- Parker et al., (2006) Parker, Q. A., Acker, A., Frew, D.J., Hartley, M., Peyaud, A.E.J., Ochsenbein, F. et al., 2006, MNRAS, 373, 79
- Parker et al., (2016) Parker, Q. A., Bojičić, I.S., Frew, D.J., 2016, Journal of Physics Conf.Ser., 728, 2008
- Price et al., (2001) Price S.D., Egan M.P., Carey S.J., Mizuno D.R., Kuchar T.A., 2001, AJ, 121, 2819
- Raymond (1979) Raymond J.C., 1979, ApJS, 39, 1
- Reich, Reich & Fürst, (1990) Reich W., Reich P., Fürst, E. 1990, A&AS, 83, 539
- Sabbadin, Minello & Bianchini (1977) Sabbadin F., Minello S. Bianchini A., 1977, A&A, 60, 147
- Sabin et al., (2013) Sabin L. et. al., 2013, MNRAS, 431, 279
- Stupar & Parker (2009) Stupar M., Parker Q.A., 2009, MNRAS, 394, 1791
- Stupar & Parker (2011) Stupar M., Parker Q.A., 2011, MNRAS, 414, 2282
- Stupar et al., (2005) Stupar M., Filipović M. D., Jones P. A., Parker Q. A., 2005, AdSpR, 35, 1047
- Stupar et al., (2007) Stupar M., Parker Q.A., Filipović M.D., Frew D.J., Bojičić I., Aschenbach B., 2007, MNRAS, 381, 377
- Stupar, Parker & Filipović (2008) Stupar M., Parker Q.A., Filipović M.D., 2008, MNRAS, 390, 1037
- Stupar, Parker & Filipović (201) Stupar M., Parker Q.A., Filipović M.D., 2011, ApSS, 332, 241
- Voges et al., (2000) Voges W. et al., 2000, IAU Circular 7432
- Wright et al., (2010) Wright E.L. et al., 2010, AJ, 140, 1868