On the detection of CO and mass loss of Bulge OH/IR stars
Abstract
We report on the succesful search for CO (2-1) and (3-2) emission associated with OH/IR stars in the Galactic Bulge. We observed a sample of eight extremely red AGB stars with the APEX telescope and detected seven. The sources were selected at sufficient high galactic latitude to avoid interference by interstellar CO, which hampered previous studies of inner galaxy stars. To study the nature of our sample and the mass loss we constructed the SEDs from photometric data and Spitzer IRS spectroscopy. In a first step we apply radiative transfer modelling to fit the SEDs and obtain luminosities and dust mass loss rates (MLR). Through dynamical modelling we then retrieve the total MLR and the gas-to-dust ratios. We derived variability periods of our stars. The luminosities range between approximately 4000 and 5500 L⊙ and periods are below 700 days. The total MLR ranges between and M⊙ yr-1. Comparison with evolutionary models shows that the progenitor mass M⊙, similar to the Bulge Miras and are of intermediate age (3 Gyr). The gas-to-dust ratios are between 100 and 400 and are similar to what is found for OH/IR stars in the galactic Disk. One star, IRAS 17347–2319, has a very short period of approximately 300 days which may be decreasing further. It may belong to a class of Mira variables with a sudden change in period as observed in some Galactic objects. It would be the first example of an OH/IR star in this class and deserves further follow-up observations.
keywords:
Stars: AGB and post-AGB – Stars: mass-loss – circumstellar matter – dust – Galaxy: bulge – radio lines: stars1 Introduction
Low to intermediate mass stars (0.8 M⊙) will ultimately end their lifes on the Asymptotic Giant Branch (AGB) (Vassiliadis & Wood, 1993; Habing, 1996). Two striking characteristics of the AGB are the variability of the stars and the mass loss. Different types of large amplitude variables are classified on the basis of the amplitude: Semi-Regular Variables, Miras and OH/IR stars, where the latter have the largest amplitudes (1 magnitude bolometric) and periods of several hundred days. In the final phases on the AGB, the mass loss is the dominant process which will determine the AGB lifetime and its ultimate luminosity. The mass-loss rates (MLRs) range approximately from up to M⊙/yr. Although the mass loss for these stars is already well known for many years there is still no firm understanding of what triggers the mass loss. It is believed that, through large amplitude variability, the outer parts of the atmosphere are cool and the density is high enough to start dust formation. Radiation pressure on the grains drives these outwards, dragging with them the gas creating a slow ( km s-1) but strong stellar wind (Goldreich & Scoville, 1976). Through their mass loss, these stars provide a significant contribution to the gas and dust mass returned to the interstellar medium.
When nearing the tip of the AGB, stars will start experiencing thermal pulses (a.k.a. helium shell flashes). The thermal pulses can lead to the change of chemical type from the originally oxygen-rich star to either a S-type (C/O ) or carbon star (C/O ) through dredge-up of nuclear processed material to the surface (Iben, 1975). The change of chemical type is metallicity and stellar mass dependent. Stars with approximately solar metallicity and below two or above four M⊙ are expected to remain oxygen-rich (Marigo et al., 2013).
The OH/IR stars are the subset of AGB stars with the highest MLRs M⊙/yr observed (Baud & Habing, 1983). Such high MLR are significantly higher than the stellar mass loss description by Reimers (1975) and are often called a superwind, a term introduced by Renzini (1981) to describe the MLR needed to explain the characteristics of Planetary Nebulae.
The dust formed in the circumstellar shell completely obscures the photospheric radiation and re-radiates it at infrared wavelengths (Bedijn, 1987). The OH part of the name comes from the fact that in most cases of these infrared stars OH maser emisson, originating in a circumstellar thin shell, is detected. OH/IR stars are mostly found through either “blind” OH surveys that searched the galactic plane at the 18 cm radio line (e.g., Baud et al., 1981; Sevenster et al., 1997) or through a dedicated search on cool infrared sources with colours typical for a few 100 K temperature dust shell (te Lintel Hekkert et al., 1991). A recent database of circumstellar OH masers can be found in Engels & Bunzel (2015).
In the literature, OH/IR stars are often associated with more massive AGB stars. Well known studied examples of these are the OH maser sources near the galactic plane, like OH 26.5 (e.g. van Langevelde et al. (1990)). These stars have high luminosities well above 10,000 L⊙ and periods larger than a 1,000 days. Studies of OH/IR stars in the Bulge (van der Veen & Habing, 1990; Jiménez-Esteban & Engels, 2015) and the IRAS based study by Habing (1988) of galactic disk OH/IR stars, find however luminosity distributions peaking at approximately 5,000 L⊙, expected to have relatively low mass progenitors below 2 M⊙.
Selecting Bulge stars provides the advantage of a relatively well known distance within our Galaxy. Generally the Bulge stellar population is considered to be old (Renzini, 1994; Zoccali et al., 2003; Vanhollebeke et al., 2009), however several studies also indicate the presence of intermediate age stars (van Loon et al., 2003; Groenewegen & Blommaert, 2005). The question on the nature of the Bulge OH/IR stars is part of our analysis and will be discussed in Section 7.
The mass loss in AGB stars is studied by several means (van der Veen & Olofsson, 1990; Olofsson, 2003) of which infrared studies of the circumstellar dust and the (sub-) millimetre detection of CO transitions are the most frequently used. In this study we combine the two techniques allowing to compare two independent techniques and to study the gas-to-dust ratio, which is expected to be metallicity dependent. Earlier efforts to observe CO emission from AGB stars in the inner Galaxy had only limited success because of the interference of interstellar CO emission along the galactic plane (Winnberg et al., 2009; Sargent et al., 2013), even though they used interferometric techniques. They selected OH/IR stars close to the galactic centre and plane respectively, which have different star formation histories than the Bulge (Launhardt et al., 2002; Genzel et al., 2010). To avoid the galactic plane ISM interference we selected a population of OH/IR stars from the Bulge at higher latitudes. The sample selection of our paper is described in the following Section. We then continue with a description of the CO observations and data in Section 3. The results from the modelling of the IR and CO data are given in the “Analysis” Section 4 & 5. The resulting characteristics are described in the Section 6, followed by discussions on the Bulge population of OH/IR stars and the superwind MLR in Section 7.
2 Sample selection and description
The eight sources in this study are taken from a larger sample of fifty-three Galactic Bulge AGB stars which were selected to study the dust formation in the circumstellar shell of oxygen-rich AGB stars (Blommaert et al., 2007). The stars in the original sample were selected on the basis of infrared colours (observed with the ISO and/or IRAS satellites) to represent the whole range in MLR observed on the AGB, from naked stars with no observed mass loss up to OH/IR stars with MLRs in the order of . Different studies of this sample were performed and presented in several papers: the dust content through Spitzer-IRS spectroscopy (Vanhollebeke, 2007; Golriz et al., 2014), groundbased spectroscopy and photometry, including a monitoring programme to determine the variability (Vanhollebeke, 2007)(vH2007 from now on) and a high resolution near-infrared spectroscopic study of the abundances (Uttenthaler et al., 2015).
From this sample we selected those with the reddest colours and thus also likely the stars with the highest MLRs (). The stars were detected in the IRAS survey and originally studied in van der Veen & Habing (1990).
We searched for counterparts of our sources in the OH maser database created by Engels & Bunzel (2015) which is considered complete for the published 1612 MHz maser detections until the end of 2014. Seven out of our eight sources were searched for the OH (1612 MHz) maser emission and were detected by te Lintel Hekkert et al. (1991); David et al. (1993); Sevenster et al. (1997). The velocities of the OH maser emission peaks are given in Table 1. For IRAS 17251–2821 two possible OH maser sources were detected and we give the observed velocities for both. The stars have absolute galactic latitudes above 2 degrees (except IRAS 17382-2830 with ), which limits the interference by interstellar CO and increases the chance to detect the circumstellar CO emission. Two sources are also detected in the infrared ISOGAL survey (Omont et al., 2003). As in the other papers on the Bulge sample, they are refered to with their ISOGAL name, these names have also been included in Table 1.
| IRAS name | Right Ascension | Declination | OH (peak velocities) | AV | ISOGAL name | ||
|---|---|---|---|---|---|---|---|
| (J2000) | (J2000) | (deg) | (deg) | LSR (km s-1) | mag | ||
| 17251-2821 | 17 28 18.60 | -28 24 00.4 | 358.41 | 3.49 | 181.0, 149.0a | 3.17 | |
| 246.3, 227.5 | |||||||
| 17276-2846 | 17 30 48.29 | -28 49 01.7 | 358.41 | 2.80 | 71.2, 40.4c | 4.27 | |
| 17323-2424 | 17 35 25.92 | -24 26 30.5 | 2.61 | 4.31 | +70.0, +41.8c | 4.95 | |
| 17347-2319 | 17 37 46.28 | -23 20 53.4 | 3.83 | 4.44 | +74.1, +90.1a | 4.29 | |
| 17382-2830 | 17 41 22.59 | -28 31 48.0 | 359.86 | 1.01 | 68.7, 33.7c | 5.19 | J174122.7-283146 |
| 17413-3531 | 17 44 43.46 | -35 32 34.1 | 354.26 | 3.28 | –a | 2.44 | |
| 17521-2938 | 17 55 21.80 | -29 39 12.9 | 0.47 | 2.19 | 88.5, 56.0b | 2.60 | J175521.7-293912 |
| 18042-2905 | 18 07 24.39 | -29 04 48.0 | 2.27 | 4.19 | +39.2, +69.1a | 1.48 |
Notes: Positions taken from AllWISE (Cutri & et al., 2014). Velocities of the OH maser peak emission given with respect to the Local Standard of Rest (LSR). a: te Lintel Hekkert et al. (1991), b: David et al. (1993), c: Sevenster et al. (1997). Visual extinctions, AV, are taken from Vanhollebeke (2007), ISOGAL names are from Omont et al. (2003).
Jiménez-Esteban & Engels (2015) (JEE15 from now onwards) selected a sample of thirty-seven Bulge IRAS sources with OH/IR star-like IRAS colours and modelled the spectral energy distributions (SED). We will compare our analysis with theirs in Section 5. A difference in the selection of our sample, based on Blommaert et al. (2007), with JEE15 is that all our sources have IRAS 12 m flux densities below 10 Jy. This limit was imposed as van der Veen & Habing (1990) considered these to be most likely Bulge members and not of the galactic disk. JEE15 did not impose such a flux criterion.
3 Data and observations description
3.1 Spectral Energy Distribution data
We made use of VizieR (Ochsenbein et al., 2000) and data in the literature to collect photometric data at the position of the OH/IR stars to create their SEDs. Two important aspects about our sources need to be considered. One is the fact that our stars are highly variable and that the data obtained from different catalogues and publications have not been observed at the same single epoch. Second, the Bulge is a high source-density area, so that confusion with nearby sources is a risk. The strategy followed was to start searching in the VizieR database for the nearest AllWISE counterpart (Cutri & et al., 2014) of the IRAS position. The WISE and IRAS surveys overlap in the mid-infrared wavelength regime, where fewer sources are detected, limiting the chance of a wrong association. The WISE sources selected in this manner have a [W3] [W4] colour of about 2 magnitudes, consistent with the IRAS colours. The AllWISE positions are accurate up to 50 mas. In a second step, a search area of radius around the position was used to search in other infrared catalogues. In case of finding more than one source, the reddest object is selected. The data is given in Table 2.
| Filter | 17251–2821 | 17276–2846 | 17323–2424 | 17347–2319 | 17382–2830 | 17413–3531 | 17521–2938 | 18042–2905 |
|---|---|---|---|---|---|---|---|---|
| CASPIR (mag) | ||||||||
| H | 13.78 0.01 | 12.85 0.01 | ||||||
| K | 14.02 0.01 | 10.86 0.01 | 10.33 0.01 | 8.99 0.01 | 10.09 0.01 | |||
| K | 14.47 0.01 | 11.09 0.01 | 11.56 0.01 | 10.09 0.01 | 10.87 0.01 | |||
| K | 14.92 0.01 | 11.21 0.01 | 12.79 0.01 | 11.10 0.01 | 11.65 0.01 | |||
| nbL | 8.11 0.02 | 7.02 0.02 | 6.80 0.02 | |||||
| ESO (mag) | ||||||||
| K | 12.27 0.08 | 15.0 0.2 | 10.6 0.1 | 8.69 0.07 | 12.5 0.9 | |||
| K | 10.98 0.03 | 10.06 0.02 | 12.2 0.2 | |||||
| K | 11.1 0.7 | 8.33 0.03 | ||||||
| L | 6.53 0.04 | 8.05 0.02 | 7.36 0.03 | 5.94 0.02 | 5.21 0.04 | 6.38 0.02 | ||
| L | 8.62 0.03 | 8.94 0.05 | 6.36 0.1 | 6.37 0.01 | 6.73 0.03 | |||
| L | 6.53 0.03 | 5.10 0.02 | ||||||
| M | 4.77 0.05 | 6.59 0.08 | 5.33 0.04 | 4.81 0.04 | 4.30 0.04 | 5.23 0.07 | ||
| M | 6.53 0.07 | 6.56 0.08 | 5.15 0.03 | 5.51 0.04 | 5.56 0.05 | |||
| M | 5.46 0.05 | 4.26 0.06 | ||||||
| N1 | 2.24 0.03 | 3.5 0.1 | 2.46 0.05 | 2.80 0.03 | 2.59 0.03 | 3.02 0.03 | ||
| N1 | 3.4 0.1 | 4.9 0.7 | 3.19 0.08 | 2.99 0.07 | 3.6 0.01 | 3.4 0.1 | ||
| N1 | 3.43 0.09 | 2.70 0.07 | ||||||
| N2 | 2.95 0.05 | 2.4 0.3 | 3.3 0.1 | 3.42 0.03 | 2.44 0.06 | 3.39 0.05 | ||
| N2 | 4.9 0.4 | 5.0 0.6 | 3.7 0.1 | 3.9 0.2 | 4.0 0.2 | |||
| N2 | 4.0 0.4 | 2.54 0.07 | ||||||
| N3 | 1.24 0.05 | 1.48 0.09 | 1.77 0.04 | 1.7 0.1 | 1.93 0.07 | |||
| N3 | 2.3 0.3 | 1.9 0.2 | 1.8 0.1 | 2.5 0.3 | 2.0 0.1 | |||
| N3 | 2.0 0.2 | 1.8 0.1 | ||||||
| 2MASS (mag) | ||||||||
| J | 16.57 0.04 | |||||||
| H | 14.59 0.02 | |||||||
| Ks | 10.72 0.01 | 9.06 0.02 | 10.59 0.02 | |||||
| VISTA (mag) | ||||||||
| J | 16.75 0.09 | 17.77 0.30 | ||||||
| H | 15.4 0.1 | 13.20 0.01 | 13.51 0.01 | |||||
| Ks | 16.13 0.15 | 18.3 0.3 | 11.70 0.01 | 11.92 0.01 | 11.08 0.01 | 17.0 0.5 | 12.01 0.01 | |
| GLIMPSE (mag) | ||||||||
| irac36 | 7.91 0.03 | 8.27 0.03 | 6.77 0.06 | 9.96 0.05 | 6.55 0.05 | |||
| irac36 | 10.22 0.06 | |||||||
| irac45 | 5.80 0.05 | 7.10 0.03 | 4.91 0.05 | 7.06 0.04 | 5.37 0.08 | |||
| irac45 | 7.31 0.04 | |||||||
| irac58 | 4.10 0.02 | 4.81 0.02 | 3.89 0.02 | 4.87 0.02 | 4.35 0.04 | |||
| irac58 | 5.05 0.03 | |||||||
| irac80 | 3.00 0.02 | 3.20 0.06 | 4.55 0.15 | |||||
| AllWISE (mag) | ||||||||
| WISE1 (3.4 m) | 9.73 0.03 | 8.35 0.02 | 10.20 0.03 | 7.35 0.03 | 6.98 0.03 | 7.29 0.03 | 11.43 0.08 | 7.02 0.03 |
| WISE2 (4.6 m) | 6.63 0.02 | 6.86 0.02 | 6.42 0.02 | 5.15 0.06 | 4.62 0.04 | 5.07 0.04 | 7.24 0.02 | 5.19 0.08 |
| WISE3 (12 m) | 2.75 0.01 | 2.21 0.01 | 2.38 0.01 | 2.70 0.01 | 2.48 0.02 | 3.35 0.01 | 3.10 0.01 | 2.09 0.01 |
| WISE4 (22 m) | 0.34 0.02 | 0.06 0.01 | 0.18 0.02 | 0.65 0.01 | 0.53 0.02 | 1.23 0.02 | 0.52 0.02 | 0.12 0.01 |
| ISOGAL (mag) | ||||||||
| LW2 (7 m) | 3.47 0.01 | |||||||
| LW3 (15 m) | 1.54 0.03 | |||||||
| IRAS (Jy) | ||||||||
| F12 | 3.6 0.4 | 2.5 0.3 | 3.4 0.3 | 3.6 0.4 | 2.0 0.2 | 5.0 0.5 | 3.1 0.3 | 4.7 0.5 |
| F25 | 8.5 0.9 | 7.9 0.8 | 8.5 0.9 | 5.9 0.6 | 4.3 0.4 | 6.8 0.7 | 8.2 0.8 | 8.4 0.8 |
| F60 | 4.3 0.4 | 7.1 0.7 | 4.4 0.4 | 1.5 0.2 | 2.2 0.2 | 7.1 0.7 | 2.6 0.3 | |
| MSX (Jy) | ||||||||
| A (8.28) | 2.1 0.2 | 2.1 0.2 | 2.3 0.2 | 2.8 0.3 | 2.1 0.2 | 2.3 0.2 | 1.5 0.5 | 2.9 0.3 |
| C (12.13) | 3.7 0.4 | 3.4 0.3 | 2.9 0.3 | 4.9 0.5 | 2.7 0.3 | 2.9 0.3 | 2.4 0.2 | 4.0 0.4 |
| D (14.65) | 4.9 0.5 | 5.8 0.6 | 5.5 0.6 | 5.2 0.5 | 3.3 0.3 | 3.1 0.3 | 4.3 0.4 | 5.0 0.5 |
| E (21.34) | 5.8 0.6 | 5.4 0.5 | 7.1 0.7 | 4.7 0.5 | 4.0 0.4 | 3.0 0.5 | 5.5 0.6 | 6.2 0.6 |
| MIPS (mag) | ||||||||
| mips24 | 0.58 0.02 | 1.05 0.02 | ||||||
| AKARI (Jy) | ||||||||
| S9 | 2.7 0.6 | 2.59 0.60 | 2.47 0.40 | |||||
| S18 | 4.7 0.9 | 5.9 0.4 | 4.3 0.2 | 3.79 0.01 | 2.47 0.02 | 6.94 1.27 | 4.89 0.62 | |
| S65 | 2.09 0.22 | |||||||
| S90 | 2.2 0.2 | 1.9 0.4 | 1.78 0.08 | |||||
| PACS (Jy) | ||||||||
| 70 | 2.1 0.3 | 6.4 1.3 | 3.3 0.7 | 5.3 1.1 | ||||
| 140 | 0.4 0.1 | 1.1 0.2 | 0.4 0.1 | 0.9 0.2 |
We have complemented the VizieR data with the , nb averaged photometry from the vH2007 monitoring programme obtained at the Mount Stromlo observatory. We also included the ESO photometric 2 – 13 m data obtained by van der Veen & Habing (1990). Finally, public DR4 data from the VVV Survey (Minniti et al., 2010) was included111see http://horus.roe.ac.uk/vsa/index.html. IRAS17521 and IRAS17323 are not listed in the source catalog, but are visible on the -band image and the magnitudes have been estimated by scaling the flux (minus background) in a 33 pixel region to that of a nearby catalogue star.
Finally half of our sample were also observed with the Herschel PACS spectrometer (Pilbratt et al., 2010; Poglitsch et al., 2010) in the open time programme “Study of the cool forsterite dust around evolved stars” (OT2_jblommae_2). The flux densities given in Table 2 are the continuum levels at 70 and 140 m of the central spaxel as obtained from archive pipeline product v14. The flux densities were corrected for the missing part of the point spread function (PSF). The formal uncertainties of the PACS spectrometer flux calibration is 15%.
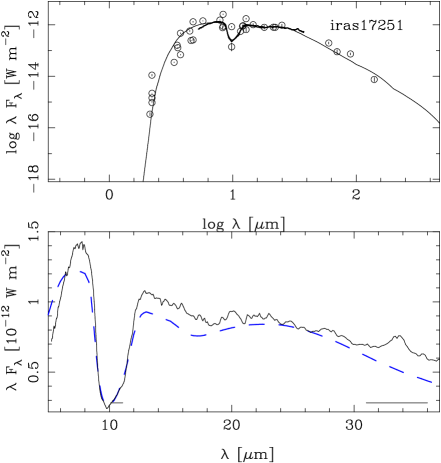
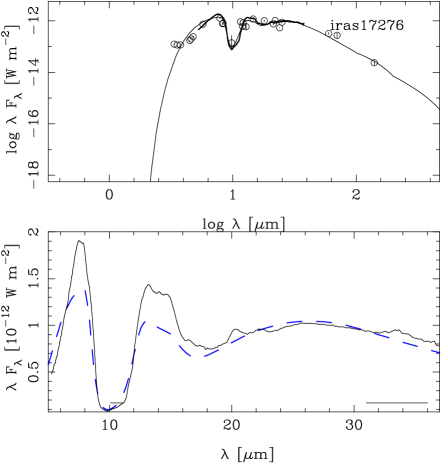
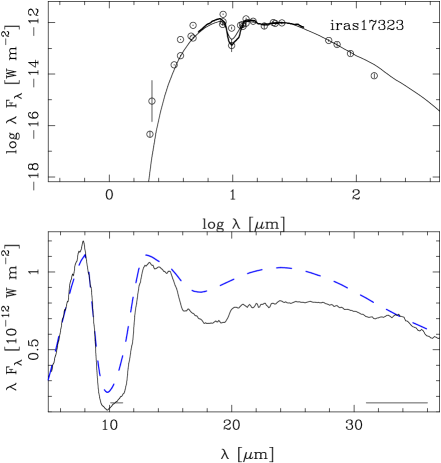
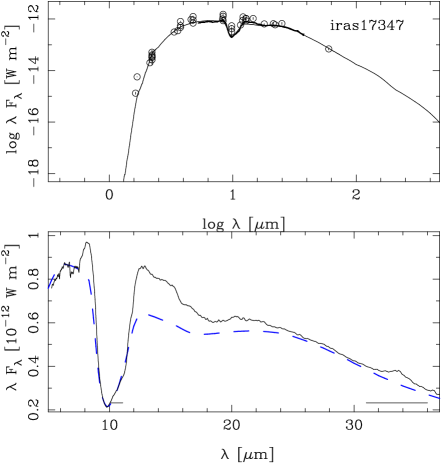
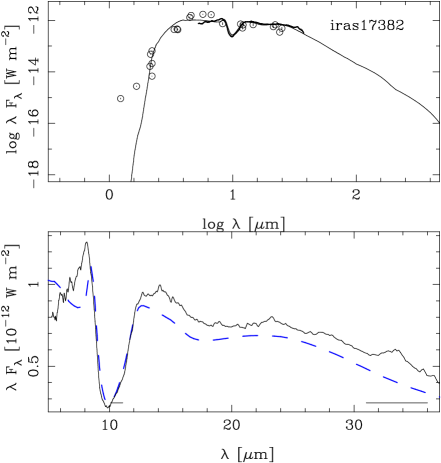
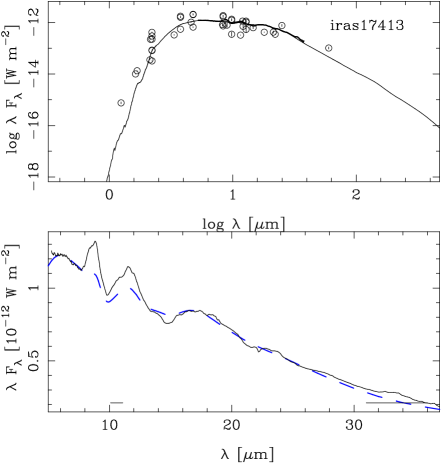
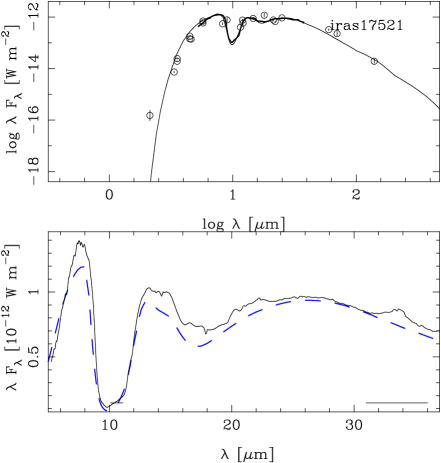
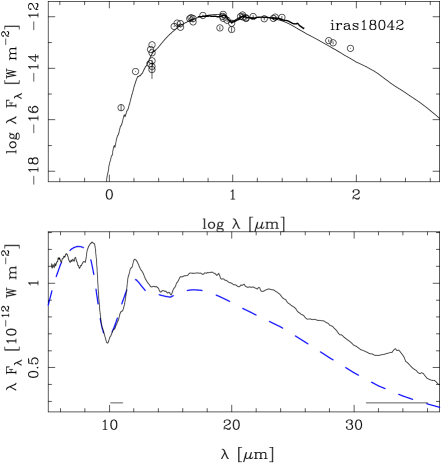
Figure 1 shows the obtained SEDs and the model fits obtained (see Section 4.1). The figure also includes the Spitzer-IRS spectrum covering the 5-37 m wavelength range and which are taken from Golriz et al. (2014). All sources show typical SEDs for OH/IR stars, i.e. an optically thick silicate-rich dust shell with strong absorption features at 9.7 and 18 m.
3.2 CO Observation and data reduction
The CO J= 2-1 and J= 3-2 transitions were observed with the APEX telescope located in the Atacama dessert in Chile (Güsten et al., 2006). The observations were obtained in service mode on September 11, 12, 13, November 10, 11, 12, 2011 (I17276, I17323, I17521, I18042) and September 26, 27, 29, 30, 2012 (I17251, I17347, I17413, I17382). Weather conditions varied but most observations were taken with a precipitable water vapour (PWV) between 0.7 and 1.3 mm for the J= 3-2, and between 1 and 2 mm for the J= 2-1 transition. The APEX-1 and APEX-2 receivers of the Swedish Heterodyne Facility Instrument (SHeFI)222http://gard04.rss.chalmers.se/APEX_Web/SHeFI.html (Belitsky et al., 2006; Vassilev et al., 2008) were tuned to the CO J= 2-1 and 3-2 line, respectively. The beam size and the main-beam efficiency at these frequencies are 26.4″ (FWHM), = 0.73, respectively, 17.3″, 0.75. The XFFTS (eXtended bandwidth Fast Fourier Transform Spectrometer) backend (see Klein et al. (2012)) was connected to the receivers. Wobbler switching was used with a throw of 50″. Regular observations of bright sources were performed to check the pointing and calibration.
The data were reduced in CLASS333http://www.iram.fr/IRAMFR/GILDAS/. Linear baselines were subtracted avoiding regions that were affected by interstellar contamination and the location of the CO detection (or using the velocity range suggested by the OH maser emission line in case of a CO non-detection). Typical total integration times per source were 40-50 minutes for the J=2-1 and 100-130 minutes for the J=3-2 transitions, leading to a RMS of mK for both transitions at a velocity resolution of 1 km s-1.
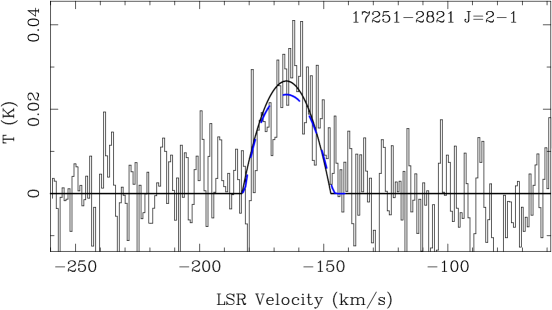
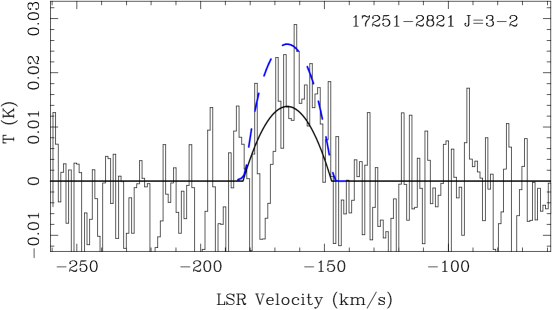
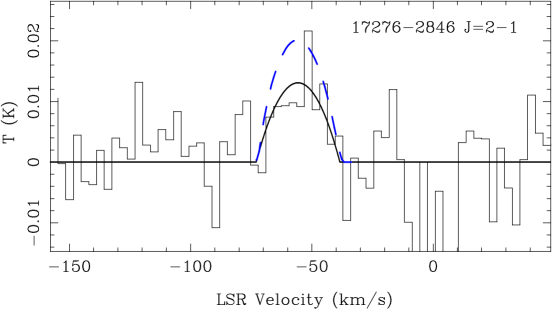
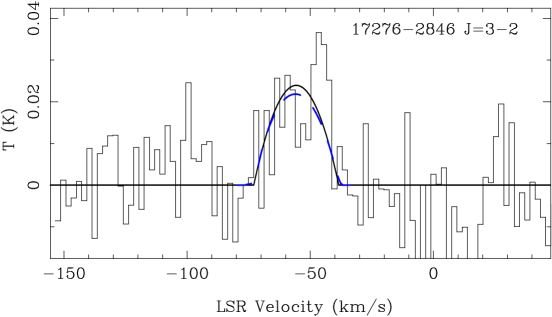
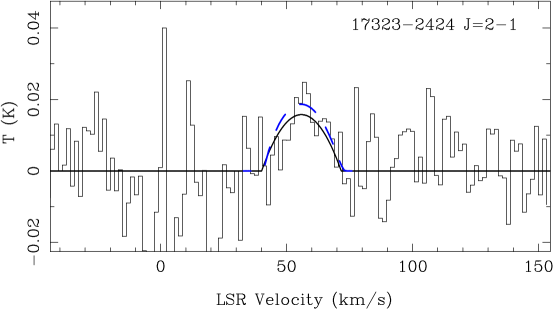
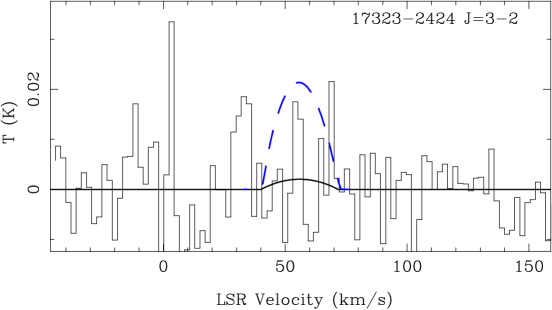
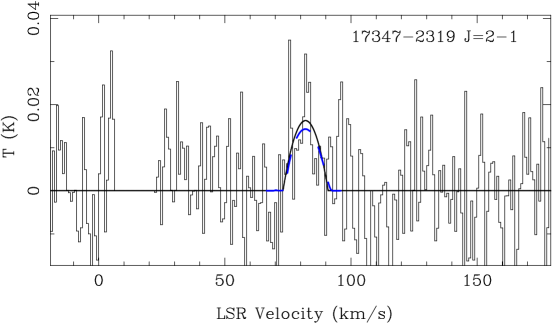
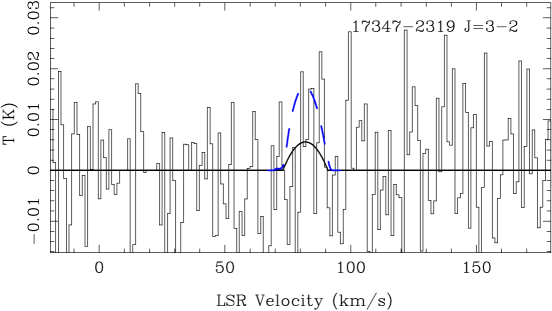
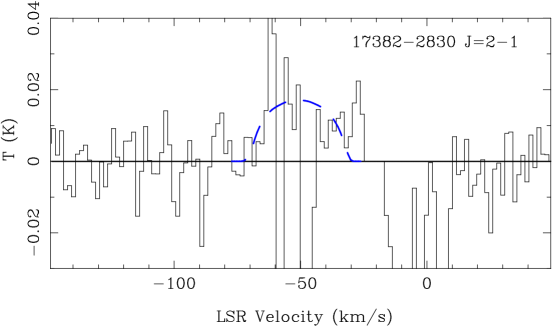
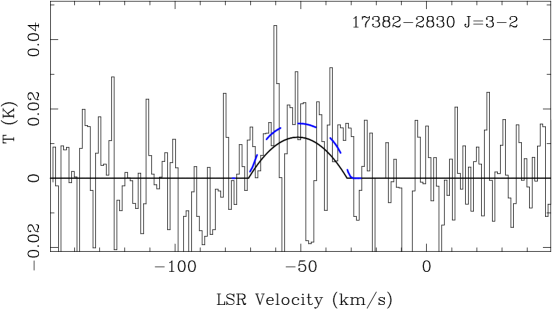
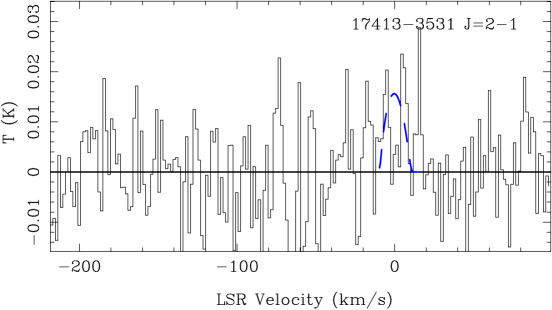
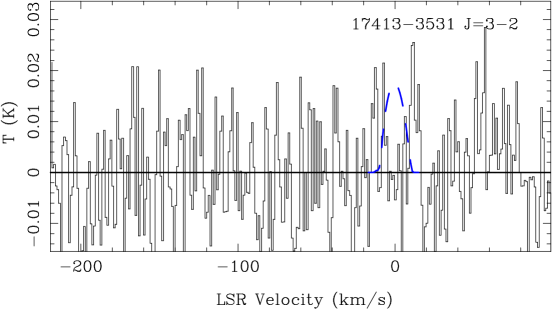
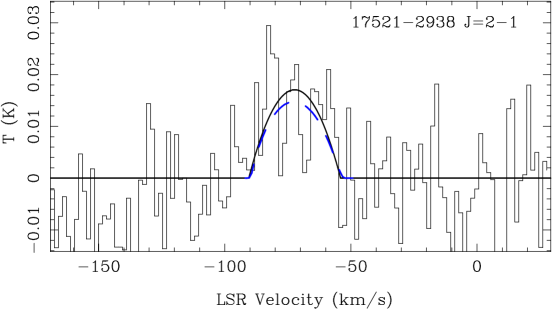

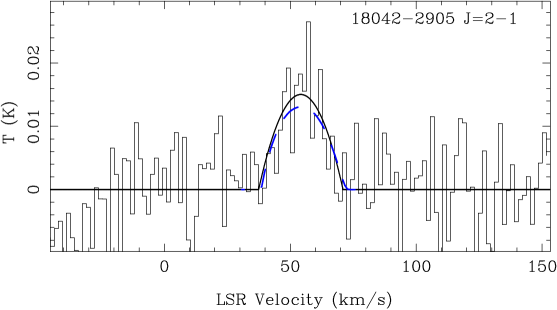
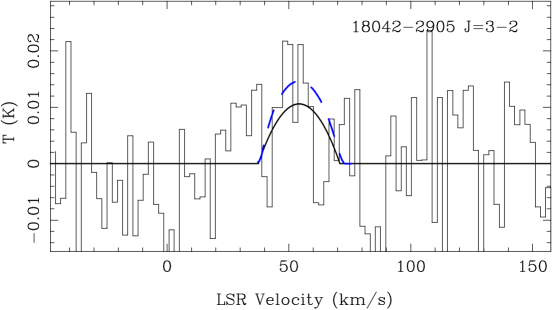
The resulting profiles are shown in Figure 2 plotting main-beam temperatures against velocity (using the LSR as the velocity reference).
The profiles were fitted with our own Fortan version of the "Shell" profile available within CLASS/GILDAS software package444http://www.iram.fr/IRAMFR/GILDAS/doc/html/class-html/node38.html,
| (1) |
where is the stellar velocity (in km s-1), is the integrated intensity (in K km s-1), the full-width at zero intensity (in km s-1, and the expansion velocity vexp is taken as half that value), and the horn-to-center parameter. This parameter described the shape of the profile, with for a parabolic profile, for a flat-topped one, and for a double-peaked profile. In the fitting below, a parabolic profile was assumed for all cases. From the fitting we obtain the stellar radial and expansion velocities. However as the CO profiles are relatively weak, we have chosen to use the OH velocity information and keep the stellar and expansion velocities fixed. Groenewegen et al. (1998) compared expansion velocities derived from OH and CO observations and found that generally the CO profiles are 12% wider and we applied this correction for our fitting.
The results are listed in Table 3. The errors in the parameters were estimated by a Monte Carlo simulation where the intensity in every channel was varied according to a Gaussian with the observed rms noise (assuming the channels are independent), and the profile refitted. For sources where we could obtain an independent fitting of the CO profile, without using the OH velocities we give the obtained velocities in the same Table. The "CO" and "modified OH" velocities generally agree within the errors.
| IRAS | ||||||||||
|---|---|---|---|---|---|---|---|---|---|---|
| name | (km s-1) | (km s-1) | (K) | (K km s-1) | (K) | (K km s-1) | (km s-1) | (km s-1) | (km s-1) | (km s-1) |
| 17251-2821 | -165.0 | 35.8 | 0.027 0.002 | 0.637 0.042 | 0.014 0.002 | 0.327 0.047 | -162.3 0.9 | 37.1 2.4 | -160.0 0.5 | 28.3 3.3 |
| 17276-2846 | -55.8 | 34.5 | 0.013 0.004 | 0.305 0.090 | 0.024 0.004 | 0.55 0.10 | -55.7 2.0 | 31.7 6.1 | -53.6 2.0 | 36.7 5.9 |
| 17323-2424 | 55.9 | 31.6 | 0.016 0.005 | 0.336 0.096 | - | - | 58.9 1.5 | 28.0 4.0 | ||
| 17347-2319 | 82.0 | 17.9 | 0.017 0.003 | 0.198 0.039 | 0.005 0.004 | 0.065 0.046 | ||||
| 17382-2830 | -51.2 | 39.2 | - | - | 0.012 0.003 | 0.312 0.086 | ||||
| 17413-3531 | - | - | - | - | - | - | ||||
| 17521-2938 | -72.3 | 36.4 | 0.017 0.003 | 0.416 0.067 | 0.014 0.003 | 0.323 0.075 | -73.3 2.2 | 47.3 6.7 | -75.0 3.0 | 40.9 8.0 |
| 18042-2905 | 54.2 | 33.5 | 0.015 0.002 | 0.338 0.043 | 0.011 0.003 | 0.236 0.076 | 55.3 1.3 | 28.9 2.9 | 51.6 3.9 | 28.5 7.0 |
Notes: The and are taken from the OH observations. For the sources where an independent fit of the CO profile was possible (see Section 3.2), the velocities are given in the last 4 columns.
4 Analysis
4.1 Modelling of the IR data
The models are based on the "More of DUSTY" (MoD) code (Groenewegen, 2012) which uses a slightly updated and modified version of the DUSTY dust radiative transfer (RT) code (Ivezić et al., 1999) as a subroutine within a minimization code. The code determines the best-fitting dust optical depth, luminosity, dust temperature at the inner radius and the slope, , of the density distribution () by fitting photometric data and spectra (and visibility data and 1D intensity profiles, but these data are not available for the sample considered here). The code minimizes a based on every available photometric and spectroscopic datapoint, but also calculates the for the photometric and spectroscopic datapoints seperately. This allows the user to weigh the spectroscopic data relative to the photometric data. In practise the errorbars on the spectroscopic dataset are scaled (typically by a factor of order 0.2) so that photometry and spectroscopy give roughly equal weight to the overall fit. In the present model the dust temperature at the inner radius has been fixed to 1000 K, and we assume a density law, only fitting for the luminosity and dust optical depth (at 0.55 m). The outer radius is set to a few thousand times the inner radius, to where the dust temperature has reached 20 K, typical of the ISM. MoD does not take into account the actual heating of the dust grains by the ISM and so this is an approximation. Because of interaction of the expanding AGB wind with the ISM there can also be deviations for a density law. These approximations have no impact on the results as there is no far-IR data available for our sample that could constrain these values. The longest wavelength data available for some stars is the PACS data at 140 m. Some test calculations indicate the the flux in this filter is reduced by less that 10% if the outer radius were reduced by a factor of below 1000 times the inner radius to where the dust temperature is about 30-35 K.
Several combinations of dust species have been tried to obtain a best fit. They were olivine (amorphous MgFeSiO4, optical constants from Dorschner et al. (1995)), compact amorphous aluminum oxide (Begemann et al., 1997), and metallic iron (Pollack et al., 1994). The resulting abundance ratios for each source are given in Table 4.
Astronomical grains are not solid spheres and to mimic this the absorption and scattering coefficients have been calculated assuming a "distribution of hollow spheres" (DHS, Min et al. 2003) with a maximum vacuum volume fraction of 0.7, that is appropriate for interstellar silicate dust grains (Min et al., 2007). An advantage of a DHS is that the absorption and scattering coefficients can be calculated exactly for arbitrary grain sizes. Single sized grains of 0.1, 0.2 and 0.5 m have been considered. The largest grain size used is inspired by recent observations of dust around O-rich stars (Norris et al., 2012; Scicluna et al., 2015; Ohnaka et al., 2016).
The stellar photosphere was represented as a MARCS model atmosphere555http://marcs.astro.uu.se/ (Gustafsson et al., 2008) of 2600 K (and = 0.0, 2 M⊙, and solar metallicity). As shown below, all stars are so dust enshrouded that the SED fitting is insensitive to the input model atmosphere.
A canonical distance of 8 kpc has been assumed, slightly smaller than the value quoted in the recent review by de Grijs & Bono (2016), 8.3 0.2 (statistical) 0.4 (systematic) kpc and which is based on an analysis of the up-to-date most complete database of Galactic Centre distances.
The reddening law used in MoD is described in Groenewegen (2012). The interstellar reddening is taken from vH2007 (see Table 1).
The model fits are shown in Figure 1 and the resulting parameters (L∗, Rin, , dust optical depth , grain size, grain density , and flux-weighted dust extinction coefficient ) in Table 4.
Error bars are not listed explicitly as they are difficult to estimate. The fitting returns the error on the parameters (luminosity and optical depth in this case). These are typically very small as the resulting are large (reduced in the range 40-600). This is related to the fact that the stars are variable and the SED is constructed by combining multi-epoch data, without any attempt to average data in similar filters. As the amplitude of the variability is (much) larger than the error on a single measurement this implies that the is typically always large. One estimate for the error in luminosity and optical depth (hence dust MLR) comes from the internal error scaled to give a reduced of unity. A second estimate for the error comes from the values of the parameters in a range of above the best-fitting value. This is required in any case, as for example the absorption and scattering coefficients are external to the code, and the model is only run on a grid with discrete values of the parameters (grain sizes and dust composition in this case).
Based on the above considerations, our best estimate for the 1 error on the luminosity is 10%, but that does not include the spread in distances because of the depth of the Bulge ( kpc, which gives a possible deviation of in ). The MLR scales linearly with the adopted distance.
As stated above, the errorbars on the spectroscopic datapoints is reduced by a certain factor as to give all spectroscopic datapoints about equal weight in the fitting as all the photometry points. Changing this scaling factor by a factor of two leads to a change of less than 10% in the MLR and less than 1% in luminosity.
The error on the optical depth is also of order 10%, but the error on the dust MLR is larger. This is related to the derived inner radius. The error on that quantity is 5%, but there is a much larger error involved due to the unknown effective temperature and dust temperature at the inner radius (both are hard to determine and have been fixed). A realistic error on the inner radius would be a factor of 2, and this is then also a realistic error on the derived dust MLRs.
The best fitting grain size is given (out of the considered values of 0.1, 0.2, and 0.5 m), but none of the values can be excluded. A larger grain size will lead to a higher dust extinction (less flux at shorter wavelengths), which could also be mimicked by a larger interstellar extinction. The values of the flux-weighted extinction coefficient scale with the adopted grain size. To evaluate the impact we redid the SED modelling of IRAS 17251–2821, assuming a 0.1 m grain (c.f. 0.5 m grains in our best fit model). The luminosity remained unchanged, but the inner dust radius decreases from 12.2 to 9.1 and the dust mass loss rate increases by 40%.
| IRAS | L∗ | Rin | grain size | dust mix | ||||
|---|---|---|---|---|---|---|---|---|
| name | () | () | ( M⊙ yr-1) | (m) | (g cm-3) | (at 0.55 m) | ||
| 17251-2821 | 4780 | 12.2 | 9.8 | 0.50 | MgFeSiO4:Al2O3:Fe 90:10:10 | 0.25 | 2.70 | 64.5 |
| 17276-2846 | 5120 | 13.6 | 20.6 | 0.50 | MgFeSiO4:Fe 100:10 | 0.20 | 2.65 | 119.0 |
| 17323-2424 | 4960 | 12.1 | 13.3 | 0.50 | MgFeSiO4:Fe 100:30 | 0.32 | 3.45 | 90.8 |
| 17347-2319 | 3880 | 9.2 | 6.6 | 0.20 | MgFeSiO4:Al2O3:Fe 95:5:10 | 0.10 | 2.68 | 106.0 |
| 17382-2830 | 5460 | 13.5 | 7.7 | 0.50 | MgFeSiO4:Al2O3:Fe 90:10:3 | 0.23 | 2.35 | 41.7 |
| 17413-3531 | 4920 | 9.0 | 2.5 | 0.50 | MgFeSiO4:Al2O3:Fe 80:20:30 | 0.50 | 3.52 | 23.0 |
| 17521-2938 | 4110 | 13.8 | 20.0 | 0.50 | MgFeSiO4:Fe 100:10 | 0.20 | 2.65 | 127.0 |
| 18042-2905 | 4600 | 7.9 | 4.3 | 0.10 | MgFeSiO4:Fe 100:30 | 0.075 | 3.45 | 37.7 |
Notes: The dust MLR is determined for a 10 km s-1 expansion velocity. is the flux-weighted extinction coefficient and , the grain density.
| IRAS | ||||||
|---|---|---|---|---|---|---|
| name | (km s-1) | (km s-1) | ( M⊙ yr-1) | ( M⊙ yr-1) | ||
| 17251-2821 | 17.9 | 6.3 | 2.4 | 167 | 4.0 | 0.72 |
| 17276-2846 | 17.2 | 4.4 | 4.5 | 195 | 8.7 | 0.75 |
| 17323-2424 | 15.8 | 5.5 | 2.9 | 324 | 9.5 | 0.75 |
| 17347-2319 | 9.0 | 2.8 | 7.8 | 385 | 3.0 | 0.75 |
| 17382-2830 | 19.6 | 7.8 | 2.1 | 106 | 2.2 | 0.75 |
| 17521-2938 | 18.2 | 4.5 | 4.6 | 154 | 7.0 | 0.75 |
| 18042-2905 | 16.7 | 3.9 | 0.9 | 366 | 3.2 | 0.75 |
4.2 Modelling of the CO data
To derive the gas MLR, we assume that the dust is driven by the radiation pressure and that the gas is driven by collisions with the dust particles. For this, we solve the equation of motion for dust-gas interaction based on Goldreich & Scoville (1976). The dust MLR and stellar parameters as well as the dust properties are taken from the SED modelling in section 4.1. We assumed that the stellar mass for these Bulge OH/IR stars is 2 M⊙. The initial masses of the OH/IR stars will be further discussed in Section 7. In order to drive the gas to the observed gas terminal velocity, we input the gas-to-dust mass ratio. Hence, we obtain the dynamical gas MLR for each object. At the same time, we calculate the dust drift velocity, , via
| (2) |
where is the total MLR and the gas velocity which is measured from the OH maser observations (Table 1) and corrected to the terminal velocity hence the gas velocity is 1.12 (as described in 3.2). The dust velocity is simply . The dust mass loss required to fit the SED is then modified by the derived dust velocity, . The SED fitting measures the dust column density hence keeping will maintain the overall SED fit. The modified dust MLR is again used as an input in the dynamical calculation in the iterative process to calculate the gas velocity and the dust velocity by modifying the dust-to-gas mass ratio.
The new value of the dust velocity is then used to calculate an updated dust MLR (keeping the constant).
This iterative process is said to be converged when the values of the successive dust velocities agree to better than 1%. Table 5 lists the parameters derived from the dynamical calculations.
In general, we can use the velocity profile to probe the formation of lines with different excitation but in this study, CO J=2-1 and 3-2 arise in the region where the wind has reached its final velocity and hence do not probe the acceleration zone.
We assume that the metallicity of the stars in the Galactic Bulge is approximately solar (Uttenthaler et al., 2015) and thus take a cosmic abundance of carbon and oxygen hence the CO abundance, CO/H2, is 3. We used the molecular radiative transfer code based on works by Schoenberg & Hempe (1986) and Justtanont et al. (2004) to simulate the CO lines. We took into account up to J=30 levels for both the ground and first vibrational states of CO. The collisional rates for between the rotational states in both v=0 and 1 are taken from Yang et al. (2010).
We assume a gas temperature law in a form
| (3) |
where is the effective temperature of the star and is a gas temperature exponent between 0.7 - 0.75 (see Table 5) which gives the best result for to the observed CO profiles. We take into account the infrared pumping by the dust and assume a dust temperature in a form of
| (4) |
where is the dust condensation temperature, 1000 K and is a dust temperature exponent of 0.45 - a slope derived from a single power law from the dust SED modelling. We set the CO outer radius to be at 1.5 times the CO photodissociation radius set to be where the CO abundance drops to half its initial value (Mamon et al., 1988). Since the time this analysis was performed, one of our co-authors presented a new paper on the calculation of the CO photodissociation radius (Groenewegen, 2017), based on improved numerical method and updated H2 and CO shielding functions. Taking the resulting radius for a star with a MLR of yr-1 from his Table 1, as a representative case for our sample, we find a radius which is 10% smaller than what we used, on basis of Mamon et al. (1988), well within the uncertainties.
The CO line intensities derived from our dynamical modelling are plotted together with our CO data in Figure 2. It should be mentioned that at these high MLR ( yr-1) the optically thick spectral lines become saturated (Ramstedt et al., 2008), so that the line intensities become less dependent to the MLR. This has no effect on our derived MLR as this is obtained from the dynamical modelling. The calculated CO lines are more sensitive to the gas kinetic temperature which is described by eqn. 3.
The dynamical MLR is derived from the assumption that the dust driven wind varies smoothly as 1/ for a spherical symmetric wind outside the acceleration zone where it has reached a constant terminal velocity. Contrary to the modelling of OH/IR stars by Justtanont et al. (1996), there is no need to shorten the CO outer radius. For the sample of our study no significant change in the MLR is required to fit the CO profile. We will further discuss this issue in Section 8.
The derived gas-to-dust mass ratios range from about 100 to 400 and reflect a large range seen in galactic objects (Justtanont et al., 2006). The derived MLRs are reasonably moderate for OH/IR stars and lower than those derived from galactic extreme OH/IR stars which show MLRs in excess of 10-4 M⊙ yr-1. The latter stars are thought to be intermediate-mass stars with initial masses M M⊙ based on their low 18O/17O ratios (Justtanont et al., 2015).
In order to check how the input parameters affect the outcome, we changed the velocity by 15% and calculate the resulting dust and gas mass loss rates. Changing the gas velocity by 15% changes the dust mass loss rate and the dust (gas drift) velocity by the same amount but affects the gas-to-dust by 25%. The combined changes result in a change in the derived gas mass loss rate by 10%.
Just like in Section 4.1 we investigate here the effect of using a smaller 0.1 m grain in our modelling for IRAS 17251–2821. With the smaller grain size we find a smaller km s-1 in the dynamical modelling and hence obtain a difference of only 15% in , rather than the 40% we obtained in Section 4.1. The total MLR becomes , i.e. 30% higher than in the 0.5 m grain case and the becomes 190 vs 167 (see Table 5).
4.3 Periods of the variables
Amongst the Long Periodic Variable stars, OH/IR stars are known to have the largest amplitudes ( 1 magnitude bolometric) and the longest periods (several hundreds up to more than a thousand days). vH2007 monitored the stars in near-infrared bands ( and ). For four sources the period of variability could be established which are indicated in Table 6. The other sources showed either variability, but no period could be established or were not detected in the K band. More recently, multi-epoch observations from the VVV survey in the K-band (we used public data from DR4) and the AllWISE Multi epoch Photometry Table and the Single Exposure (L1b) Source Table from the NEOWISE reactivation mission (Mainzer et al., 2014) became available. For the latter we used data in the W2 filter at 4.6 m where the OH/IR stars stand out as bright stars with respect to the surrounding stars. We did not use the longer wavelength filters W3 and W4, as the PSF becomes larger and increases the risk of crowding. We only used data with individual error bars less than 0.04 mag.
The K- and W2-band data were investigated separately to determine the periods, amplitudes and mean magnitudes using the program Period04 (Lenz & Breger, 2005).
The periods, averaged magnitude over the light curve and the amplitude are shown in Table 6. For IRAS 17251–2821, which is very weak at K (14.5 mag), we were able to establish a period on the basis of the K-band VVV survey data where previously vH2007 could only establish that the source was variable but could not determine a period. For the four sources with periods determined in vH2007 and now from the VVV-survey we find similar periods, only deviating by a few percent, except for IRAS 17347–2319 (see Section 4.4). The vH2007 monitoring period took place in 2004 – 2006 and the VVV data covers 2011 – 2013, so that slight changes might be real. The average magnitudes are generally fainter for the VVV survey than in the vH2007 result, which can be explained by the difference in the filter profile of the MSSO K band (McGregor, 1994) and the Ks band used in the VISTA system (Minniti et al., 2010), combined with the very red SEDs of our sources. IRAS 17347–2319 and 18042–2905 show consistent K-band amplitudes, 17382–2830 and 17413–3531 show much smaller amplitudes in our new fitting. For the latter source this might be related to the lower quality of the VVV photometry and subsequently of our fit.
For all our sources we were able to determine periods from the WISE survey. The fact that our sources are brighter at 4.6 m and suffer less of source confusion is likely to explain this higher success rate. The periods are consistent with what is derived from the VVV K-band survey. In case of the WISE data the period from vH2007 or the period determined from analysing the VVV data was used as a first guess and the program was allowed to converge. In the cases that there was only WISE data available, several periods were tried. For the further analysis, we adopt one period per source. In case of 2 K-band periods, we use the average value, for IRAS 17251–2821 we adopt the VVV derived period and in all other cases we take the WISE band derived value. The adopted periods are given in the last column of Table 6.
| vH2007 | VVV | WISE | ||||||||
|---|---|---|---|---|---|---|---|---|---|---|
| IRAS name | Period | < K > | K | Period | < K > | K | Period | < W2 > | W2 | adopted |
| (days) | (mag) | (mag) | (days) | (mag) | (mag) | (days) | (mag) | (mag) | P (days) | |
| 17251-2821 | – | 14.47 | 693 (7) | 16.07 (0.11) | 0.98 (0.02) | 681 (3) | 5.74 (0.03) | 1.10 (0.05) | 693 | |
| 17276-2846 | – | 488 (15) | 7.35 (0.02) | 0.72 (0.03) | 488 | |||||
| 17323-2424 | – | 552 (5) | 6.53 (0.05) | 0.94 (0.06) | 552 | |||||
| 17347-2319 | 355 | 11.09 | 0.23 | 290 (3) | 11.64 (0.02) | 0.26 (0.02) | 292 (1) | 4.99 (0.04) | 0.86 (0.05) | 323 |
| 17382-2830 | 594 | 11.56 | 1.23 | 629 (9) | 12.2 (0.2) | 0.78 (0.03) | 625 (6) | 4.38 (0.07) | 1.09 (0.07) | 611 |
| 17413-3531 | 624 | 10.09 | 1.10 | 664 (18) | 11.22 (0.05) | 0.68 (0.06) | 639 (9) | 5.38 (0.03) | 1.03 (0.04) | 644 |
| 17521-2938 | – | 562 (3) | 7.20 (0.01) | 0.51 (0.02) | 562 | |||||
| 18042-2905 | 594 | 10.87 | 0.78 | 574 (5) | 11.71 (0.04) | 0.80 (0.04) | 556 (3) | 5.28 (0.03) | 0.86 (0.04) | 584 |
Notes: Periods and semi-amplitudes taken from Vanhollebeke (2007) and newly determined on basis of VVV and WISE survey data (see text). Uncertainties are given between brackets, but are not available in vH2007. The last column gives the period that is further used in the analysis.
4.4 Comments on individual sources
-
•
IRAS 17382-2830: Only source where we could only detect the CO (3-2) transition, and not the (2-1). The overall noise of the CO (2-1) measurement is not different from the other measurements but this source is significantly closer to the galactic plane (latitude approximately 1 degree). The background subtraction is more problematic because of the interference from the interstellar CO gas (Sargent et al., 2013). The stellar velocity taken from the OH is at 51.2 km s-1(LSR) which overlaps with a region designated by Dame et al. (2001) as the Nuclear Disk, which may cause the stronger fluctuations in the baseline between -70 and +10 km s-1. This would also explain the fact that whereas the other stars have stronger CO (2-1) than (3-2) detection, we here detect only the 3-2 transition, which is less hampered by the ISM.
-
•
IRAS 17413-3531: No CO emission was detected. It is the bluest source in our sample with the 9.7 m band still partially in emission and has the lowest (Table 4). The CO emission may be too weak for a detection in our survey.
-
•
IRAS 17347-2319: Only a weak CO detection but the star has a very red SED with a high and a strong silicate absorption band at 9.7 m, indicating a high MLR. The star has only a relatively short period (355 days in vH2007 and 290 days in our analysis). This star will be further discussed in Section 6.5.
-
•
IRAS 17276-2846: This is one out of three sources in common with the sample studied by JEE15. They find a double-peaked SED for this source, where the ’blue’ peak below 2 m is believed to correspond to the stellar photosphere and the red part to the mass loss during the AGB. The star would have now ended the AGB phase and has become a so-called proto-planetary nebula. We do not follow this interpretation. Both the modelling of the SED and the CO line strengths point to a present high MLR. The IRS spectrum still shows a very strong 9.7 m absorption band, which would disappear rapidly after the mass loss has stopped (Justtanont et al., 1992). On the basis of the WISE data we also find that the star is variable with a large amplitude (W2 mag) and so likely still on the AGB. We believe that the ’blue’ counterpart is not associated with the OH/IR star, but a nearby confusing source and was thus not further considered for our analysis.
5 Comparison with JEE15 on L∗, and rgd
As described in Sections 4.1 and 4.2, the modelling of the observed SED and the CO measurements is a two-step process where first the infrared observations are fitted. The resulting dust MLR is used as an input to derive the gas-to-dust ratio, and hence the gas MLR and CO density leading to CO (2-1) and (3-2) transition line strengths. The MLRs ranging from 10-5 to 10-4 M⊙ are typically what is expected from OH/IR stars and are not extremely high as MLRs in excess of 10-4 M⊙ yr-1 have also been found (Justtanont et al., 2015). Comparison of MLRs with other studies needs to be done with care as different modelling methods and assumptions can lead to different estimates of the mass loss and gas-to-dust ratios. Also, in many studies the modelling is done on either only observed SEDs or have only CO measurements available. Here we compare our results with those of JEE15 on a larger sample of Bulge OH/IR stars.
The JEE15 modelling is restricted to the SED fitting, making use of the OH maser observations to have an estimate of the expansion velocity. They use the DUSTY radiative transfer code (Ivezić et al., 1999) to determine the luminosities and MLRs. We have three stars in common in our samples. For IRAS 17251–2821 they give a range of luminosity 3 100 - 7 200 L⊙ where we find 4 780 L⊙. The MLR ranges from 1.7 to 3.4 M⊙ yr-1 in JEE15 versus our slightly higher value of 4.8 M⊙ yr-1. For IRAS 17322–2424 we find a larger difference in the MLR: 4.2 vs. our 9.5 M⊙ yr-1 and comparable luminosities: 4 200 and 4 960 L⊙, respectively. JEE15 quote an uncertainty of a factor of 2 for the MLRs of the individual sources. For IRAS 17276–2846, the third source that is in common in our samples, they do not give model results, as they believe that the source has left the AGB (see Section 4.4).
To get a broader comparison with their results, we also compare their average values for their larger sample with ours. As mentioned in Section 2, JEE15 selected a sample which includes brighter IRAS sources than we have. They divide their sample into low- and high-luminosity groups, where their division lies at 7,000 L⊙. As our stars all belong to the first group, we will only compare with the average values for the MLRs of the so-called low-luminosity group. The thirteen ’low-luminosity’ sources in JEE15 have an average MLR of 2.7 M⊙ yr-1 with a standard deviation of 1.6 M⊙ yr-1 versus our M⊙ yr-1. JEE15 also used their DUSTY results to derive the gas-to-dust ratio, based on the SED fit and the expansion velocity, when known from the OH maser profile. This results in a value of r, which is considerably lower than the average value that we find of .
The differences in total MLRs and gas-to-dust ratios between JEE15 and ours may be explained by the different assumptions and inputs used in the modelling of the SED. JEE15 make use of optical constants for amorphous cold silicates from Ossenkopf et al. (1992) and the standard MRN Mathis et al. (1977) dust size distribution with , where is the number density and a is the size of the grains. The grain sizes were limited to 0.005 m. Our assumptions are described in Section 4.1. We make use of a combination of dust species and a single grain size, selecting the best fitting one from 0.1, 0.2 and 0.5 m respectively. Six out of eight sources gave a best fit with a grain size of 0.5 m, so larger than what was used in the JEE15 modelling.
To illustrate the impact of the assumed dust properties used, we redid the modelling of IRAS 17347–2319, using the silicates from Justtanont & Tielens (1992) with a grain size of 0.2 m and a specific density of 3.3 g cm-3. The resulting total M⊙ yr-1and a r are both a factor of approximately two lower than the values given in Table 5. JEE15 made a comparison of their gas-to-dust ratio with the modelling by Justtanont et al. (2006) of OH/IR stars in the Galactic Disk. They conclude that the Bulge OH/IR stars are on the low side in comparison to the values given by Justtanont et al. (2006) which range from 50 to 180. Assuming that the factor 2 difference in the gas-to-dust ratio for IRAS 17347–2319 that we find between our present modelling and the modelling using the input from Justtanont et al. (2006), applies to our entire sample, we find a similar range of rgd as what was found for the Disk stars.
6 The characteristics of the observed sample
In this Section, we will investigate what we can learn about important parameters for the understanding of the AGB evolution, taking advantage of having a group of stars at relatively well known distance and originating of the same stellar population. In the next Section we will then discuss what we can learn about this population of stars in the Bulge.
6.1 Luminosity and Period distribution
The luminosities obtained from the SED modelling range from approximately 4 000 tot 5 500 L⊙ and are on average 4729 521 L⊙, assuming that all sources are at the distance of the Galactic Centre, taken at 8 kpc.

The average luminosity of the sample agrees well with the peak in the luminosity distributions found by van der Veen & Habing (1990) (5 000-5 500 L⊙, for a distance of 8.05 kpc) and by JEE15 ( L⊙, for a distance of 8 kpc). Here we want to point out that the well known and best studied OH/IR stars often have luminosities well above 10 000 L⊙ (e.g. De Beck et al. (2010)), but that Habing (1988) in his analysis of the galactic distribution of IRAS sources with OH/IR-like colours found a luminosity distribution peaking at 5 000 L⊙. The Bulge OH/IR stars are thus not of exceptionally low luminosity.
The sample of OH/IR stars in JEE15 also contains stars with luminosities above 10 000 L⊙ (their so-called high-luminosity group). We do not have these because our selection of candidate OH/IR stars is based on the van der Veen & Habing (1990) sample as described in Section 2. In the latter analysis of the flux distribution of IRAS sources it is found that the stars with "apparant" luminosities above 10 000 L⊙ (F Jy) are likely stars from the Galactic Disk population. However, because of the lower number density, it could not be excluded that the Bulge also contained higher luminosity OH/IR stars. In our selection of stars to observe CO emission, we chose to select sources with the highest probability to be genuine Bulge stars and thus only selected stars with F Jy.
Most sources have periods in the range of 500 – 700 days. This distribution corresponds to the longest periods of the Bulge IRAS sources period distribution as determined by Whitelock et al. (1991). As the OH/IR sources are the most extreme AGB stars, this is no surprise. However, the periods are certainly not as extreme as several OH/IR stars in the Galactic Disk which have periods well above thousand days (e.g. van Langevelde et al. (1990)).
IRAS 17347–2319 has a clearly deviant period (P days) in comparison to the other OH/IR stars and will be discussed in the Section 6.5.
6.2 Period-Luminosity comparison
Figure 3 shows the position of our stars in the so-called period-luminosity (PL) diagram. The full line shows the period-luminosity relation as derived by Whitelock et al. (1991) based on LMC oxygen-rich Mira variables with P days (Feast et al., 1989) and Galactic Disk OH/IR stars with phase-lag distances (van Langevelde et al., 1990). This is the only PL relation that combines shorter period Miras with the longer period OH/IR stars that we are aware of. The distances towards the OH/IR stars in van Langevelde et al. (1990) were determined with the so-called phase-lag method and the overall uncertainty in is still between 0.5 and 1.0 mag. Clearly our OH/IR stars fall well below the relation as was also found for a sample of OH/IR stars in the Galactic Centre (Blommaert et al., 1998) and we refer to the discussion in that paper on the PL relation for OH/IR stars. It should be noted that using an extrapolation of the PL relation of the oxygen-rich Miras in the LMC (Feast et al., 1989) would only show an even larger deviation with our OH/IR stars than with the PL relation used in this analysis.
Rather than considering the OH/IR stars as an extension of the Miras towards higher masses, we believe that the OH/IR stars in this sample are to be seen as an extension of the Miras towards a further evolved phase, as will be discussed in the next session. The PL relation is also used to derive distances to the OH/IR stars, for instance in De Beck et al. (2010). Although usage of the PL relation is often the only way to get an estimate of the OH/IR star’s luminosity, our result shows that this can lead to significant and systematic overestimation of the luminosity.
6.3 Mass-loss rates versus Luminosity
Figure 4 shows the MLRs of our stars versus the luminosities. In this radiatively driven wind these quantities are not independent. The relation for the so-called classical limit, i.e. only allowing one single scattering event per photon (), is shown in the figure. van Loon et al. (1999) showed that for a sample of AGB stars in the LMC several sources surpassed this limit demonstrating that multiple scattering happens in dusty circumstellar envelopes (Gail & Sedlmayr, 1986). van Loon et al. (1999) suggested a new empirical upper limit which is also indicated in Figure 4. Clearly all our sources surpass the classical limit, and three even surpass the limit suggested by van Loon. The three sources with the highest MLRs also have the highest optical depths (Table 4), where multiple scattering is likely to become increasingly important. Whether or not our stars indeed surpass the empirical limit suggested by van Loon et al. (1999) is more difficult to answer, considering the uncertainties one needs to take into account when comparing MLRs derived from differerent methods (see Section 5). Lowering the MLRs by a factor of two would bring the highest MLRs just above the empirical relation given by van Loon et al. (1999). On the other hand, the number of sources with such high MLRs in their paper is small and the limit may be uncertain because of this. They also show that the optical depth by the circumstellar shell is related to the colour. Our sources have redder colours than the oxygen-rich stars in their sample and thus may indeed be more extreme than the sample of LMC stars studied by van Loon et al. (1999). This difference in optical depth may be related to the likely higher metallicity of the Bulge OH/IR stars in comparison to the LMC stars. And could indicate that difference in MLR observed is real and related to the different populations.

6.4 Mass-loss rates versus Period
A first condition to start an efficient dust-driven wind is the levitation of the gas, caused by large amplitude pulsations, to regions above the photosphere where grains can form. Earlier studies on the mass loss showed the dependency of MLRs and the pulsation period of the AGB star (Vassiliadis & Wood (1993) and references therein) Schöier & Olofsson (2001) and De Beck et al. (2010)). In agreement with Vassiliadis & Wood (1993), De Beck et al. (2010) find an exponentially increasing MLR with period, until a maximum level is reached where the MLR no longer increases. Vassiliadis & Wood (1993) see the leveling off occuring at a period of 500 days, whereas De Beck et al. (2010) find that the MLR remains constant from approximately 850 days onward (at , with in units of M⊙ yr-1). We will come back to the comparison with the Vassiliadis & Wood (1993) result in the next section. Applying the relation provided by De Beck et al. (2010) for periods shorter than 850 days:
| (5) |
gives MLRs significantly lower than our values by a factor ranging from 4 to 44 with a mean of 18 (we have excluded IRAS 17347-2319 because of its very short variability period, see Section 6.5). On the other hand, the scatter around the relation in De Beck et al. (2010) is quite large (up to a factor ten below and above the relation), so that our MLRs are not entirely inconsistent with the MLRs obtained in their analysis. We conclude however that the relation given in eqn. 5 for periods below 850 days, is not applicable to our stars, but that they have MLRs which agree with the ’plateau’ value of M⊙ yr-1, the region associated with the superwind by Vassiliadis & Wood (1993).

6.5 The deviant variability behaviour of IRAS 17347–2319
IRAS 17347–2319 is standing out in the P-L diagram because of its short period in respect to the other OH/IR stars. The average period of the other stars is 589 days, versus the adopted period of 323 we find for this star. The full amplitude in the K-band is small (0.48 and 0.52 according to vH2007 and our own analysis, respectively) only just sufficient to be classified as a Mira variable (full K mag, Feast et al. (1982)). Apart from the short period and small amplitude, this is also the only source which shows a deviating period between what is found by vH2007 and our own analysis (see Section 4.3). Where vH2007 finds a period of 355 days, we find consistently a period of 290 days from the VVV and WISE data. The data used in VH2007 was taken from mid-July 2004 until November 2006, whereas for the VVV and WISE survey we have data starting in April 2010 and ending in September 2013 for VVV and end of August 2015 for WISE respectively. A change in variability is noticed in about one percent of the Mira variables (Zijlstra & Bedding, 2002; Templeton et al., 2005). Zijlstra & Bedding (2002) define three classes: "continuous change", "sudden change" and "meandering change". In the first class, a continuous increase or decrease of the order of 15 % occurs over a period of 100 years, whereas for the second, such a change occurs ten times faster. In the third class, a change of about 10 % in the period duration is seen to happen over several decades, followed by a return to the original period. The rapid change by 18% in less than a decade would place IRAS 17347–2319 in the second class, which contains Mira variables like BH Cru, RU Vul and T Umi (Uttenthaler et al., 2011). The occurance of a thermal pulse, when a helium-burning shell takes over from the hydrogen-burning shell as the main energy source on the AGB, was suggested to explain the rapidly changing period (Wood & Zarro, 1981; Uttenthaler et al., 2011). This could occur either in the build-up towards or in the aftermath of the thermal pulse. The strongly changing radius and temperature of the star during such a thermal pulse will lead to a change in period (), luminosity and expansion velocity (Vassiliadis & Wood, 1993). An alternative explanation that has been suggested for a rapid decrease is a pulsation mode switch from the fundamental (assumed to be the case for Mira’s and OH/IR stars) to a low overtone mode (like in Semi Regular Variables) (Lebzelter & Wood, 2005).
Because of the large amplitude variability of this type of stars, it is not possible to find evidence of a changing average luminosity of IRAS 17347–2319 over the time for which we have photometry available. However, the star has the lowest luminosity in our sample and is about 20% lower than the average value of our sample. Also the expansion velocity significantly deviates from the average velocity found for the other stars: 9.0 vs 17.6 1.3 km s-1. If IRAS 17347–2319 is in a post-thermal pulse phase, one could also expect a decrease in the MLR to occur (Vassiliadis & Wood, 1993) as is also observed in R Hya, a Mira variable which has decreased its period from 500 to 385 days over a time period of about 300 years (Zijlstra & Bedding, 2002). Such a MLR change is not clear from our analysis. The SED shows a very strong obscuration in the visible and near-infrared wavelengths, together with a strong silicate absorption band indicating a high present dust MLR. In the case of a rapidly decreasing MLR, the stellar source would re-appear rapidly and the silicate band would go into emission (Justtanont et al., 1992). We have much less information for IRAS 17347–2319 than for BH Cru, RU Vul and T Umi, which have been monitored for decades, to confirm that it is undergoing a ’sudden change’ in variabilty. Further follow-up of the variability and its SED would be highly desirable as this may be the first OH/IR type for which such a behaviour has been observed.
7 the Bulge OH/IR population
Generally OH/IR stars are associated with stars of a few solar masses. Typical such examples are stars like OH26.50.6 which are very bright and have been studied in considerable detail (e.g., Justtanont et al., 2006; Justtanont et al., 2015; Groenewegen, 2012). However, the OH/IR stars in our sample show much lower luminosities, typically in the range of 2000 - 7000 and periods below 700 days, whereas the more luminous OH/IR stars reach periods well above a thousand days and luminosities of several tens of thousands times the luminosity of the Sun. In contrast to a number of extreme OH/IR stars, which are associated with active star-forming regions in the galactic plane like the Molecular Ring, the OH/IR stars in the Bulge likely evolved from lower initial masses and are older, but still of intermediate age (1–3 Gyr). To investigate this claim we will now make a comparison with the Vassiliadis & Wood (1993) (hereafter VW93) evolutionary tracks.

7.1 Comparison with VW93
Groenewegen & Blommaert (2005) studied the Galactic Bulge Mira variables on basis of the OGLE-II survey and near-infrared photometry from the DENIS and 2MASS all-sky databases. They show that the period distribution for stars within latitudes ranging from -1.2∘ to -5.8∘ are indistinguishable and can be explained by a population with initial masses of 1.5 - 2 M⊙, corresponding to ages of 1 to 3 Gyr. This result was based on synthetic AGB evolutionary models where the synthetic AGB code of Wagenhuber & Groenewegen (1998) was fine-tuned to reproduce the models of VW93. VW93 provide calculations for a range of metallicities, where Groenewegen & Blommaert (2005) selected the Z = 0.016 model, for a solar mix. Studies of the metallicity of non-variable M giant stars in the Bulge give a slightly sub-solar value (Rich & Origlia, 2005; Rich et al., 2007, 2012). The same metallicity was found for a sample of variable AGB stars in the Bulge by Uttenthaler et al. (2015). There are no direct measurements of the metallicities of the OH/IR stars, but assuming that they originate from the same population as the Bulge M giants and AGB stars, the solar mix is indeed the most appropriate. The other values included in the VW93 models: Z = 0.008, 0.004 and 0.001, correspond to the LMC, SMC and lower metallicity populations.
According to VW93 models, the maximum at the Thermal Pulsing AGB during H-burning are , , mag for stars with solar metallicity and initial masses of 1.0, 1.5 and 2.0 M⊙ respectively. The model for the 1.5 M⊙ agrees closely to the Bulge OH/IR stars luminosity (Section 6.1). In Figure 6 we show the VW93 track (dashed line) for a star with M and solar abundance in the PL diagram. The track covers the three last thermal pulse cycles before terminating the AGB (with a duration years). We only include the part of track where the luminosity is produced by hydrogen burning, excluding the thermal pulses. Also shown are the Miras used in the Groenewegen & Blommaert (2005) analysis and our OH/IR stars. The large spread in the Miras can be explained by a larger spread in distance (including fore- and background sources) and the single-epoch K band photometry which was not corrected for variability. The bolometric magnitudes for the Mira stars were determined using relation B of Kerschbaum et al. (2010). The track follows the PL relation for a large fraction where we also find the Mira stars. However, due to the changing mass, when the stars enter the so-called superwind phase, the period () keeps increasing while the luminosity (related to the core mass) stays almost constant. The track then overlaps with the position of the OH/IR stars in our sample.
Assuming that a star with still needs to lose approximately 1 of material in its final phase before ending as a white dwarf of about 0.5 means that on average this OH/IR phase will last 20,000 years. VW93 model predicts 98,000 yrs duration of the superwind. The longer duration predicted by VW93 is possibly connected to the single scattering ’classical limit’ they impose on the superwind MLR. As was discussed in Section 5, the MLRs we find surpass the classical limit by at least a factor of two. VW93 predicts a ratio of the optical visible thermal pulsing AGB over the superwind phase of 0.135. Blommaert (1992) compared the numbers of IRAS sources with optical Miras in the Bulge. For the sources with OH/IR like colours the ratio is 0.02, significantly lower than predicted in VW93, but in agreement with the shorter superwind duration of 20,000 years.
In Figure 6 it can also be seen that the VW tracks allow longer periods (even above thousand days) than what we find in our sample. This is however, only true for a short phase near the end of the AGB, which is even more reduced in time when allowing higher MLRs, as we find is the case for the OH/IR stars.
7.1.1 Link between OH/IR stars and Miras in the Bulge
Further evidence for the connection between the Mira variables and the OH/IR stars is found in their distribution in the Bulge. Whitelock & Catchpole (1992); Groenewegen & Blommaert (2005) find that Mira stars follow a ”Bar” structure with a viewing angle of approximately 4. Based on a dynamical modelling, Sevenster et al. (1999) find that the OH/IR stars in the inner Galaxy are members of the Galactic Bar with a viewing angle of 43∘ agreeing with the distribution of the Mira stars.
Recently, Habing (2016) suggested that the galactic bar OH/IR stars are formed in the Molecular Ring, an active star forming region at 4 kpc from the galactic centre (l = ) which connects to the end of the galactic bar (Blommaert et al., 1994; Hammersley et al., 1994). The stellar kinematics of the stars at the tips of the bar are equal to those of the star-forming regions at these locations, indicating that stars formed in the molecular ring can easily become part of the galactic bar structure. Such a scenario agrees with the fact that we find stars of intermediate age and with the fact that gas-to-dust ratios of our OH/IR stars show the same range as was found by Justtanont et al. (2006) for a sample of OH/IR stars, situated predominately in the Molecular Ring. The gas-to-dust ratio is believed to be inversely related to the metallicity of the stars (Habing et al., 1994), so that we conclude that the metallicities of the Bulge OH/IR stars are similar to the selection of OH/IR stars in the Disk studied by Justtanont et al. (2006).
One final remark about the ages of the AGB stars in the Bulge. In the last decades, there was often much debate on how the Bulge could contain AGB stars like Miras and OH/IR stars of intermediate age in a galactic component which is believed to contain only an old stellar population (Renzini, 1994; Kuijken & Rich, 2002; Zoccali et al., 2003). This led to suggestions that the Mira population was the result of merged binaries (descendents of blue straglers, Renzini & Greggio (1990)). In the last decade there has however been growing evidence that at least a (small) fraction of the Bulge stars is of intermediate age as was shown by Gesicki et al. (2014) on basis of planetary nebula, by Bensby et al. (2013) for metal-rich dwarf stars. The appearance of Miras and OH/IR stars in the Bulge is not so controversial in view of these recent results.
7.1.2 Lack of carbon-rich stars in the Galactic Bulge
Finally we return to the fact that JEE15 also have higher luminosity () OH/IR stars in their Bulge sample. As stated in Section 2 we have not selected such stars for our sample as their ’true’ Bulge membership is uncertain. van der Veen & Habing (1990) in their analysis of the luminosty distribution of IRAS stars with OH/IR colours assume that all stars with IRAS Jy are disk stars. They cannot exclude that OH/IR stars with luminosities above 10 000 exist, but that these form at most 2% of the population. JEE15’s analysis of the high-luminosity group, comparing the luminosities with predictions from stellar evolution models, shows that these stars have evolved from stars with . JEE15 indicate that the lack of carbon stars in the Bulge region ((Blanco & Terndrup, 1989)) or very low number as indicated in the recent paper by Matsunaga et al. (2017), imposes problems with the stellar evolution models. Stars with initial masses above 4 can remain oxygen-rich because of hot-bottom burning (HBB), but stars in the mass range between 2 and 4 are expected to convert to C stars because of the third dredge-up when carbon is brought from the nuclear burning region up to the photosphere via convection (Marigo & Girardi (2007); Karakas & Lattanzio (2014)). If the mass range of AGB stars in the Bulge is indeed limited to less than 2 , it would solve the problem of non-occurance of C stars in the Bulge region. We repeat that Groenewegen & Blommaert (2005) do not find evidence of stars with in fields with galactic latitudes above 1.2 degrees. The comparison field at indicated the presence of a younger population with and ages below 1 Gyr. This field is however much closer the Galactic Centre and in a region called the Nuclear Bulge, which is believed to be still active in star formation (Launhardt et al., 2002).
8 The duration of the superwind
Our combined SED and CO modelling does not impose any limit on the duration of the superwind (Section 4.2). The outer radius of the CO shell is taken at 1.5 times the radius of the CO photodissociation through interstellar UV radiation field. This is in contrast to what is found for other OH/IR stars like OH 26.50.6 where the MLR derived from fitting the SED and solving the dynamical equation of the dust driven wind give a high MLR which overestimated the observed low-J CO lines by an order of magnitude. A way to reconcile the derived dynamical MLR and CO observations is that the current MLR (measured by the warm dust) is higher than in the past (as seen in J=2-1 CO line). High-J CO lines observed with Herschel are consistent with a sudden increase in MLR in the past couple of hundred years (Justtanont et al., 2013). This result, based on CO observations, is confirmed by an independent study of the fortserite dust 69 m band of which the shape and peak wavelength are very temperature sensitive (Koike et al., 2003; Suto et al., 2006). de Vries et al. (2014) studied a sample of extreme OH/IR stars, including OH 26.50.6 and confirms the short duration of the superwind of less than a thousand years. As is stated in de Vries et al. (2014), such a short duration is problematic as the stars cannot lose sufficient mass, for instance in the case of a star like OH 26.50.6 this would be a couple of solar masses. The superwind would need to be followed by a phase of even higher MLRs (de Vries et al., 2015). An alternative scenario would be one where several phases of a few hundred years occur in which the MLR increases to values above 10-5 M⊙ yr-1. Such a timescale hints to a connection to the thermal pulse, which is the only event on the AGB with such a duration. The so-called ’detached shells’ around carbon stars are believed to be the result of interaction of a high and faster moving wind (10-5 M⊙ yr-1) with a slower one with a 2 orders of magnitude lower MLR (Olofsson et al., 2000; Schöier et al., 2005). Strangely, no oxygen-rich AGB stars are known with detached shells although it is expected that thermal pulses would increase the MLR in a similar way.
An alternative explanation for the above described CO lines’ behaviour could be a higher impact of the interstellar UV radiation than is assumed in the radiative-transfer modelling (see Section 4.2). The outer radius of the CO gas is determined by the photodissociation and is based on the work by Mamon et al. (1988). If the interstellar radiation field is underestimated in the modelling, the outer radii of the gas will be smaller, increasingly so for lower J-transitions, as is observed in the case of OH26.50.6. This interpretation may also explain why we do not need to limit the CO outer radii for our Bulge OH/IR stars. Recent work by Groenewegen (2017) demonstrate the effect of the ISRF and show that on average a factor of 15 increase in the ISRF will lead to a three times smaller photodissociation radius. It can be expected that at high latitudes in the Galactic Bulge, where our OH/IR stars are situated, the UV radiation field is much weaker than compared to active star forming regions where higher mass stars like OH 26.50.6 are situated. Clearly this alternative interpretation does not explain the spatial distribution of the forsterite dust (de Vries et al., 2014).
9 Conclusions
We have presented the succesful detection of the CO (3-2) and (2-1) transition lines for a sample of OH/IR stars in the Bulge. On basis of our modelling of the observed SED and CO lines, we find that the stars have an average luminosity of 4729 521 L⊙ and the average MLR is M⊙ yr-1. Such MLR is well above the classical limit, with a single scattering event per photon, for the luminosities in our sample. The variability periods of our OH/IR stars are below 700 days and do not follow the Mira-OH/IR PL relation (Whitelock et al., 1991). This result shows that usage of the PL relation for the OH/IR stars can lead to significant errors in the luminosity determination. In comparison with the VW93 evolutionary tracks, we find that the stars have initial masses of approximately 1.5 M⊙, which corresponds well with the findings of Groenewegen & Blommaert (2005) for the Bulge Mira variables, confirming the connection between the two groups of stars. If more massive OH/IR stars are rare in the Bulge this may explain the scarcity of Bulge carbon stars. We find that the gas-to-dust ratio ranges between 100 and 400 and is similar to what is found for galactic disk OH/IR stars. Contrary to findings of bright OH/IR stars in the Disk, our modelling does not impose a limit to the duration of the superwind below a thousand years. IRAS 17347–2319 has a short period of about 300 days which may be further decreasing. Rapid changes in the variability behaviour have been observed for Miras and may be connected to the occurance of a thermal pulse. It would be the first time that such behaviour is observed in an OH/IR star.
Acknowledgements
Based on observations with the Atacama Pathfinder EXperiment (APEX) telescope (Programmes 088.F-9315(A) and 090.F-9310(A)). APEX is a collaboration between the Max Planck Institute for Radio Astronomy, the European Southern Observatory, and the Onsala Space Observatory. This research has made use of the VizieR catalogue access tool, CDS, Strasbourg, France. The original description of the VizieR service was published in A&AS 143, 23. This publication makes use of data products from the Wide-field Infrared Survey Explorer, which is a joint project of the University of California, Los Angeles, and the Jet Propulsion Laboratory/California Institute of Technology, funded by the National Aeronautics and Space Administration. KJ acknowledges the support from the Swedish Nation Space Board. LD acknowledges support from the ERC consolidator grant 646758 AEROSOL. We thank the referee for a careful review of our manuscript which improved the quality of this paper.
References
- Baud & Habing (1983) Baud B., Habing H. J., 1983, A&A, 127, 73
- Baud et al. (1981) Baud B., Habing H. J., Matthews H. E., Winnberg A., 1981, A&A, 95, 156
- Bedijn (1987) Bedijn P. J., 1987, A&A, 186, 136
- Begemann et al. (1997) Begemann B., Dorschner J., Henning T., Mutschke H., Guertler J., Koempe C., Nass R., 1997, ApJ, 476, 199
- Belitsky et al. (2006) Belitsky V., et al., 2006, in Society of Photo-Optical Instrumentation Engineers (SPIE) Conference Series. p. 62750G, doi:10.1117/12.671383
- Bensby et al. (2013) Bensby T., et al., 2013, A&A, 549, A147
- Blanco & Terndrup (1989) Blanco V. M., Terndrup D. M., 1989, AJ, 98, 843
- Blommaert (1992) Blommaert J. A. D. L., 1992, PhD thesis, , Leiden University, the Netherlands (Bl92), (1992)
- Blommaert et al. (1994) Blommaert J. A. D. L., van Langevelde H. J., Michiels W. F. P., 1994, A&A, 287, 479
- Blommaert et al. (1998) Blommaert J. A. D. L., van der Veen W. E. C. J., van Langevelde H. J., Habing H. J., Sjouwerman L. O., 1998, A&A, 329, 991
- Blommaert et al. (2007) Blommaert J. A. D. L., et al., 2007, in Kerschbaum F., Charbonnel C., Wing R. F., eds, Astronomical Society of the Pacific Conference Series Vol. 378, Why Galaxies Care About AGB Stars: Their Importance as Actors and Probes. p. 164
- Cutri & et al. (2014) Cutri R. M., et al. 2014, VizieR Online Data Catalog, 2328
- Dame et al. (2001) Dame T. M., Hartmann D., Thaddeus P., 2001, ApJ, 547, 792
- David et al. (1993) David P., Le Squeren A. M., Sivagnanam P., 1993, A&A, 277, 453
- De Beck et al. (2010) De Beck E., Decin L., de Koter A., Justtanont K., Verhoelst T., Kemper F., Menten K. M., 2010, A&A, 523, A18
- Dorschner et al. (1995) Dorschner J., Begemann B., Henning T., Jaeger C., Mutschke H., 1995, A&A, 300, 503
- Engels & Bunzel (2015) Engels D., Bunzel F., 2015, A&A, 582, A68
- Feast et al. (1982) Feast M. W., Robertson B. S. C., Catchpole R. M., Evans T. L., Glass I. S., Carter B. S., 1982, MNRAS, 201, 439
- Feast et al. (1989) Feast M. W., Glass I. S., Whitelock P. A., Catchpole R. M., 1989, MNRAS, 241, 375
- Gail & Sedlmayr (1986) Gail H.-P., Sedlmayr E., 1986, A&A, 161, 201
- Genzel et al. (2010) Genzel R., Eisenhauer F., Gillessen S., 2010, Reviews of Modern Physics, 82, 3121
- Gesicki et al. (2014) Gesicki K., Zijlstra A. A., Hajduk M., Szyszka C., 2014, A&A, 566, A48
- Goldreich & Scoville (1976) Goldreich P., Scoville N., 1976, ApJ, 205, 144
- Golriz et al. (2014) Golriz S. S., et al., 2014, MNRAS, 443, 3402
- Groenewegen (2012) Groenewegen M. A. T., 2012, A&A, 543, A36
- Groenewegen (2017) Groenewegen M. A. T., 2017, A&A, 606, A67
- Groenewegen & Blommaert (2005) Groenewegen M. A. T., Blommaert J. A. D. L., 2005, A&A, 443, 143
- Groenewegen et al. (1998) Groenewegen M. A. T., Whitelock P. A., Smith C. H., Kerschbaum F., 1998, MNRAS, 293, 18
- Gustafsson et al. (2008) Gustafsson B., Edvardsson B., Eriksson K., Jørgensen U. G., Nordlund Å., Plez B., 2008, A&A, 486, 951
- Güsten et al. (2006) Güsten R., Nyman L. Å., Schilke P., Menten K., Cesarsky C., Booth R., 2006, A&A, 454, L13
- Habing (1988) Habing H. J., 1988, A&A, 200, 40
- Habing (1996) Habing H. J., 1996, A&ARv, 7, 97
- Habing (2016) Habing H. J., 2016, A&A, 587, A140
- Habing et al. (1994) Habing H. J., Tignon J., Tielens A. G. G. M., 1994, A&A, 286, 523
- Hammersley et al. (1994) Hammersley P. L., Garzon F., Mahoney T., Calbet X., 1994, MNRAS, 269, 753
- Iben (1975) Iben Jr. I., 1975, ApJ, 196, 525
- Ivezić et al. (1999) Ivezić Ž., Nenkova M., Elitzur M., 1999, DUSTY: Radiation transport in a dusty environment, Astrophysics Source Code Library (ascl:9911.001)
- Jiménez-Esteban & Engels (2015) Jiménez-Esteban F. M., Engels D., 2015, A&A, 579, A76
- Justtanont & Tielens (1992) Justtanont K., Tielens A. G. G. M., 1992, ApJ, 389, 400
- Justtanont et al. (1992) Justtanont K., Barlow M. J., Skinner C. J., Tielens A. G. G. M., 1992, ApJ, 392, L75
- Justtanont et al. (1996) Justtanont K., Skinner C. J., Tielens A. G. G. M., Meixner M., Baas F., 1996, ApJ, 456, 337
- Justtanont et al. (2004) Justtanont K., de Jong T., Tielens A. G. G. M., Feuchtgruber H., Waters L. B. F. M., 2004, A&A, 417, 625
- Justtanont et al. (2006) Justtanont K., Olofsson G., Dijkstra C., Meyer A. W., 2006, A&A, 450, 1051
- Justtanont et al. (2013) Justtanont K., Teyssier D., Barlow M. J., Matsuura M., Swinyard B., Waters L. B. F. M., Yates J., 2013, A&A, 556, A101
- Justtanont et al. (2015) Justtanont K., et al., 2015, A&A, 578, A115
- Karakas & Lattanzio (2014) Karakas A. I., Lattanzio J. C., 2014, Publ. Astron. Soc. Australia, 31, e030
- Kerschbaum et al. (2010) Kerschbaum F., Lebzelter T., Mekul L., 2010, A&A, 524, A87
- Klein et al. (2012) Klein B., Hochgürtel S., Krämer I., Bell A., Meyer K., Güsten R., 2012, A&A, 542, L3
- Koike et al. (2003) Koike C., Chihara H., Tsuchiyama A., Suto H., Sogawa H., Okuda H., 2003, A&A, 399, 1101
- Kuijken & Rich (2002) Kuijken K., Rich R. M., 2002, AJ, 124, 2054
- Launhardt et al. (2002) Launhardt R., Zylka R., Mezger P. G., 2002, A&A, 384, 112
- Lebzelter & Wood (2005) Lebzelter T., Wood P. R., 2005, A&A, 441, 1117
- Lenz & Breger (2005) Lenz P., Breger M., 2005, Communications in Asteroseismology, 146, 53
- Mainzer et al. (2014) Mainzer A., et al., 2014, ApJ, 792, 30
- Mamon et al. (1988) Mamon G. A., Glassgold A. E., Huggins P. J., 1988, ApJ, 328, 797
- Marigo & Girardi (2007) Marigo P., Girardi L., 2007, A&A, 469, 239
- Marigo et al. (2013) Marigo P., Bressan A., Nanni A., Girardi L., Pumo M. L., 2013, MNRAS, 434, 488
- Mathis et al. (1977) Mathis J. S., Rumpl W., Nordsieck K. H., 1977, ApJ, 217, 425
- Matsunaga et al. (2017) Matsunaga N., Menzies J. W., Feast M. W., Whitelock P. A., Onozato H., Barway S., Aydi E., 2017, MNRAS, 469, 4949
- McGregor (1994) McGregor P. J., 1994, PASP, 106, 508
- Min et al. (2003) Min M., Hovenier J. W., de Koter A., 2003, Electromagnetic and Light Scattering - Theory and Applications VII, pp 230–233
- Min et al. (2007) Min M., Waters L. B. F. M., de Koter A., Hovenier J. W., Keller L. P., Markwick-Kemper F., 2007, A&A, 462, 667
- Minniti et al. (2010) Minniti D., et al., 2010, New Astron., 15, 433
- Norris et al. (2012) Norris B. R. M., et al., 2012, Nature, 484, 220
- Ochsenbein et al. (2000) Ochsenbein F., Bauer P., Marcout J., 2000, A&AS, 143, 23
- Ohnaka et al. (2016) Ohnaka K., Weigelt G., Hofmann K.-H., 2016, A&A, 589, A91
- Olofsson (2003) Olofsson H., 2003, in Habing H. J., Olofsson H., eds, Asymptotic giant branch stars, by Harm J. Habing and Hans Olofsson. Astronomy and astrophysics library, New York, Berlin: Springer, 2003, p. 325. p. 325
- Olofsson et al. (2000) Olofsson H., Bergman P., Lucas R., Eriksson K., Gustafsson B., Bieging J. H., 2000, A&A, 353, 583
- Omont et al. (2003) Omont A., et al., 2003, A&A, 403, 975
- Ossenkopf et al. (1992) Ossenkopf V., Henning T., Mathis J. S., 1992, A&A, 261, 567
- Pilbratt et al. (2010) Pilbratt G. L., et al., 2010, A&A, 518, L1
- Poglitsch et al. (2010) Poglitsch A., et al., 2010, A&A, 518, L2
- Pollack et al. (1994) Pollack J. B., Hollenbach D., Beckwith S., Simonelli D. P., Roush T., Fong W., 1994, ApJ, 421, 615
- Ramstedt et al. (2008) Ramstedt S., Schöier F. L., Olofsson H., Lundgren A. A., 2008, A&A, 487, 645
- Reimers (1975) Reimers D., 1975, Circumstellar envelopes and mass loss of red giant stars. pp 229–256
- Renzini (1981) Renzini A., 1981, in Iben Jr. I., Renzini A., eds, Astrophysics and Space Science Library Vol. 88, Physical Processes in Red Giants. pp 431–446, doi:10.1007/978-94-009-8492-9_48
- Renzini (1994) Renzini A., 1994, A&A, 285
- Renzini & Greggio (1990) Renzini A., Greggio L., 1990, in Jarvis B. J., Terndrup D. M., eds, European Southern Observatory Conference and Workshop Proceedings Vol. 35, European Southern Observatory Conference and Workshop Proceedings. pp 47–63
- Rich & Origlia (2005) Rich R. M., Origlia L., 2005, ApJ, 634, 1293
- Rich et al. (2007) Rich R. M., Origlia L., Valenti E., 2007, ApJ, 665, L119
- Rich et al. (2012) Rich R. M., Origlia L., Valenti E., 2012, ApJ, 746, 59
- Sargent et al. (2013) Sargent B. A., Patel N. A., Meixner M., Otsuka M., Riebel D., Srinivasan S., 2013, ApJ, 765, 20
- Schoenberg & Hempe (1986) Schoenberg K., Hempe K., 1986, A&A, 163, 151
- Schöier & Olofsson (2001) Schöier F. L., Olofsson H., 2001, A&A, 368, 969
- Schöier et al. (2005) Schöier F. L., Lindqvist M., Olofsson H., 2005, A&A, 436, 633
- Scicluna et al. (2015) Scicluna P., Siebenmorgen R., Wesson R., Blommaert J. A. D. L., Kasper M., Voshchinnikov N. V., Wolf S., 2015, A&A, 584, L10
- Sevenster et al. (1997) Sevenster M. N., Chapman J. M., Habing H. J., Killeen N. E. B., Lindqvist M., 1997, A&AS, 124, 509
- Sevenster et al. (1999) Sevenster M., Saha P., Valls-Gabaud D., Fux R., 1999, MNRAS, 307, 584
- Suto et al. (2006) Suto H., et al., 2006, MNRAS, 370, 1599
- Templeton et al. (2005) Templeton M. R., Mattei J. A., Willson L. A., 2005, AJ, 130, 776
- Uttenthaler et al. (2011) Uttenthaler S., et al., 2011, A&A, 531, A88
- Uttenthaler et al. (2015) Uttenthaler S., Blommaert J. A. D. L., Wood P. R., Lebzelter T., Aringer B., Schultheis M., Ryde N., 2015, MNRAS, 451, 1750
- Vanhollebeke (2007) Vanhollebeke E., 2007, PhD thesis, Institute of Astronomy, Katholieke Universiteit Leuven, Belgium
- Vanhollebeke et al. (2009) Vanhollebeke E., Groenewegen M. A. T., Girardi L., 2009, A&A, 498, 95
- Vassilev et al. (2008) Vassilev V., et al., 2008, A&A, 490, 1157
- Vassiliadis & Wood (1993) Vassiliadis E., Wood P. R., 1993, ApJ, 413, 641
- Wagenhuber & Groenewegen (1998) Wagenhuber J., Groenewegen M. A. T., 1998, A&A, 340, 183
- Whitelock & Catchpole (1992) Whitelock P. A., Catchpole R., 1992, in Barbuy B., Renzini A., eds, IAU Symposium Vol. 149, The Stellar Populations of Galaxies. p. 503
- Whitelock et al. (1991) Whitelock P., Feast M., Catchpole R., 1991, MNRAS, 248, 276
- Winnberg et al. (2009) Winnberg A., Deguchi S., Reid M. J., Nakashima J., Olofsson H., Habing H. J., 2009, A&A, 497, 177
- Wood & Zarro (1981) Wood P. R., Zarro D. M., 1981, ApJ, 247, 247
- Yang et al. (2010) Yang B., Stancil P. C., Balakrishnan N., Forrey R. C., 2010, ApJ, 718, 1062
- Zijlstra & Bedding (2002) Zijlstra A. A., Bedding T. R., 2002, Journal of the American Association of Variable Star Observers (JAAVSO), 31, 2
- Zoccali et al. (2003) Zoccali M., et al., 2003, A&A, 399, 931
- de Grijs & Bono (2016) de Grijs R., Bono G., 2016, ApJS, 227, 5
- de Vries et al. (2014) de Vries B. L., Blommaert J. A. D. L., Waters L. B. F. M., Waelkens C., Min M., Lombaert R., Van Winckel H., 2014, A&A, 561, A75
- de Vries et al. (2015) de Vries B. L., Maaskant K. M., Min M., Lombaert R., Waters L. B. F. M., Blommaert J. A. D. L., 2015, A&A, 576, A98
- te Lintel Hekkert et al. (1991) te Lintel Hekkert P., Caswell J. L., Habing H. J., Haynes R. F., Haynes R. F., Norris R. P., 1991, A&AS, 90, 327
- van Langevelde et al. (1990) van Langevelde H. J., van der Heiden R., van Schooneveld C., 1990, A&A, 239, 193
- van Loon et al. (1999) van Loon J. T., Groenewegen M. A. T., de Koter A., Trams N. R., Waters L. B. F. M., Zijlstra A. A., Whitelock P. A., Loup C., 1999, A&A, 351, 559
- van Loon et al. (2003) van Loon J. T., et al., 2003, MNRAS, 338, 857
- van der Veen & Habing (1990) van der Veen W. E. C. J., Habing H. J., 1990, A&A, 231, 404
- van der Veen & Olofsson (1990) van der Veen W., Olofsson H., 1990, in Mennessier M. O., Omont A., eds, From Miras to Planetary Nebulae: Which Path for Stellar Evolution?. pp 139–157