Probing Radio Intensity at high-Z from Marion: 2017 Instrument
Abstract
We introduce Probing Radio Intensity at high-Z from Marion (PRIZM), a new experiment designed to measure the globally averaged sky brightness, including the expected redshifted 21 cm neutral hydrogen absorption feature arising from the formation of the first stars. PRIZM consists of two dual-polarization antennas operating at central frequencies of 70 and 100 MHz, and the experiment is located on Marion Island in the sub-Antarctic. We describe the initial design and configuration of the PRIZM instrument that was installed in 2017, and we present preliminary data that demonstrate that Marion Island offers an exceptionally clean observing environment, with essentially no visible contamination within the FM band.
keywords:
cosmology: observations — dark ages, reionization, first stars — instrumentation: polarimeters; ; ;
1 Introduction
The 21-cm line of neutral hydrogen provides one of the best ways to search for cosmic dawn, the epoch of the first luminous objects (Furlanetto et al., 2006; Pritchard & Loeb, 2012). Cosmic dawn is expected to have imprinted a characteristic absorption feature in the intensity spectrum of the globally (all-sky) averaged brightness, with a typical amplitude of mK. This feature contains a wealth of information about these first objects (e.g. Cohen et al. (2017)). The recent report of a 500 mK deep absorption feature centered at 78 MHz (Bowman et al., 2018) substantially exceeds the expected amplitude. If confirmed, this strong absorption may require physical processes well beyond those included in previous models, including early dark matter interactions (Barkana, 2018) and extra radiation at low frequencies (Pospelov et al., 2018; Dowell & Taylor, 2018).
The detection of the cosmic dawn absorption feature is made challenging by bright astrophysical foregrounds, ionospheric fluctuations, radio-frequency interference (RFI), and instrumental systematic errors. The Milky Way is – times brighter than the expected cosmological signal within the frequency range of 70–100 MHz. Hence, systematic errors arising from factors like imperfect Galaxy modelling or frequency structure in the instrument response can mimic the cosmic dawn signal. The ionosphere is time-varying and both absorbs and refracts at these frequencies, thus introducing additional measurement noise and uncertainty. Furthermore, time-invariant broadband RFI is indistinguishable from a cosmic dawn signal, pushing experiments to some of the most remote locations on Earth. Interference from FM radio lies in a frequency range of 88–105 MHz and extends hundreds of kilometers from the source stations, presenting a serious challenge for global signal observations (Voytek et al., 2014; Monsalve et al., 2017). Because of the measurement difficulty from most continental sites, there have been some proposals to go to the far side of the moon (e.g. DARE, Burns et al. (2017, 2012)).
Here we describe Probing Radio Intensity at high-Z from Marion (PRIZM), a new experiment that is designed to search for the cosmic dawn absorption feature in globally averaged redshifted 21-cm emission. PRIZM joins several other past and current global signal experiments, including the Experiment to Detect the Global EoR Signature (EDGES, Monsalve et al., 2017; Mozdzen et al., 2017), the Large-aperture Experiment to detect the Dark Age (LEDA, Price et al., 2017; Bernardi et al., 2015), Shaped Antenna measurement of background Radio Spectrum (SARAS, Singh et al., 2017; Patra et al., 2013), Broadband Instrument for Global Hydrogen Reionisation Signal (BIGHORNS, Sokolowski et al., 2015), and Sonda Cosmológica de las Islas para la Detección de Hidrógeno Neutro (SCI-HI, Voytek et al., 2014). PRIZM is set apart by its location on Marion Island, which, at 2000 km from the nearest permanent inhabitants, is one of the most remote locations on Earth, allowing RFI-free access to the full frequency range of the global signal.
2 Instrument overview
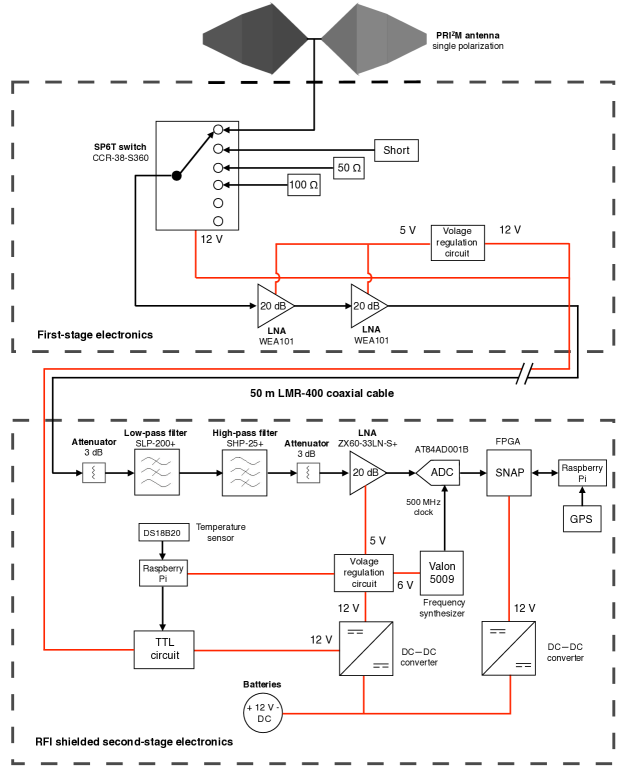
The PRIZM experiment comprises two dual-polarization radiometers operating at center frequencies of 70 and 100 MHz; the combined frequency coverage of the two radiometers spans 30–200 MHz. Figure 1 shows a block diagram of the PRIZM signal chain for a single polarization.
2.1 Antenna
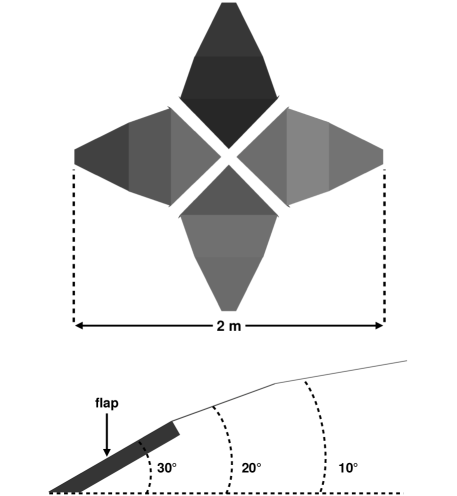
The PRIZM radiometers use the HIBiscus four-square antenna design (Jáuregui–García et al., 2017) that was originally developed for the SCI-HI experiment. As shown in Figure 2, each antenna consists of four petals that form a pair of tightly-coupled crossed dipoles. Each petal has three angled trapezoidal facets and is made of aluminum with black powder coating, which absorbs optical and infrared solar radiation, increasing sublimation of snow and ice. The 70 MHz and 100 MHz antenna assemblies are roughly 3 m and 2 m on a side, respectively. The physical scales yield optimized performances in frequency ranges of 50–90 MHz for the 70 MHz antenna and 70–130 MHz for the 100-MHz antenna. The antennas are stationary and point at zenith, and the polarization axes are aligned with the cardinal directions.
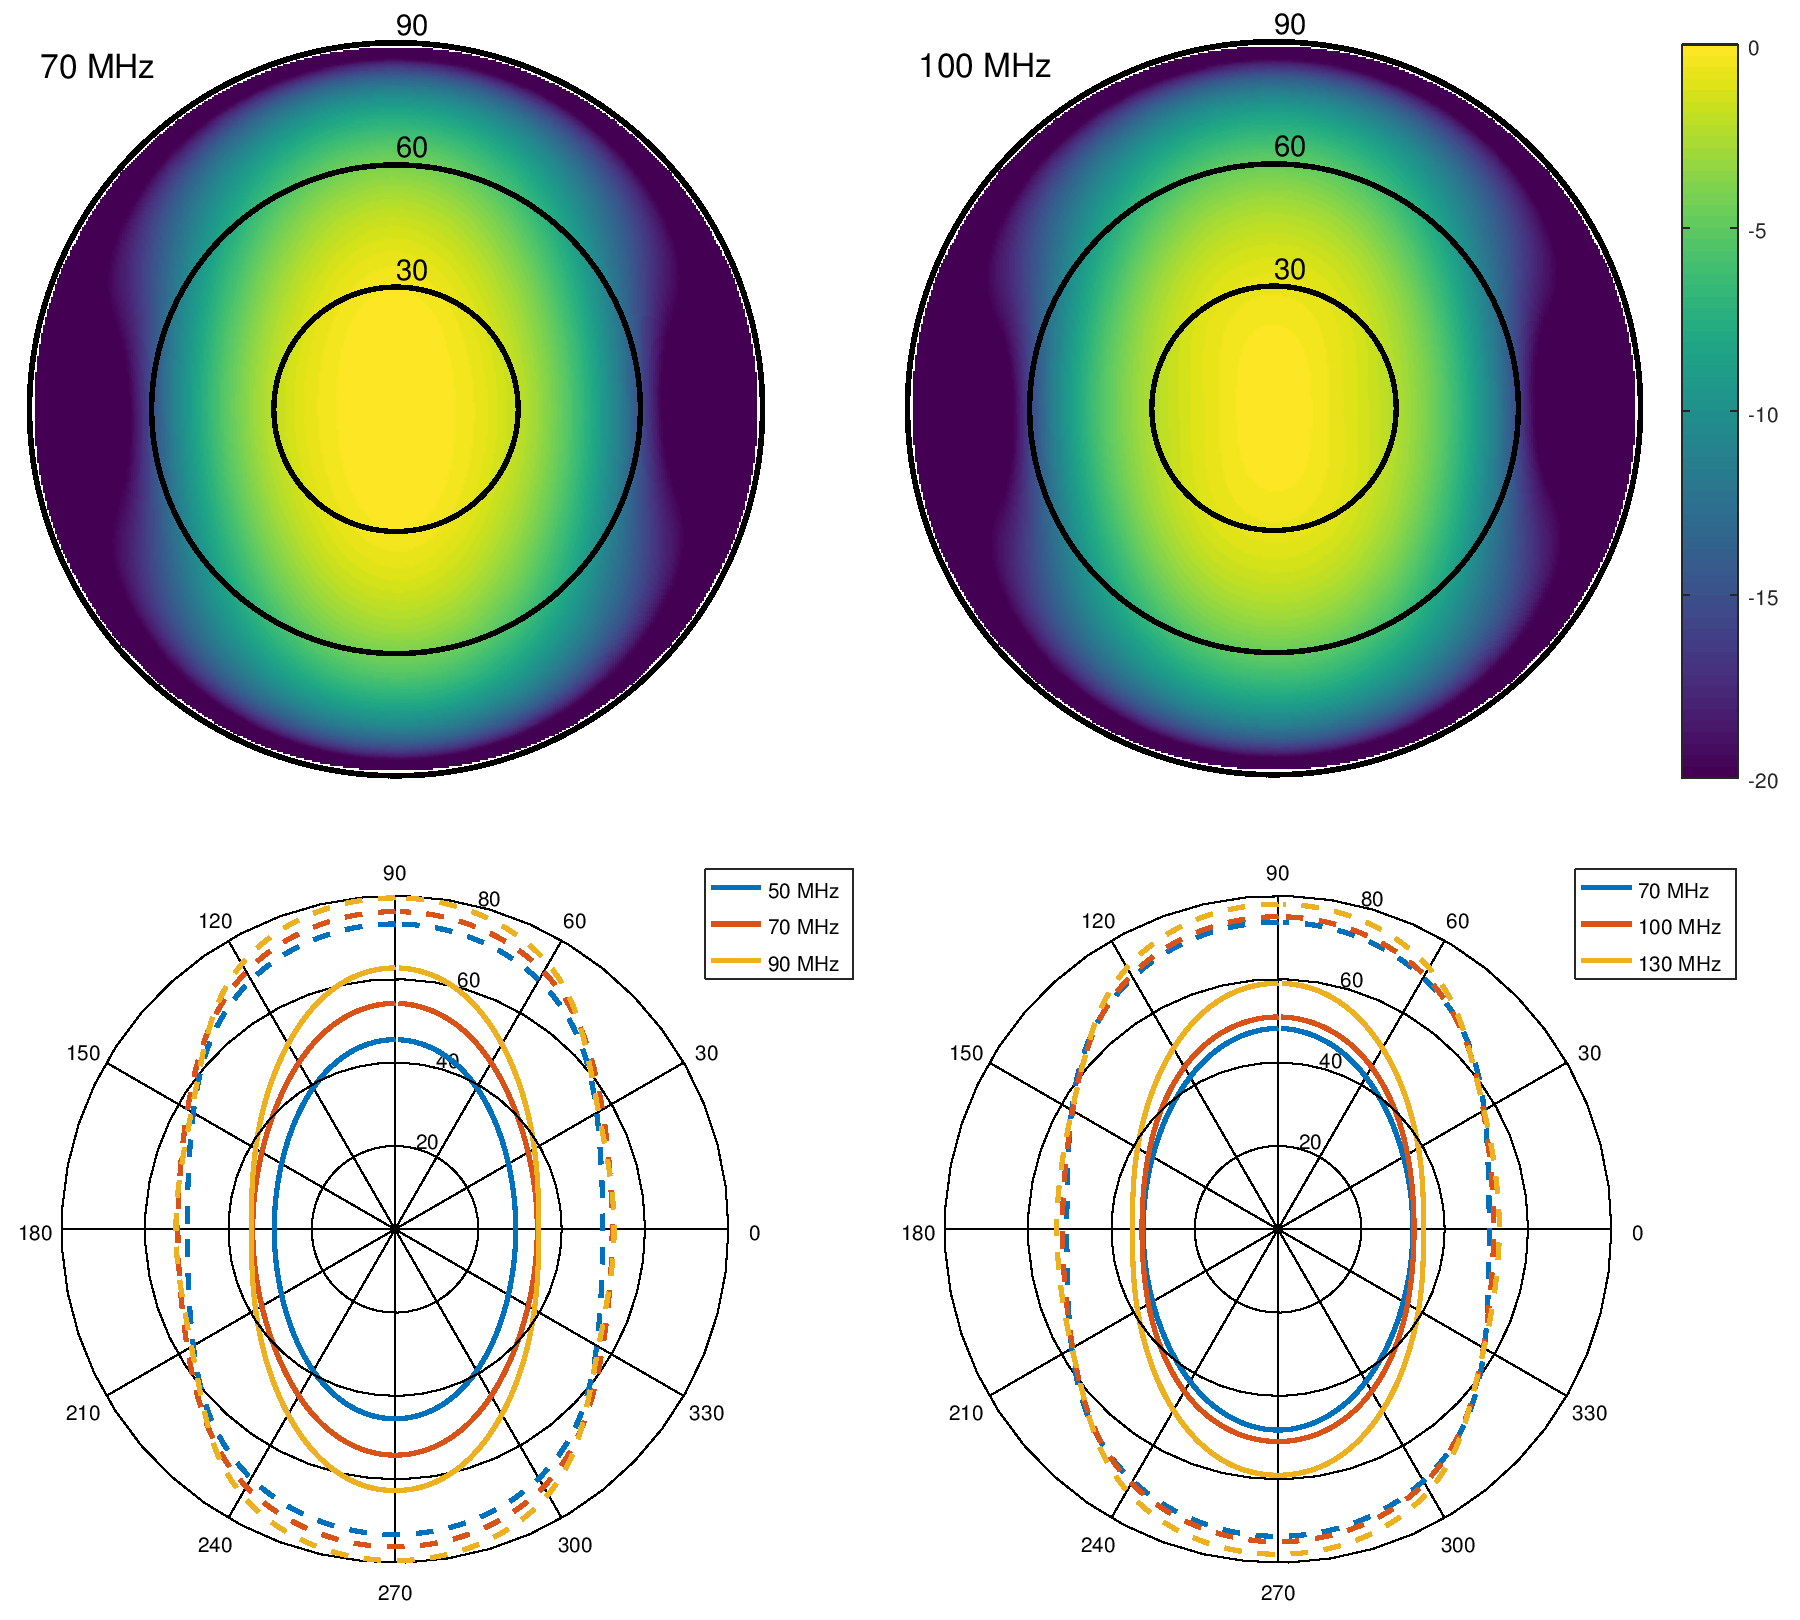
The antenna petals are supported by a fiberglass structure that consists of a central column, angled trusses, and a rigid grate that forms the base. The central column houses the first stage electronics, the trusses provide the necessary rigidity for sustaining high winds, and the base provides both anchoring weight and a flat mechanical reference surface. The entire antenna and fiberglass structure sits on top of a ground screen that is roughly 10-m on a side and is made of welded wire mesh. The ground screen is further extended by 16 10-m wire spokes that are attached to the perimeter and run radially outward. Electromagnetic simulations of the ground screen, including the damp soil at the Marion deployment site, suggest that these radial extensions have the same effect as extending the area of the ground screen; however, the radial extensions are significantly easier to install. The combination of the mesh sheet and radial extensions is intended to minimize ground-plane resonances that create weak ripples in the spectrum of the reflected power and the antenna beam pattern. Figure 3 shows the predicted beam patterns of the antennas, as simulated by FEKO 111https://altairhyperworks.com/product/FEKO.
2.2 First stage electronics
The first stage electronics are situated directly underneath the antenna petals and are housed in a fiberglass box, as shown in Figure 4. The box is vertically divided into two halves, and each half accommodates electronics that serve one polarization. Two windows on the central column allow access for installing and servicing the first stage electronics box.
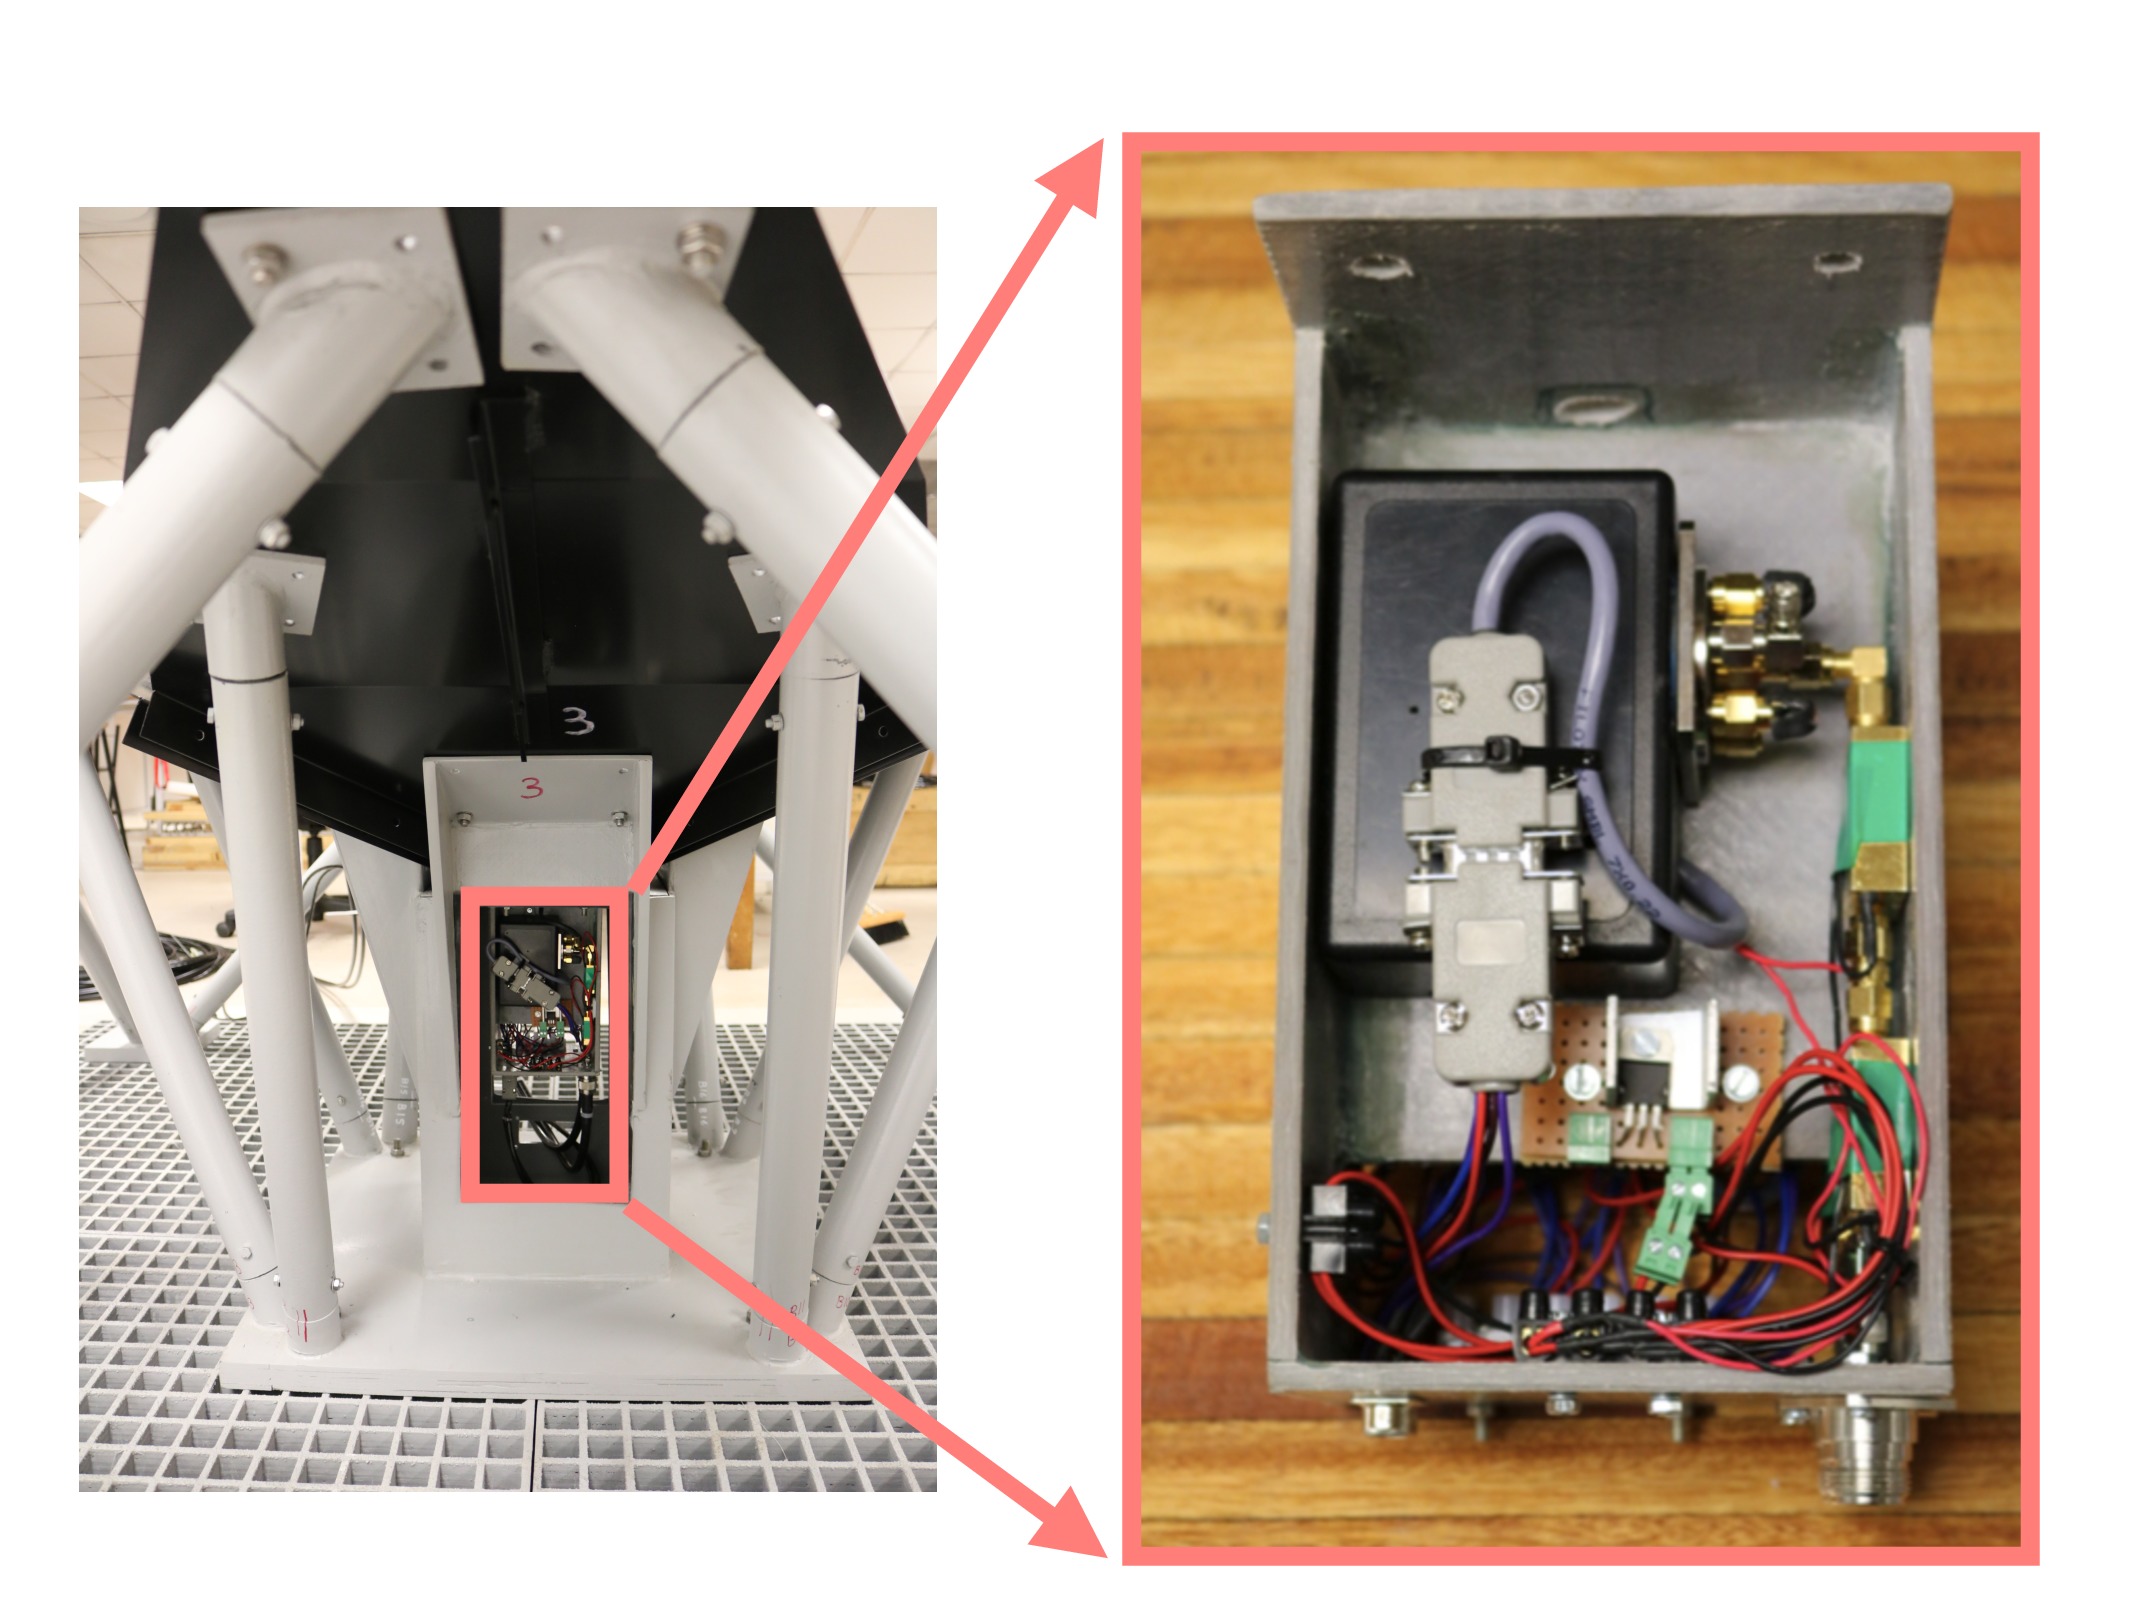
The first element in the electronics chain is a CCR-38S series SP6T electromechanical switch that selects between the antenna and several calibrator sources (50 terminator, 100 terminator, and a short) that are installed on the switch terminals. The output of the switch is connected to a chain of two Richardson RFPD 222http://www.richardsonrfpd.com/ WEA101 low noise amplifiers (LNAs), each with a gain of 20 dB and a noise figure of 1.0 dB. The amplifier output is routed to the second stage electronics using direct burial LMR-400 coaxial cable that is 50 m long, allowing the two antennas to be separated from each other, and reducing potential contamination from self-generated RFI emissions from our sampling system. Each end of the cable is wrapped with a few meters of stainless steel wire mesh cloth in order to protect the electronics from mouse damage.
2.3 Second stage and readout electronics
The second stage and readout electronics are enclosed in a Faraday cage located 50 m away from the antenna. The second stage electronics chain consists of a Minicircuits SLP-200+ low pass and SHP-25+ high pass filter that band limits the RF signal to 30–200 MHz before secondary amplification with a Minicircuits ZX60-33LN-S+ amplifier that provides 20 dB gain. This amplified signal is then passed to the readout electronics.
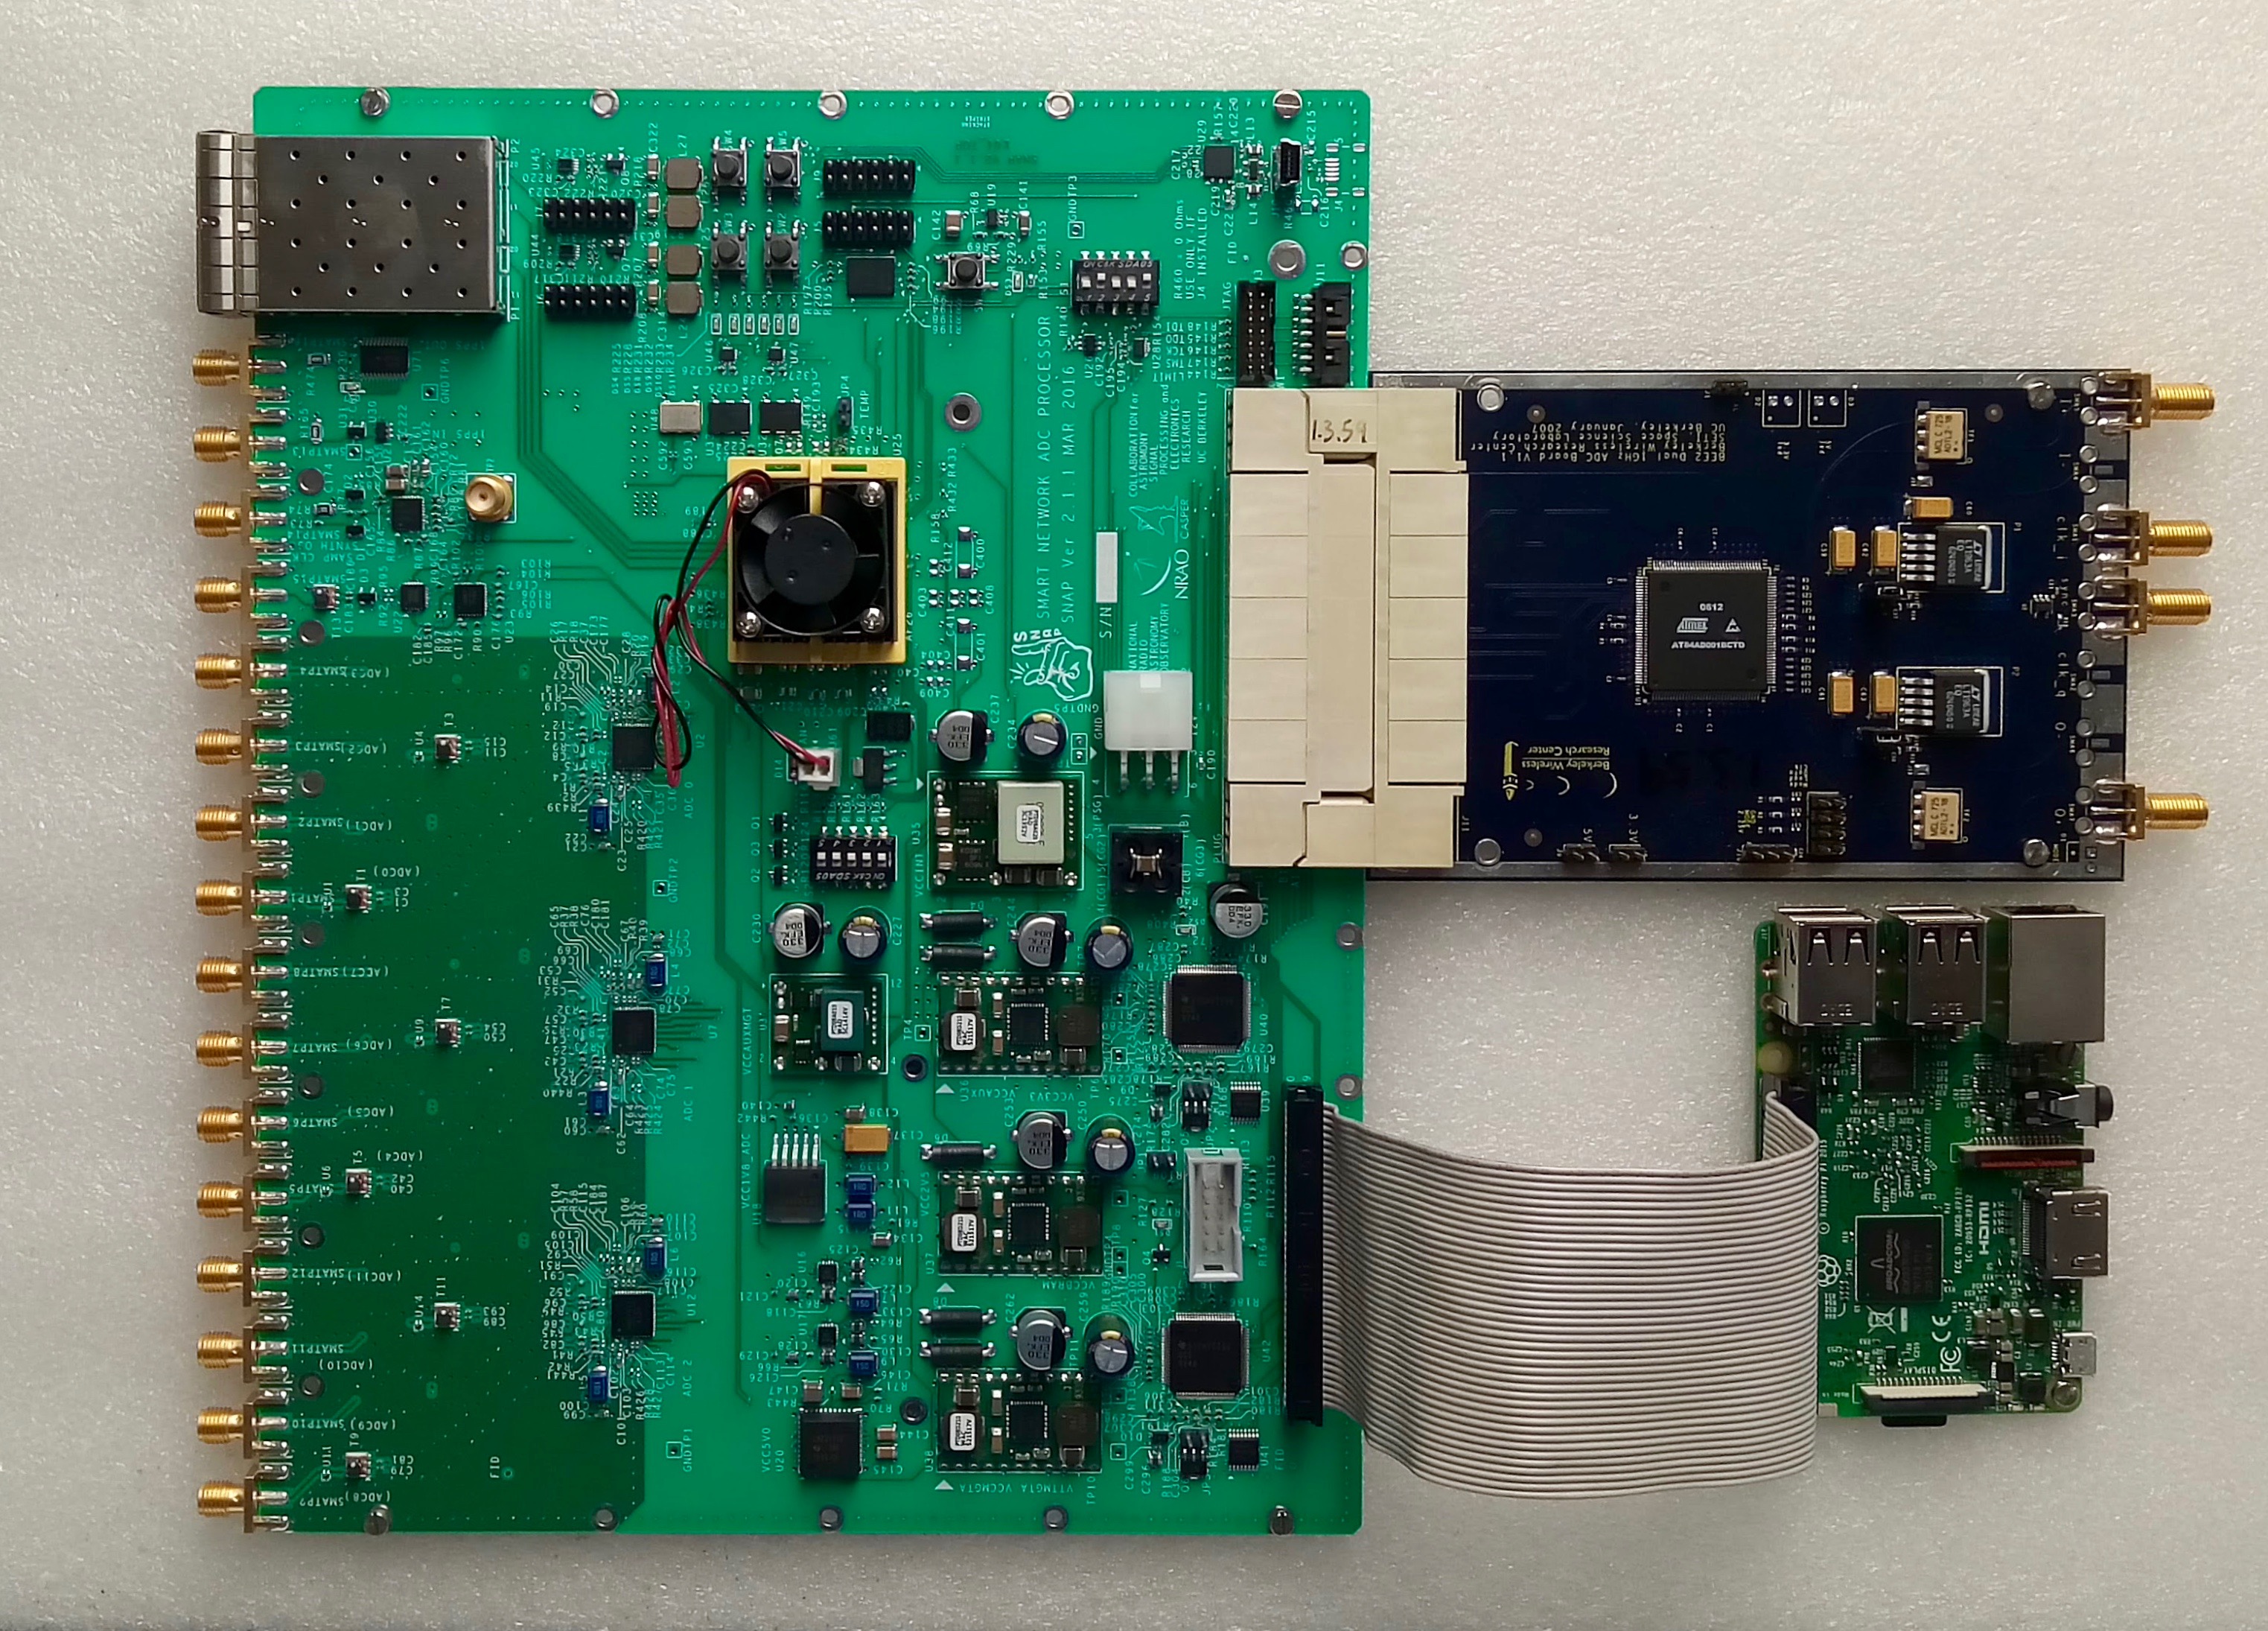
PRIZM employs two Smart Network ADC Processor (SNAP333https://casper.berkeley.edu/wiki/SNAP) boards to read out and process the analog RF signals (Hickish et al., 2016). Each SNAP board accepts two RF inputs corresponding to the two polarizations from a single antenna. The input signals are sampled at 500 Msamp/s using a dual, monolithic, eight-bit, AT84AD001B analog-to-digital converter (ADC). As shown in Figure 5, the ADC is an external unit that attaches to the SNAP board via a Z-Dok connector. The clock signal for the ADC is provided by a Valon 5009 frequency synthesizer. The SNAP board is equipped with a Kintex 7444http://www.xilinx.com/products/silicon-devices/fpga/kintex-7.html field-programmable gate array and is programmed with spectrometer firmware that uses a four-tap polyphase filter bank to channelize the two digitized input signals and generate auto- and cross-spectra. The spectra span 0–250 MHz with 4096 frequency channels and are recorded roughly once every four seconds. A Raspberry Pi (RPi) single-board computer is used to communicate with the SNAP board, run the data acquisition software, and store data. The data rate is sufficiently low (900 MB per day, both antennas combined) that a standard SD card on the RPi can save several months of data at a time.
2.4 Auxiliary electronics
The Faraday cage that encloses the second stage and readout electronics also houses auxiliary circuitry for controlling the mechanical switches. All four switches (one per polarization for both antennas) are driven by four ULN2003A Darlington transistors operating in parallel, and the transistors are commanded simultaneously by a dedicated RPi. This auxiliary RPi also records the internal temperature of the Faraday cage with a DS18B20 sensor. The auxiliary and two SNAP-control RPis are each equipped with Adafruit Ultimate GPS Breakout boards. These boards have integrated real time clocks that maintain the system times on the RPis, and the clocks are periodically synchronized to GPS satellites by hand, using an active antenna that is external to the Faraday cage.
2.5 Power distribution
The entire PRIZM system is powered using eight 12-V, 170-Ah Lead Crystal batteries that are wired in parallel. The total system power draw is 80 W, and PRIZM can operate without interruption for roughly one week when the batteries are fully charged. Battery charging is performed using a Honda EU30is generator and a fuel cache that is kept at the PRIZM observing site. During observations, the batteries are connected to a DC/DC converter that is housed inside the Faraday cage and provides a stable 12 V output despite the slow decline of the battery voltage. The 12 V output drives the mechanical switches, and there are additional regulators that supply lower voltage levels to various other components in the system.
3 Deployment and operations
3.1 Marion Island
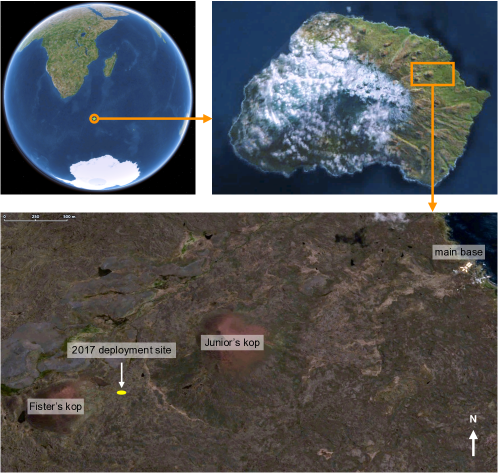
Marion Island (Figure 6) is a research station that is operated by the South African National Antarctic Programme and is located at 46∘54′45′′S, 37∘44′37′′E in the Southern Indian Ocean, about 2000 km away from the nearest continental land masses. The area of the island is 290 km2, and the main research base is situated on the northeast side. Marion is serviced via ship once per year in an annual “relief voyage” that takes place in April. The ship visit allows a few-person installation team access for three weeks. PRIZM first deployed to Marion Island in April 2017, and the experiment represents the first radio astronomy research that has been performed from this base.
3.2 Site selection
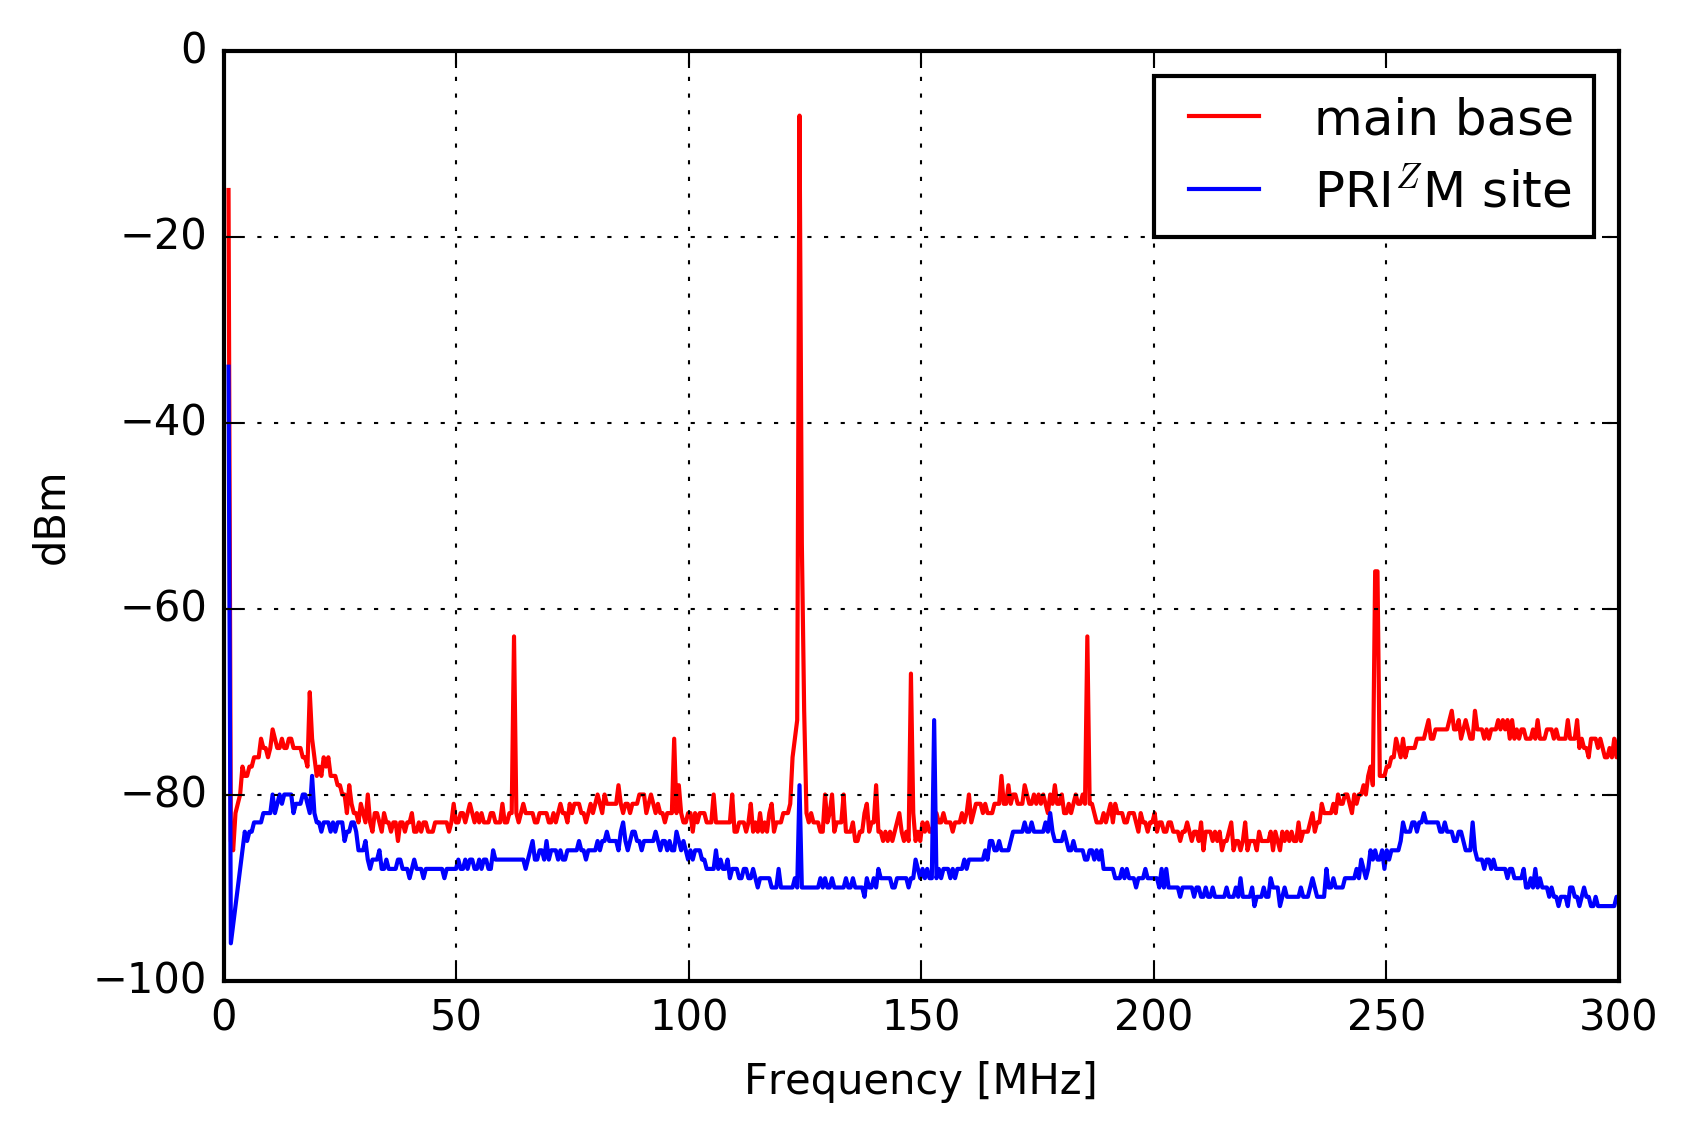
The observing site for PRIZM was selected by balancing several considerations: ease of regular access from the main base, sufficient distance from the base to minimize the impact of locally generated RFI, and suitable terrain. Junior’s kop (see Figure 6) is the largest hill within a reasonable hiking distance from the main base that can provide enhanced RFI shielding, and we found that the terrain between Junior’s and Hendrik Fister’s kop was suitably flat and dry for antenna installation. We chose an installation site at 46∘53′13S, 37∘49′10.7E, roughly 4 km southwest from the main base, and we benchmarked the level of RFI shielding by surveying with a Workman T-601 discone antenna and a Rohde Schwarz spectrum analyzer. Figure 8 shows a comparative plot of RFI at the base and the PRIZM observing site; these measurements were taken on a day when a helicopter was operating near the base and transmitting at 123.45 MHz. The observed power at 123.45 MHz is suppressed by 60 dB at the PRIZM observing site relative to the base, indicating that any station emissions well be similarly attenuated. The power reduction arises from a combination of physical separation from the base and diffraction over Junior’s kop.
3.3 Observations
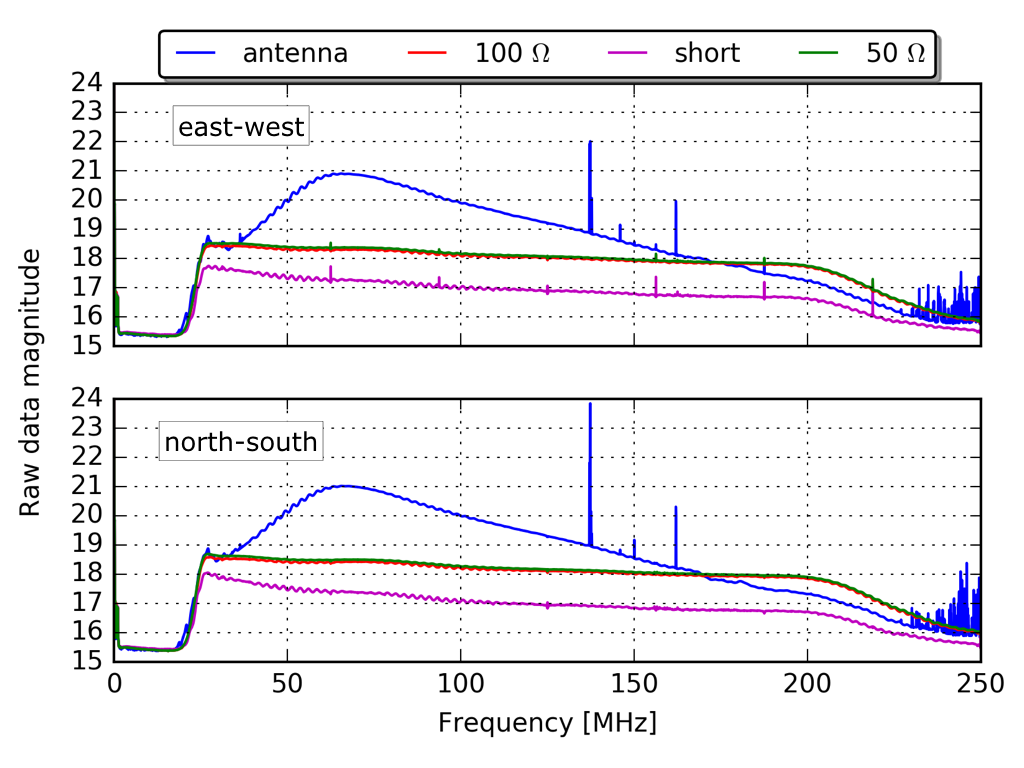
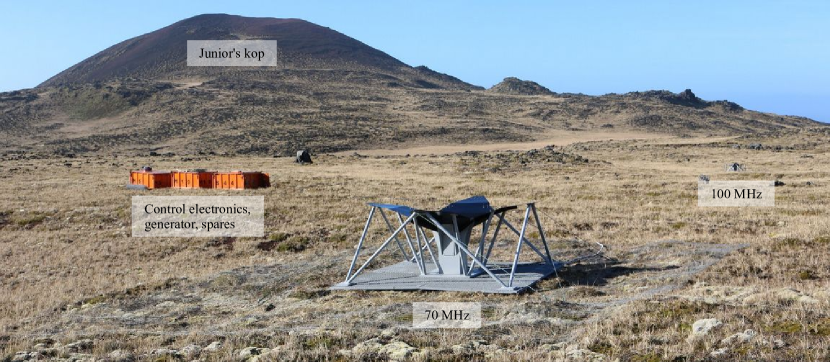
Figure 7 shows both PRIZM antennas deployed at the observing site. During normal operations, the mechanical switches on the antennas follow an observing cadence of one hour on the sky, followed by one minute on each of the calibrators. Auto- and cross-spectra of the north–south and east–west polarizations are accumulated and written every seconds for each antenna.
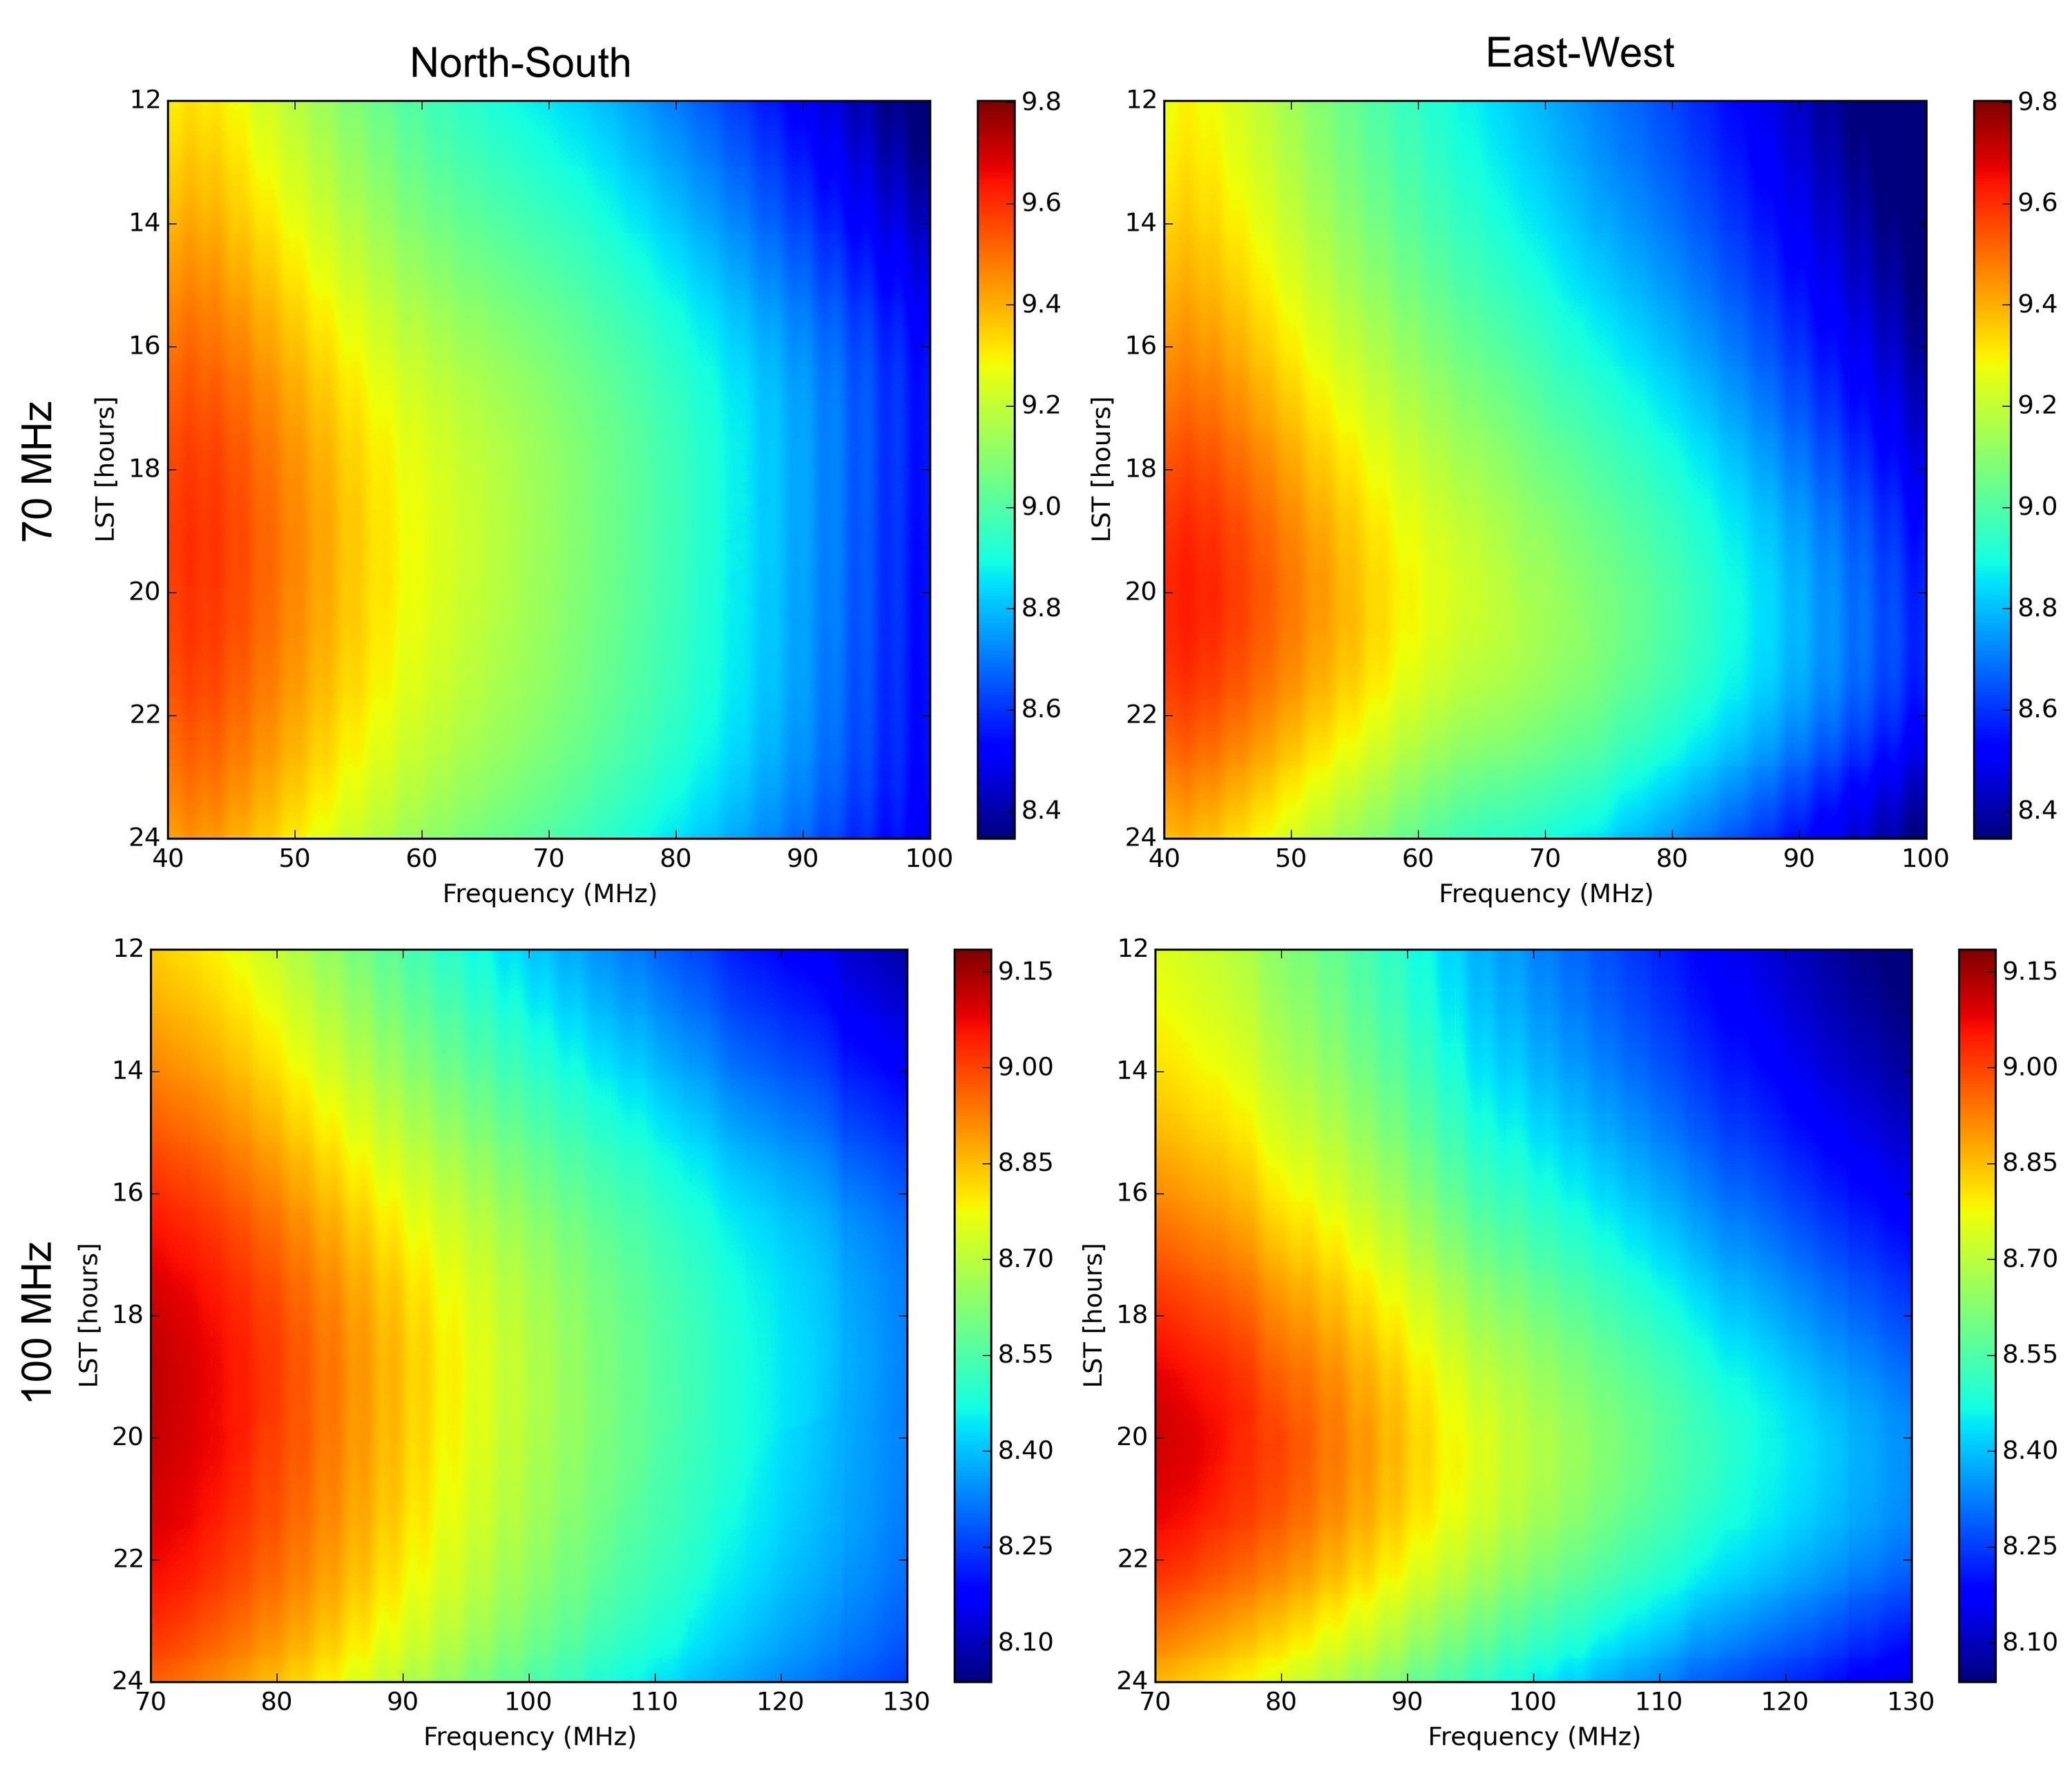
Figure 9 shows representative raw, averaged spectra from the 100 MHz antenna observing the sky and the calibrators. The falling spectrum of the Galaxy is clearly visible in the on-sky antenna data, and apart from Orbcomm transmission (137–138 MHz) and clock harmonics, there is no visible RFI contamination within the 30–200 MHz range. The noise power spectra of the 50 and 100 resistors have similar amplitudes () because they are at the same physical temperature (). The nominal relationship is independent of resistance and depends only on the bandwidth and Boltzmann’s constant . This equation assumes a perfect match between the emitting resistor and the LNA; we use the two different resistors to quantify any mismatch and to separate voltage and current noise in the LNA model.
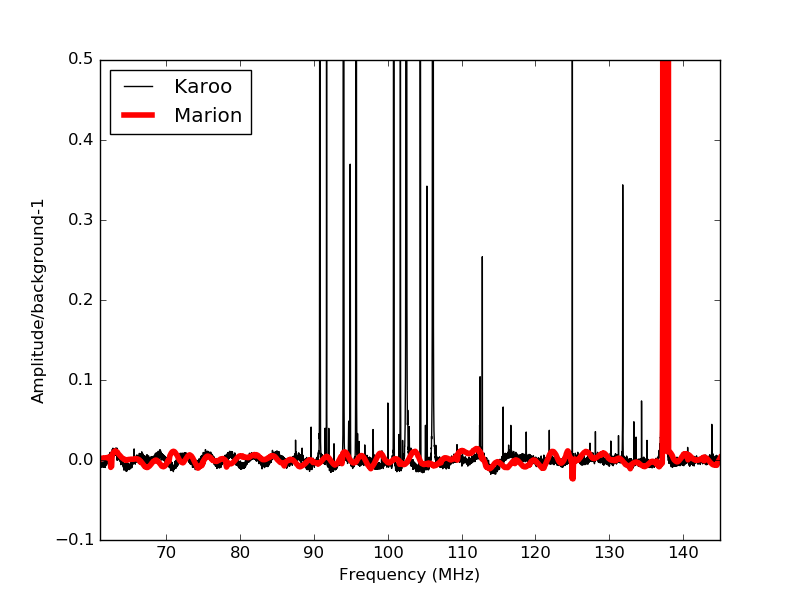
Figure 10 illustrates uncalibrated, on-sky spectra from both polarizations of the 70 and 100 MHz antennas, taken over a 12-hour period. Apart from removing the regular hourly calibrator observations, there have been no other cuts or processing applied to the data. The large-scale spectral variations arise from the Galaxy drifting through the beam as the Earth rotates. Averaging the 100 MHz east-west polarization data within this time period and applying a high-pass filter yields the spectrum shown in Figure 11. The figure also shows an identically filtered SCI-HI spectrum taken from the South African Square Kilometre Array (SKA) site in the Karoo desert. The filtering highlights RFI line features, and the spectral comparison illustrates that the cleanliness of the Marion Island RFI environment far exceeds the Karoo, with essentially no visible contamination in the FM band.
4 Discussion and future work
The installation of the PRIZM antennas on Marion Island in 2017 represents the first radio astronomy research conducted from this research base. The remote location of Marion presents a number of challenges, including the short three-week access window that is available only once per year, the harsh environmental conditions of the Roaring Forties (high winds, rain, cold temperatures), and mouse infestation. We have successfully overcome these challenges, and we have several improvements planned for the PRIZM system that will be implemented during subsequent voyages and described in future publications.
We have found that the remoteness of Marion Island results in an exceptionally radio-quiet environment, with no evidence of detected RFI contamination in the FM band. In particular, the 2000 km separation between the island and the mainland is close to the distance limit at which meteor trails effectively scatter RFI (e.g. Wislez, 1996). We have not seen qualitative evidence of enhanced RFI from meteor scattering, an effect that is commonly visible at many other remote sites. The overall radio quietness of Marion Island surpasses even the South African SKA site in the Karoo desert.
The lack of RFI, in combination with calmer ionospheric conditions during winter nights, make Marion an excellent site for low-frequency radio observations. The International Reference Ionosphere 2012 model555https://iri.gsfc.nasa.gov/ suggests that during the last solar minimum, the ionosphere plasma frequency dropped as low as 1.5 MHz on winter nights. The PRIZM site will provide the necessary infrastructure and test bed to deploy new low-frequency experiments in the future, possibly opening new observational windows at long wavelengths that have been prohibitively difficult to measure to date.
Acknowledgments
We gratefully acknowledge the National Research Foundation (grant number 93087) and the South African National Antarctic Programme for providing funding and logistical support for our research program. The financial assistance of the South African SKA Project (SKA SA) towards this research is hereby acknowledged (www.ska.ac.za). We additionally extend our sincere gratitude to the staff at SKA SA for hosting our lab tests. We thank the South African National Space Agency for their technical support and the crew of Ultimate Heli for safely delivering us and our cargo. The authors also wish to thank Judd Bowman, Matt Dexter, Ryan Monroe, Raul Monsalve, Aaron Parsons and Nipanjana Patra for useful discussions.
References
- Barkana (2018) Barkana, R. [2018] Nature 555, 71, 10.1038/nature25791.
- Bernardi et al. (2015) Bernardi, G., McQuinn, M. & Greenhill, L. J. [2015] ApJ 799, 90, 10.1088/0004-637X/799/1/90.
- Bowman et al. (2018) Bowman, J. D., Rogers, A. E. E., Monsalve, R. A., Mozdzen, T. J. & Mahesh, N. [2018] Nature 555, 67, 10.1038/nature25792.
- Burns et al. (2017) Burns, J. O., Bradley, R., Tauscher, K., Furlanetto, S., Mirocha, J., Monsalve, R., Rapetti, D., Purcell, W. et al. [2017] ApJ 844, 33, 10.3847/1538-4357/aa77f4.
- Burns et al. (2012) Burns, J. O., Lazio, J., Bale, S., Bowman, J., Bradley, R., Carilli, C., Furlanetto, S., Harker, G. et al. [2012] Advances in Space Research 49, 433, 10.1016/j.asr.2011.10.014.
- Cohen et al. (2017) Cohen, A., Fialkov, A., Barkana, R. & Lotem, M. [2017] Monthly Notices of the Royal Astronomical Society 472, 1915, 10.1093/mnras/stx2065.
- Dowell & Taylor (2018) Dowell, J. & Taylor, G. B. [2018] ApJ 858, L9, 10.3847/2041-8213/aabf86.
- Furlanetto et al. (2006) Furlanetto, S. R., Oh, S. P. & Briggs, F. H. [2006] Physics Reports 433, 181, 10.1016/j.physrep.2006.08.002.
- Hickish et al. (2016) Hickish, J., Abdurashidova, Z., Ali, Z., Buch, K. D., Chaudhari, S. C., Chen, H., Dexter, M., Domagalski, R. S. et al. [2016] Journal of Astronomical Instrumentation 5, 1641001-12, 10.1142/S2251171716410014.
- Jáuregui–García et al. (2017) Jáuregui–García, J. M., Peterson, J. B., Castillo–Domínguez, E. & Voytek, T. C. [2017] IEEE AP-S.
- Monsalve et al. (2017) Monsalve, R. A., Rogers, A. E. E., Bowman, J. D. & Mozdzen, T. J. [2017] ApJ 847, 64, 10.3847/1538-4357/aa88d1.
- Mozdzen et al. (2017) Mozdzen, T. J., Bowman, J. D., Monsalve, R. A. & Rogers, A. E. E. [2017] Monthly Notices of the Royal Astronomical Society 464, 4995, 10.1093/mnras/stw2696.
- Patra et al. (2013) Patra, N., Subrahmanyan, R., Raghunathan, A. & Udaya Shankar, N. [2013] Experimental Astronomy 36, 319, 10.1007/s10686-013-9336-3.
- Pospelov et al. (2018) Pospelov, M., Pradler, J., Ruderman, J. T. & Urbano, A. [2018] ArXiv e-prints .
- Price et al. (2017) Price, D. C., Greenhill, L. J., Fialkov, A., Bernardi, G., Garsden, H., Barsdell, B. R., Kocz, J., Anderson, M. M. et al. [2017] ArXiv e-prints .
- Pritchard & Loeb (2012) Pritchard, J. R. & Loeb, A. [2012] Reports on Progress in Physics 75, 086901, 10.1088/0034-4885/75/8/086901.
- Singh et al. (2017) Singh, S., Subrahmanyan, R., Udaya Shankar, N., Sathyanarayana Rao, M., Girish, B. S., Raghunathan, A., Somashekar, R. & Srivani, K. S. [2017] ArXiv e-prints .
- Sokolowski et al. (2015) Sokolowski, M., Tremblay, S. E., Wayth, R. B., Tingay, S. J., Clarke, N., Roberts, P., Waterson, M., Ekers, R. D. et al. [2015] Publications of the Astronomical Society of Australia 32, e004, 10.1017/pasa.2015.3.
- Voytek et al. (2014) Voytek, T. C., Natarajan, A., Jáuregui García, J. M., Peterson, J. B. & López-Cruz, O. [2014] ApJ 782, L9, 10.1088/2041-8205/782/1/L9.
- Wislez (1996) Wislez, J.-M. [1996] “Forward scattering of radio waves off meteor trails,” Proceedings of the International Meteor Conference, 14th IMC, Brandenburg, Germany, 1995, eds. Roggemans, P. & Knofel, A., p. 99.