Relating Chain Conformations to Extensional Stress In Entangled Polymer Melts
Abstract
Nonlinear extensional flows are common in polymer processing but remain challenging theoretically because dramatic stretching of chains deforms the entanglement network far from equilibrium. Here, we present coarse-grained simulations of extensional flows in entangled polymer melts for Rouse-Weissenberg numbers – and Hencky strains . Simulations reproduce experimental trends in extensional viscosity with time, rate and molecular weight. Studies of molecular structure reveal an elongation and thinning of the confining tube with increasing . The rising stress is quantitatively consistent with the decreasing entropy of chains at the equilibrium entanglement length. Molecular weight dependent trends in viscosity are related to a crossover from the Newtonian limit to a high rate limit that scales differently with chain length.
pacs:
Valid PACS appear hereThe development of an accurate molecular model for polymer dynamics in complex flows has been the focus of intense research for more than 50 years. The tube model Doi and Edwards (1988) has been incredibly successful in describing the dynamics of polymers in terms of entanglements with other chains that form a temporary confining tube that hinders diffusion. It captures the linear response of chemically distinct melts in terms of a universal function of the number of entanglements per chain and a material specific entanglement time and stress scale Likhtman and McLeish (2002). However a growing number of experiments show new physics must be incorporated to understand strongly nonlinear flows that are relevant to industrial applications. A striking example is that melts with identical and linear response can show opposite trends in strong elongational flows, with viscosity rising or falling with increasing rate Bach et al. (2003); Nielsen et al. (2006); Huang et al. (2013a, b); Wingstrand et al. (2015).
A number of attempts have been made to generalize the tube model based on different hypotheses about molecular mechanisms, including convective constraint release under shear Marrucci (1996), segmental stretch Mead et al. (1995, 1998), interchain pressure Marrucci and Ianniruberto (2004), formation and destruction of “slip-links” Likhtman (2005); Baig et al. (2010); Andreev et al. (2013); Ianniruberto and Marrucci (2014), and friction reduction in elongational flowsIanniruberto et al. (2012); Yaoita et al. (2012); Wingstrand et al. (2015); Costanzo et al. (2016). To date, no generalization of the tube model has been able to predict behavior in strong elongational flows Bach et al. (2003); Huang et al. (2013a, b); Wingstrand et al. (2015) and experiments have not provided direct measures of changes in chain conformation. It remains unclear how the confining tube changes in nonlinear flows, how chain conformations affect dissipation and what role chemistry Sridhar et al. (2013), , chain length, and the equilibrium entanglement length play in determining the molecular mechanisms underlying nonlinear behavior.
Molecular dynamics (MD) simulations are an ideal platform for relating macroscopic response to molecular structure Likhtman et al. (2007); Cao and Likhtman (2015), but it has been difficult to simulate strong elongational flows at sufficiently large strains to reach steady state Xu et al. (2018); Kroger et al. (1997); Daivis et al. (2003). In this paper we use a recently developed technique Dobson (2014); Nicholson and Rutledge (2016) to overcome this barrier. The simulations capture experimental trends in both the transient and steady state nonlinear viscosity of melts with different and entanglement length Sridhar et al. (2013); Wingstrand et al. (2015). Trends in viscosity with rate, and are explained as a cross-over from the Newtonian limit to a high rate limit for aligned chains. A simple scaling law for the high rate behavior is derived and verified. The observed macroscopic response is shown to arise from changes in chain statistics that can be described as alignment and contraction of a confining tube with increasing strain rate. Surprisingly, changes in segment orientation only depend on the degree of entanglement , while chain stretching at high rates only depends upon the equilibrium entanglement length . For all rates and melts, the steady-state stress is quantitatively related to changes in chain entropy over segments of length .
Polymers are modeled with the well-studied Kremer-Grest bead-spring model Kremer and Grest (1990) using LAMMPS Plimpton (1995). All beads interact with a truncated Lennard-Jones (LJ) potential and results are presented in reduced LJ units. Linear chains of beads are bound together with a FENE potential with mean bond length . To vary tube model parameters, the chain stiffness is controlled by a bond bending potential , where is the angle between successive bonds. For the melt labeled M1, and there are beads per rheological entanglement length Moreira et al. (2015). For melt M2, and Moreira et al. (2015).
Melts with chains are equilibrated at temperature and density with standard methods Auhl et al. (2003). M1 melts have , ; , ; , ; or , , corresponding to , , or , respectively. M2 melts have M=918, N=200; M=354, N=300 or M=405, N=450, corresponding to , 6 or 9, respectively. Melts are deformed at constant Hencky strain rate with the stretch along the z-axis. Since polymers are nearly incompressible, the two perpendicular directions contract by . Flow is maintained by integrating the SLLOD equations of motion, and Generalized Kraynik-Reinelt boundary conditions are used to prevent the simulation box from becoming too small in the perpendicular directions Dobson (2014); Nicholson and Rutledge (2016). As shown in Supplemental Material (SM) Fig. S1, simulations reproduce the time-dependent evolution of viscosity that is observed in experiments, while achieving strains that are not currently experimentally accessible. The steady-state extensional stress and chain statistics are obtained by averaging simulation data over the strain interval .
Experiments typically plot dynamic viscosity data in reduced units based on tube theory to facilitate comparison between different melts Dealy and Larson (2006); Sridhar et al. (2013); Wingstrand et al. (2015). Times are scaled by the entanglement time and the viscosity by , where the Rouse time is the characteristic time for a stretched chain to relax to its equilibrium contour length and is the entanglement modulus. A dimensionless measure of flow rate is the Rouse-Weissenberg number . Previous studies have measured and for M1 and M2 melts, respectively Moreira et al. (2015); Hsu and Kremer (2016); Ge et al. (2014).
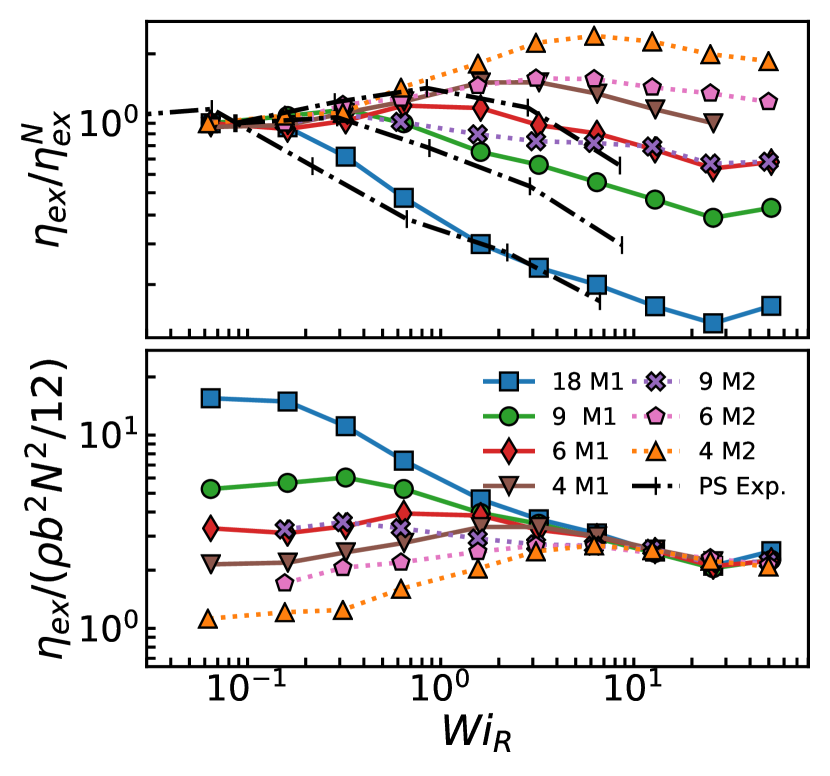
Figure 1(a) shows the rate dependence of the steady state viscosity normalized by the value in the Newtonian limit . Data for M1 and M2 melts are shown alongside experimental results for polystyrene (PS) at similar . The significant difference between results for M1 and M2 melts at any common value of is consistent with the deviations from tube theory found in past experiments Wingstrand et al. (2015). Although is not enough to determine the nonlinear response, all melts show common trends with increasing . For both simulations and experiments, the longest chains begin to shear-thin at the lowest and show the largest drop in viscosity. The decrease is almost an order of magnitude for M1 and PS at and 21, respectively. As decreases, the onset of shear thinning moves to larger and the decrease in decreases. Indeed shorter chains show some initial shear thickening for all systems Nielsen et al. (2006); Wingstrand et al. (2015); Costanzo et al. (2016).
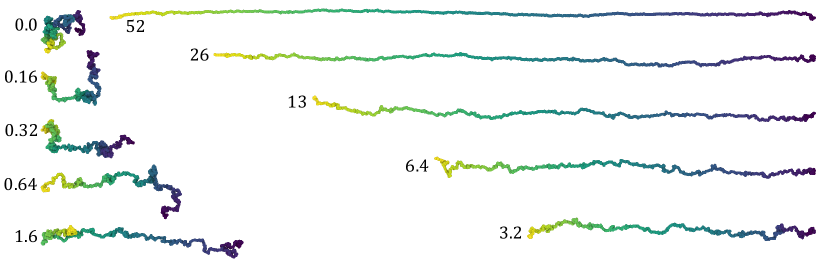
Simulations allow us to directly correlate these changes in macroscopic response with changes in molecular structure. Snapshots in Fig. S2 show chains evolve from nearly equilibrium random coils at to nearly straight configurations by . This evolving orientational order can be described by the nematic order parameter , where indicates an ensemble average and is the angle between the extension axis and the vector between beads separated by bonds. As shown in Fig. 2, for randomly oriented chains at low and approaches unity at high , corresponding to complete alignment. Alignment occurs first at the full chain length ( bonds) and affects smaller as increases. The rate where approaches unity coincides with the onset of a decrease in . Both changes imply that deformation is faster than the the longest relaxation time, the disentanglement time for chains to escape their tubes.Doi (1983); Hou et al. (2010) As shown in Fig. S3, for and saturates near unity for .
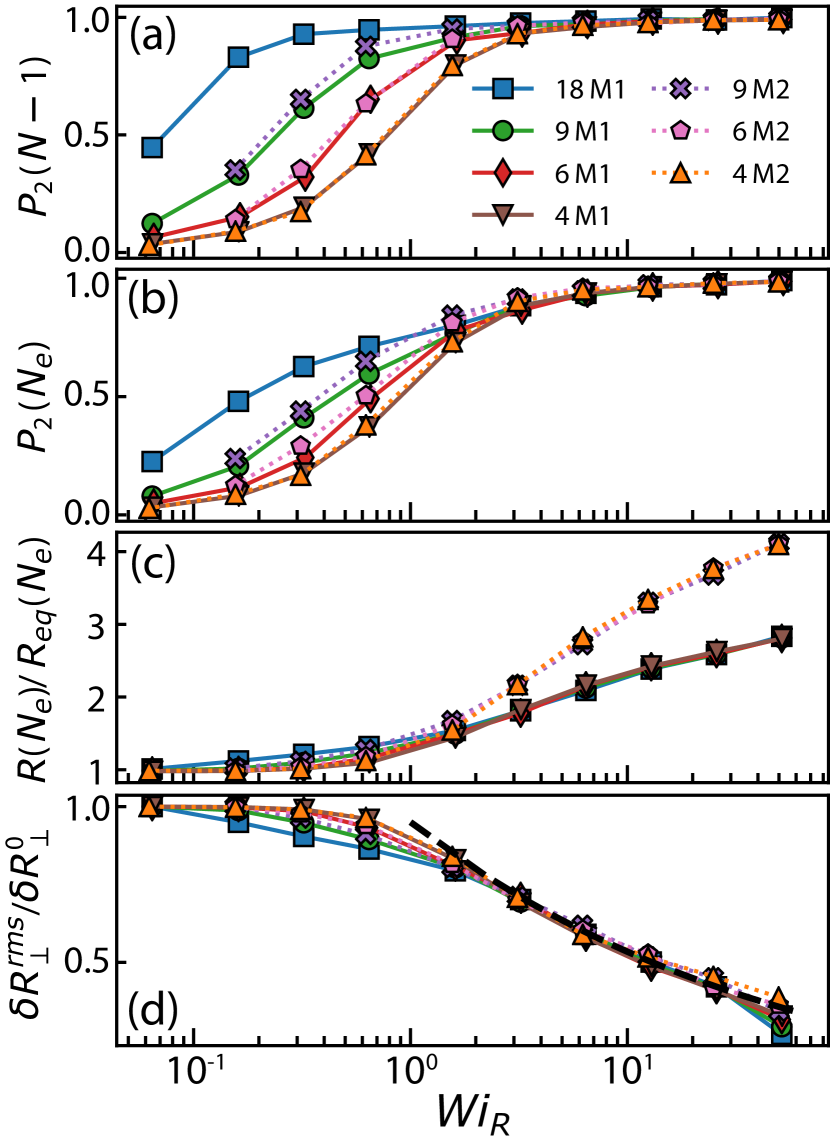
Alignment at the entanglement scale starts at larger . In the low rate regime (), is the same for different melts at the same . By , exceeds 0.5 for all melts, and the results collapse on to a common curve for . For chains are deformed faster than they can escape their tubes. For the tube is being deformed and aligned along the extension direction faster than chains can relax to their equilibrium length along the tube. As a result, segments are stretched and aligned at shorter and shorter scales as increases.
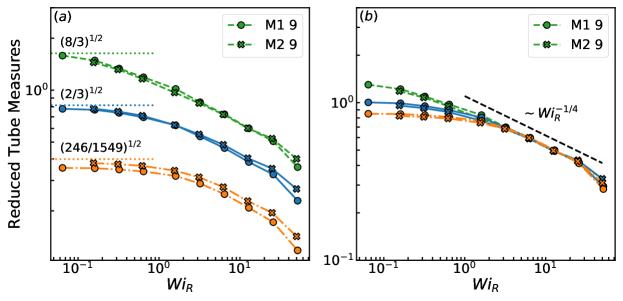
A measure of straightening is provided by the root mean squared (rms) length of . This must be less than the contour length between beads , where the bond length remains essentially unchanged at the highest considered here. The fraction of the fully extended length is shown in Fig. 3. At chains have a near equilibrium conformation. The ratio decreases slowly with increasing at small because makes the chain fairly straight. The behavior changes above the Kuhn length , where the chain stiffness constant is 2.8 and 2.2 for M1 and M2, respectively Hsu and Kremer (2016). At larger , chains are random coils and (black solid line in Fig. 3). For short chains follow the equilibrium behavior at all . For the longer chains shown, there is a slight straightening and reduced rate of decrease in at large because .
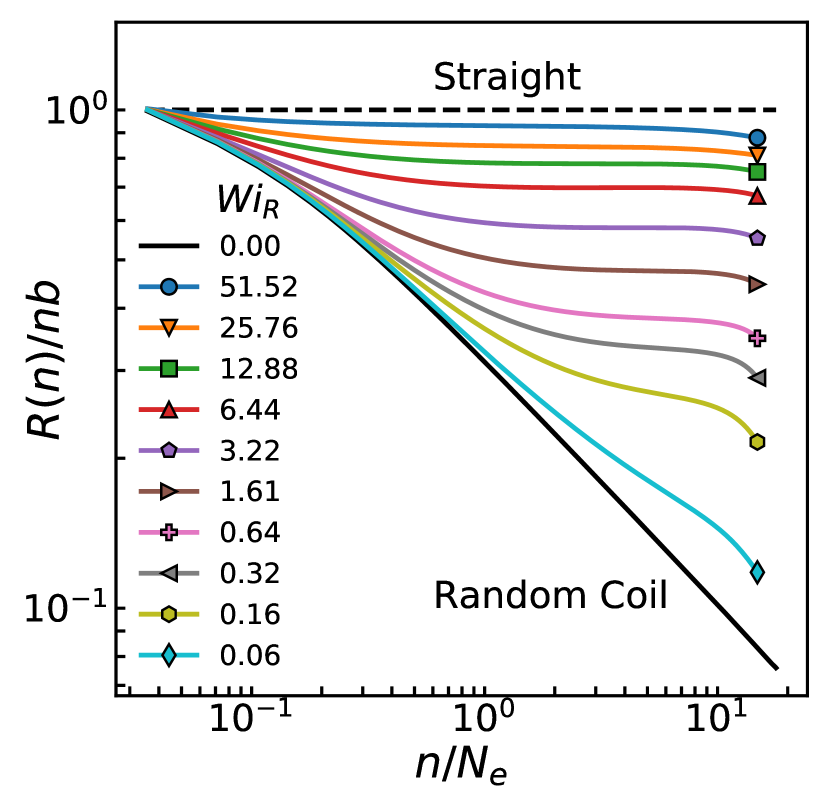
The scale at which there is significant straightening decreases from to as increases towards unity. For the behavior is qualitatively different, with saturating at large . Saturation starts near for and moves to smaller as increases. These results are exactly as expected from the snapshots in Fig. S2. Flow increases the length of chains and reduces fluctuations around their end-end vector.
The changes in imply changes in the conformation of the tube confining each chain. In equilibrium the tube has a radius of order and is a random walk at larger scales with a Kuhn length of order . Under elongation, Fig. 2 shows that the tube stretches and narrows. The increase in tube length per can be measured by calculating the ratio . As shown in Fig. 2c, the tube length remains nearly constant as increases to unity and then rises rapidly. Results for each melt collapse on to a common curve and at large approach the maximum possible stretch and 4.8 for M1 and M2, respectively.
To characterize the change in tube diameter we consider segments of length and evaluate the maximum rms fluctuation in the plane perpendicular to the end-end vector. Only the central 20% of each segment is included because the fluctuation goes to zero at the ends of each segment (see SM Sec. D). As for the tube length, the tube radius begins to change rapidly for (although there is a small change for the longest chains when ). The fractional change in tube radius at is nearly the same for all and both melts. In all cases is of order at the largest , corresponding to a nearly straight chain.
Short segments are able to retain a nearly equilibrium conformation up to higher . Since the relaxation time scales as , one may expect that the relaxed length scales as . The length of the corresponding random walk should set the tube radius, leading to a prediction that until the radius approaches the bond length. The tube length should grow as the number of segments of length times the rms length of each, implying until it saturates at . The scaling range is not large enough to accurately test these scaling exponents, but the thick dashed line in Fig. 2(d) shows that the decrease in is consistent with a power law Marrucci and Ianniruberto (2004) 111Marrucci and Ianniruberto proposed a theory predicting based on an inter-chain tube pressure. However, the dynamics of their theory predicts a cross-over to this scaling controlled by . This cannot describe our data which shows only depends on for ..
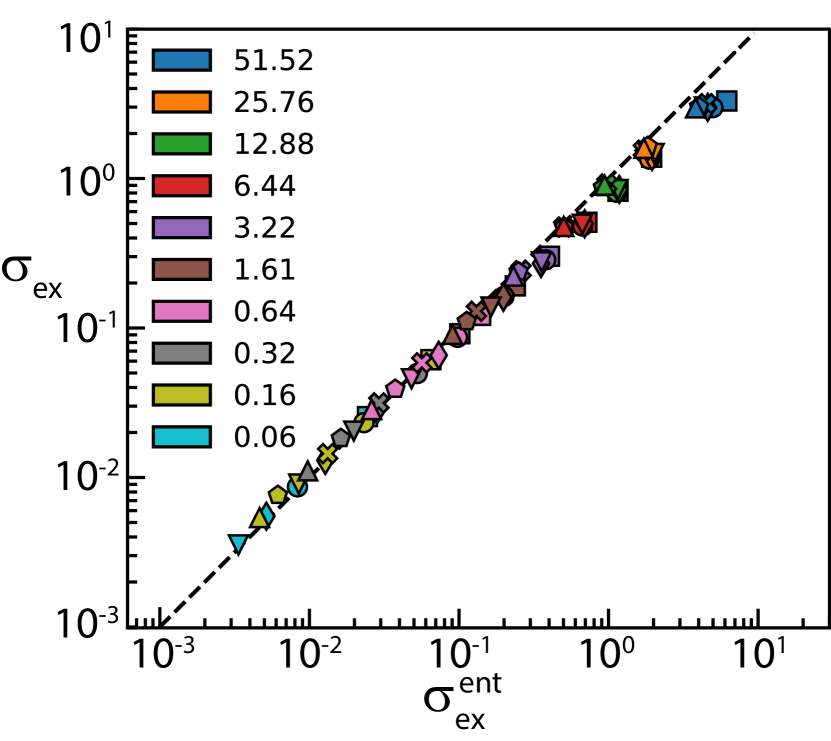
The alignment of chains by flow implies a reduction in their entropy that contributes to the steady-state stress . While there is also an energetic contribution, it is much smaller because there is almost no stretching of chain backbones at the highest considered here. One can calculate the stress due to the entropic force of segments of length stretched to . The density of such segments is , where is the monomer density. The stress tensor where and are cartesian coordinates Rubinstein and Colby (2003). Since the force is directed radially, the extensional stress is Inserting the standard result for the force on a random chain yields
| (1) |
where the inverse Langevin function accounts for the nonlinear reduction in entropy as segments approach full extension Doi and Edwards (1988); Rubinstein and Colby (2003).
In the Newtonian limit, the tube model relates the stress to the change in entropy of segments with length . A network of entanglements is assumed to carry the stress at larger scales Doi and Edwards (1988). It is not clear whether the same should be used in Eq. 1 for the highly aligned states at large . However, is insensitive to at large because of the plateau in (Fig. 3). Figure 4 plots the total measured steady-state stress versus for all simulated liquids in steady state. The two quantities are in excellent agreement for all melts and over three orders of magnitude in reduced stress. Deviations only become significant at the largest where the chains are nearing complete alignment and Eq. 1 becomes singular.
To obtain the viscosity in the large limit we equate the macroscopic rate of dissipation per unit volume to the microscopic dissipation. Since chains are nearly fully extended, we consider a single straight chain in an extensional uniaxial flow. The entire chain must have the same average velocity, so the mean velocity of its monomers relative to their neighbors grows linearly with distance from the chain center as . If there is a linear drag force with drag coefficient , each monomer dissipates energy at a rate . Averaging the dissipation over gives a dissipation per monomer of and thus . In general, will depend upon the chemical structure and interactions of the chain backbone.
Figure 1(b) shows normalized by . Results for both models and all chain lengths collapse onto a universal curve at large whose limiting value corresponds to . Note that M1 and M2 are expected to have nearly the same because they have identical monomer masses, bond lengths and interchain interactions. The main difference is that M2 is more rigid and this becomes irrelevant for aligned chains. The derived value of is consistent with the viscosity of short chains.
The above results explain many experimental observations on the nonlinear response of polymers under strong elongational flow and relate them to changes in chain conformation. At all the stress is quantitatively described by the entropic forces associated with chain straightening on segments of length . This entropic stress is balanced by drag forces that also depend on chain conformation and scale with different powers of at low and high .
For small , chains remain close to Gaussian random walks. As predicted by the tube model and shown in Fig. S6 Doi (1983), and scales as where for well entangled chains and is the monomer drag in the Newtonian limit. At high rates, chains are straight and rises as . The ratio between the Newtonian and high-rate viscosity scales as . The dependence explains why the amount of extension rate thinning increases with chain length in both experiments Bach et al. (2003); Nielsen et al. (2006); Wingstrand et al. (2015) and simulations (Fig. 1). The thinning of long chains can be fit to a power law with a dependent exponent over about one decade in rate.
Chemistry enters through and the drag coefficients. Rate thickening may be observed at small for melts like M2 with small . The increased stiffness of M1 chains, decreases and increases the amount of thinning. Diluting with short chains increases , which may be part of the reason solutions show less shear thinningIanniruberto et al. (2012); Yaoita et al. (2012); Wingstrand et al. (2015); Costanzo et al. (2016). There is also evidence that solutions suppress changes in drag because solvent molecules are less aligned by flow Ianniruberto et al. (2012); Yaoita et al. (2012); Wingstrand et al. (2015); Costanzo et al. (2016). Changes in monomer drag with alignment as increases are small in our systems because the monomers are spherical. Large effects may be expected for polymers with large and rigid side groups.
Many recent methods identify entanglements with contacts between the primitive paths of polymers Everaers et al. (2004); Kröger (2005); Tzoumanekas and Theodorou (2006). These methods suggest that there are no entanglements between the highly aligned chains at large Likhtman (2005); Baig et al. (2010); Andreev et al. (2013); Ianniruberto and Marrucci (2014). However, our measured chain statistics show that chains are highly confined at large and the volume of the tube associated with the length and radius in Fig. 2 decreases as rises. Studies of chain relaxation will play an important role in unraveling the relationship between entanglements and the confining tube at high rate.
Acknowledgements.
The authors would like to thank Peter D. Olmsted for valuable discussions. This work was performed within the Center for Materials in Extreme Dynamic Environements (CMEDE) at the Hopkins Extreme Materials Institute with financial Support provided by grant No. W911NF-12-2-0022.References
- Doi and Edwards (1988) M. Doi and S. F. Edwards, The Theory of Polymer Dynamics, Vol. 73 (Oxford University Press, 1988).
- Likhtman and McLeish (2002) A. E. Likhtman and T. C. B. McLeish, Macromolecules 35, 6332 (2002).
- Bach et al. (2003) A. Bach, K. Almdal, H. K. Rasmussen, and O. Hassager, Society 36, 5174 (2003).
- Nielsen et al. (2006) J. K. Nielsen, H. K. Rasmussen, O. Hassager, and G. H. McKinley, Journal of Rheology 50, 453 (2006).
- Huang et al. (2013a) Q. Huang, N. J. Alvarez, Y. Matsumiya, H. K. Rasmussen, H. Watanabe, and O. Hassager, ACS Macro Letters 2, 741 (2013a).
- Huang et al. (2013b) Q. Huang, O. Mednova, H. K. Rasmussen, N. J. Alvarez, A. L. Skov, K. Almdal, and O. Hassager, Macromolecules 46, 5026 (2013b).
- Wingstrand et al. (2015) S. L. Wingstrand, N. J. Alvarez, Q. Huang, and O. Hassager, Physical Review Letters 115, 1 (2015).
- Marrucci (1996) G. Marrucci, Journal of Non-Newtonian Fluid Mechanics 62, 279 (1996).
- Mead et al. (1995) D. W. Mead, D. Yavich, and L. G. Leal, Rheologica Acta 34, 360 (1995).
- Mead et al. (1998) D. W. Mead, R. G. Larson, and M. Doi, Macromolecules 31, 7895 (1998).
- Marrucci and Ianniruberto (2004) G. Marrucci and G. Ianniruberto, Macromolecules 37, 3934 (2004).
- Likhtman (2005) A. E. Likhtman, Macromolecules 38, 6128 (2005).
- Baig et al. (2010) C. Baig, V. G. Mavrantzas, and M. Kröger, Macromolecules 43, 6886 (2010).
- Andreev et al. (2013) M. Andreev, R. N. Khaliullin, R. J. A. Steenbakkers, and J. D. Schieber, Journal of Rheology 57, 535 (2013).
- Ianniruberto and Marrucci (2014) G. Ianniruberto and G. Marrucci, Journal of Rheology 58, 89 (2014).
- Ianniruberto et al. (2012) G. Ianniruberto, A. Brasiello, and G. Marrucci, Macromolecules 45, 8058 (2012).
- Yaoita et al. (2012) T. Yaoita, T. Isaki, Y. Masubuchi, H. Watanabe, G. Ianniruberto, and G. Marrucci, Macromolecules , 1 (2012).
- Costanzo et al. (2016) S. Costanzo, Q. Huang, G. Ianniruberto, G. Marrucci, O. Hassager, and D. Vlassopoulos, Macromolecules 49, 3925 (2016).
- Sridhar et al. (2013) T. Sridhar, M. Acharya, D. A. Nguyen, and P. K. Bhattacharjee, Macromolecules 47 (2013), 10.1021/ma401213r.
- Likhtman et al. (2007) A. E. Likhtman, S. K. Sukumaran, and J. Ramirez, Macromolecules 40, 6748 (2007).
- Cao and Likhtman (2015) J. Cao and A. E. Likhtman, ACS Macro Letters 4, 1376 (2015).
- Xu et al. (2018) W.-S. Xu, J.-M. Y. Carrillo, C. N. Lam, B. G. Sumpter, and Y. Wang, ACS Macro Letters , 190 (2018).
- Kroger et al. (1997) M. Kroger, C. Luap, and R. Muller, Macromolecules 30, 526 (1997).
- Daivis et al. (2003) P. J. Daivis, M. L. Matin, and B. D. Todd, Journal of Non-Newtonian Fluid Mechanics 111, 1 (2003).
- Dobson (2014) M. Dobson, The Journal of Chemical Physics 141, 184103 (2014), arXiv:1408.7078 .
- Nicholson and Rutledge (2016) D. A. Nicholson and G. C. Rutledge, Journal of Chemical Physics 145 (2016), 10.1063/1.4972894.
- Kremer and Grest (1990) K. Kremer and G. S. Grest, The Journal of Chemical Physics 92, 5057 (1990).
- Plimpton (1995) S. Plimpton, Journal of Computational Physics 117, 1 (1995).
- Moreira et al. (2015) L. A. Moreira, G. Zhang, F. Müller, T. Stuehn, and K. Kremer, Macromolecular Theory and Simulations 24, 419 (2015).
- Auhl et al. (2003) R. Auhl, R. Everaers, G. S. Grest, K. Kremer, and S. J. Plimpton, The Journal of Chemical Physics 119, 12718 (2003).
- Dealy and Larson (2006) J. Dealy and R. Larson, “Structure and rheologyof molten polymers: From structure to flow bahavior and back again,” (2006).
- Hsu and Kremer (2016) H.-P. Hsu and K. Kremer, The Journal of Chemical Physics 144, 154907 (2016), arXiv:1604.00245 .
- Ge et al. (2014) T. Ge, M. O. Robbins, D. Perahia, and G. S. Grest, Physical Review E - Statistical, Nonlinear, and Soft Matter Physics 90, 1 (2014), arXiv:1407.3198 .
- Doi (1983) M. Doi, Journal of Polymer Science: Polymer Physics Edition 21, 667 (1983).
- Hou et al. (2010) J. X. Hou, C. Svaneborg, R. Everaers, and G. S. Grest, Physical Review Letters 105, 1 (2010), arXiv:1002.2146 .
- Note (1) Marrucci and Ianniruberto proposed a theory predicting based on an inter-chain tube pressure. However, the dynamics of their theory predicts a cross-over to this scaling controlled by . This cannot describe our data which shows only depends on for .
- Rubinstein and Colby (2003) M. Rubinstein and R. H. Colby, Polymer Physics, Vol. 23 (Oxford university press New York, 2003).
- Everaers et al. (2004) R. Everaers, S. K. Sukumaran, G. S. Grest, C. Svaneborg, A. Sivasubramanian, and K. Kremer, Science 303, 823 (2004).
- Kröger (2005) M. Kröger, Computer Physics Communications 168, 209 (2005).
- Tzoumanekas and Theodorou (2006) C. Tzoumanekas and D. N. Theodorou, Macromolecules 39, 4592 (2006), arXiv:0602555 [cond-mat] .
SA. Transient Viscosity
Figure S1 shows how the extensional viscosity evolves with time as polymers are elongated from equilibrium random coils into their steady state conformations at to . Results are presented for two melts with the same , but different lengths and entanglement lengths, for M1 and for M2. In all cases, the viscosity increases over several decades in time before approaching an asymptotic steady-state value . As predicted by tube theory, the two melts have nearly the same scaled response at the lowest rates, and . Moreover, the simulations approach the analytic prediction for linear response from the tube model with (thick black line).
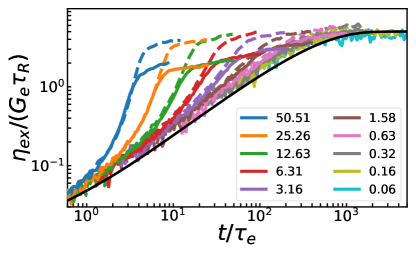
As increases, the viscosity grows more rapidly with time than the linear response curve and approaches a new steady-state viscosity at progressively earlier times. The two melts show identical initial deviations from linear response at each , but approach different steady state viscosities. They also exhibit one puzzling aspect of experimental data, the variation of with is qualitatively different for different polymers Sridhar et al. (2013); Wingstrand et al. (2015). Here M1 shows a substantial decrease of with increasing , while this shear thinning is nearly absent for at this .
The linear viscoelastic envelope (LVE) shown in Fig. S1 is derived with the field theory of Likthman and McLeish for monodisperse, linear polymers Likhtman and McLeish (2002). The theory has three parameters: the entanglement time , the entanglement modulus , and the number of entanglements per chain . We do not fit these parameters to match the analytic theory to our simualtions. Instead, we use the values for and measured in previous MD simulation studies Ge et al. (2014); Moreira et al. (2015); Hsu and Kremer (2016). The agreement between simulations and the analytic model supports our use of coarse-grained MD to study entangled polymer rheology.
SB. Chain Configurations in Steady State
Fig. S2 shows typical chain conformations for an M2 melt with Z=9 in steady-state flows with the indicated . We select the shown conformations by calculating the steady-state distribution of end-end distances for each and selecting a chain with .
SC. Steady Orientation and Longest Relaxation Time
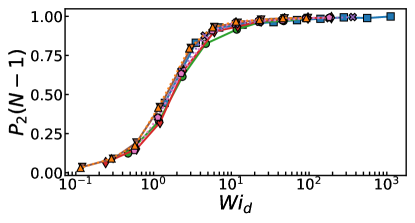
The end-end scale orientation of an entangled polymer chain relaxes back to an isotropic equilibrium state after the disentanglement time . The disentanglement time is the longest relaxation time for an entangled polymer and is the dominate time-scale entering the Newtonian viscosity. An expression for that includes fluctuations in contour length was derived by Doi and later refined by Likhtman et al. Doi (1983); Likhtman and McLeish (2002):
| (2) |
Fig. S3 plots versus for all melts and . All data collapse onto a universal curve which shows a rapid increase in orientation at . Note, this expression neglects the diffusion of the neighboring chains forming the confining tube. A recent MD study of similar systems found accounting for these effects with the “double reptation” approximation accurately described melt viscoelasticity Hou et al. (2010). This approximation would decrease in Eq. 2 by about a factor of 2 for all melts.
SD. Measuring Changes in the Tube Radius
Since the confinement of chains by entanglements is a dynamic many-body effect, a tube radius cannot be uniquely determined from single chain statistics. Past work on the Kremer-Grest model has used a variety of techniques to analyze the confining tube using primitive path analysis or geometric annealing. This work provides values of , and the equilibrium tube diameter , where is the rms length of segments of monomers. The value of stops being a useful measure of confinement once chains are extended by flow. Changes in are dominated by the increase in the length along extension, while the tube radius is associated with fluctuations about the primitive path in the perpendicular directions. There is still debate about how to extend primitive path methods to highly aligned chains, but the tube radius should still scale with perpendicular fluctuations of segments of length . Measuring these fluctuations becomes simpler at high where the tube is aligned with the extensional axis. We considered three measures of tube radius that scale with the equilibrium tube radius at low rates and measure deviations from the extensional axis at high rates. As we show here, they all give similar results for the decrease in tube radius with .
In Figure 2(d) of the main text we plot a measure of the tube radius based on fluctuations of monomers perpendicular to the end-end vector of segments of length . The fluctuation depends on the chemical distance from the start of the segment and must go to zero at both ends. For Gaussian chains, the maximum fluctuation occurs at and is equal to .
Average fluctuation profiles for each bead in an entanglement segment are shown for M1 (lines) and M2 (dashes) melts at low and high in Figure S4. Fluctuations are scaled by the equilibrium value at and is scaled by . At low rates, the profiles for M1 and M2 are both close to equilibrium results. As increases, the profiles flatten and decreases, signalling a narrowing of the tube. In Fig. 2(d) of the main text we plot ratios of the average of over the middle of each segment (shaded region in Fig. S4), corresponding to the inner 6 and 10 beads for M1 and M2, respectively. This improves our statistics and has negligible effect on the plotted ratios because the profiles are flat in the center and the residual curvature produces similar decreases at all .
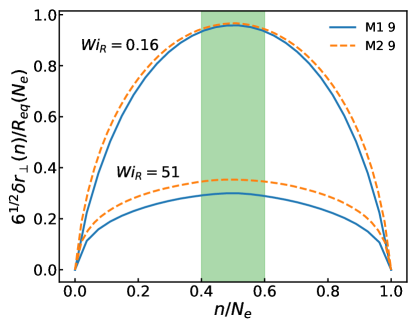
Figure S5 compares the behavior of to two other measures. One is the length of the projection of segments with monomers perpendicular to the extensional axis. Another is the average minor radius of gyration of a segment with beads. is the sum of the two smallest eigenvalues of a segment’s radius of gyration tensor. The ratio of the tube diameters from these measures to the equilibrium tube diameter is readily computed for equilibrium Gaussian chains. One finds: , and .
Fig. S5(a) shows that all three measures of tube diameter approach the equilibrium value at low rates and show similar decreases with rate for . We chose to present results for in the main text because it is closest to the equilibrium tube radius at low , is consistent with there being relatively little change in tube geometry for and intermediate between the other measures.
Fig. S5(b) shows normalized by its equilibrium value as in Fig. 2(d) of the main text. Also shown are and . When scaled by a single constant, all the results collapse for and show the same power law scaling. The only difference between the measures is the amount of change at , and the limiting low rate values differ by less than 20%.
SE. Tube Theory Scaling for Steady Extensional Viscosity
Reptation theory predicts the scaled viscosity for M1 and M2 melts with the same should coincide as . This is verified by Figure S6(a), which plots the steady viscosity for all melts in the reduced units of tube theory. M1 and M2 data with the same coincide in the Newtonian limit. At high , data for M1 and M2 separate onto two model specific curves, corresponding to the cross over to the high rate scaling discussed in the main text and replotted in Figure S6(b).
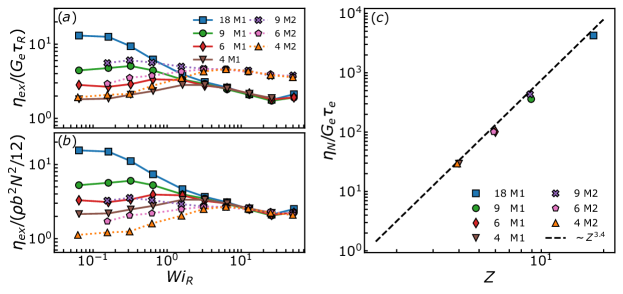
We also verify that scales approximately as for our systems, as predicted by tube theory for well entangled melts. Figure S6(c) plots the scaled Newtonian viscosity against for all melts. A power law is indicated by the black dashed line.