Excessive Noise as a Test for Many-Body Localization
Abstract
Recent experimental reports suggested the existence of a finite-temperature insulator in the vicinity of the superconductor-insulator transition. The rapid decay of conductivity over a narrow temperature range was theoretically linked to both a finite-temperature transition to a many-body-localized state, and to a charge-Berezinskii Kosterlitz Thouless transition. Here we report of low-frequency noise measurements of such insulators to test for many body localization. We observed a huge enhancement of the low-temperatures noise when exceeding a threshold voltage for nonlinear conductivity and discuss our results in light of the theoretical models.
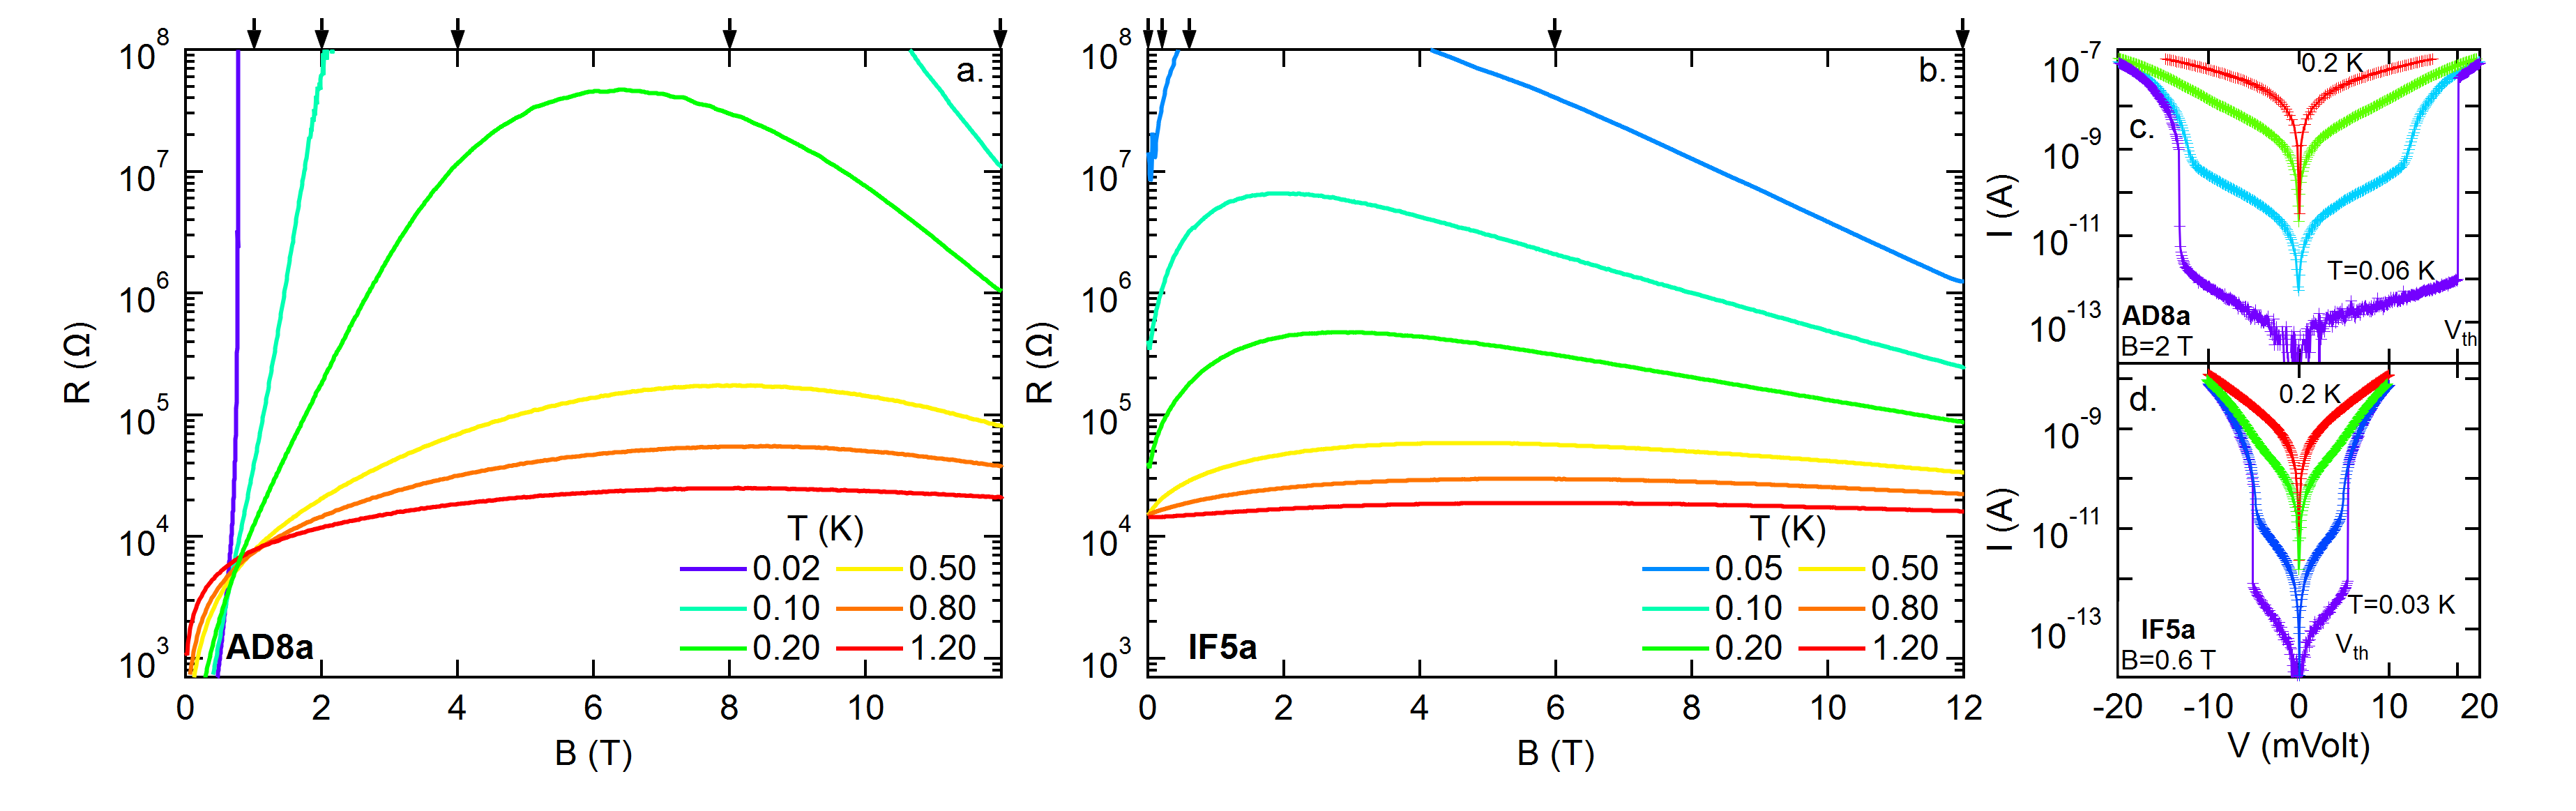
In certain thin-film superconductors, superconductivity is terminated by a transition to an insulating phase. This superconductor to insulator transition (SIT) can be experimentally driven by a variety of external parameters (for a review see Ref. Gantmakher and Dolgopolov (2010)). In some cases, the SIT is followed by a strong insulating behavior, spanning a finite range of magnetic field (), exhibiting an ”insulating peak” Paalanen et al. (1992); Gantmakher et al. (1996); Sambandamurthy et al. (2004); Nguyen et al. (2009); Baturina et al. (2007) (see Fig. 1a,b). Several theoretical works Fisher (1990); Dubi et al. (2007); Pokrovsky et al. (2010); Feigel’man et al. (2010); Bouadim et al. (2011); Müller (2013), supported by experimental evidence Gantmakher et al. (1998); Sambandamurthy et al. (2004); Steiner and Kapitulnik (2005); Baturina et al. (2007); Crane et al. (2007); Sacépé et al. (2008); Nguyen et al. (2009); Kopnov et al. (2012); Sherman et al. (2012); Sacépé et al. (2015), associate this peak with the localization of Cooper-pairs, terming this state a Cooper-pair insulator (CPI).
Close to the -driven SIT, the insulating phase of amorphous indium oxide (a:InO) thin-films exhibits faster-than-activated temperature () dependence of the sheet-resistance () as the conductivity approaches zero at a finite- Ovadia et al. (2015). This novel transition into a finite- insulating state gives way, at higher ’s, to sub-activated behavior consistent with the Efros-Shklovskii variable range hopping (VRH) mechanism of transport Efros and Shklovskii (1975).
Qualitatively similar results were recently obtained from NbTiN thin-films Mironov et al. (2018). The authors of Ref. Mironov et al. (2018) relate the rapid decay in conductivity, at low ’s, to a charge-Berezinskii Kosterlitz Thouless (charge-BKT) transition Mooij et al. (1990), basing their analysis on the notion of vortex-charge duality Fisher (1990) that is predicted to govern the -driven SIT in two-dimensional films. In this scenario, which is dual to the vortex-BKT transition in superconducting thin-films Berezinskiĩ (1972); Kosterlitz and Thouless (1972); Beasley et al. (1979), charge anti-charge unbinding above a critical () constitutes the main contribution of the measured conductivity thus explaining its rapid decay as approaches . It is interesting to note that in a:InO thin-films, the faster-than-activated insulating behavior severely violates duality-symmetry at low ’s Ovadia et al. (2013); Tamir et al. (2017).
An alternative explanation for the precipitous drop of conductivity at a well-defined follows advancements in the field of many body localization (MBL). In 2005 it was shown Gornyi et al. (2005); Basko et al. (2006) that a system of isolated interacting electrons can undergo a finite- transition to a non-ergodic insulating MBL state. Basko, Aleiner and Altshuler (BAA) later proposed Basko et al. (2007) that this transition can also be observed in real, disordered, systems provided that the unavoidable electron-phonon (e-ph) coupling is sufficiently weak. In such a case, BAA argued, the MBL transition will manifest itself in nonlinear, bistable, current-voltage characteristics (’s). Their theory further predicts a dramatic enhancement of the nonequilibrium current noise near the finite- transition.
Nonlinear, bistable, ’s were indeed observed in the low- ( K) insulating phase of a:InO thin-films Sambandamurthy et al. (2005) (see Fig. 1c,d), as well as in other CPI’s Ladieu et al. (1996); Baturina et al. (2007); Mironov et al. (2018). These nonlinearities are associated Ovadia et al. (2009) with an electron-overheating model that was introduced in Ref. Altshuler et al. (2009). Within this model, under the application of external power () at low ’s, when the e-ph thermalization is ineffective, the electrons self-thermalize to a well defined () much greater than that of the host phonons. The nonlinear ’s are then related to changes in the strong -dependence of which maintains an Ohmic relation: . At even lower ’s, above some threshold (), discontinuities result from bistable solutions of the heat balance equation:
where is the e-ph coupling strength, the sample volume, and the power , calculated for metals in the dirty limit Schmid (1974), is found in experiment Ovadia et al. (2009). The success of this theoretical description Ovadia et al. (2009); Levinson et al. (2016) provides an essential indication that at low ’s the electrons in our disordered a:InO thin-films are decoupled from the phonons.
To further investigate the feasibility of aforementioned theoretical possibilities we conducted a low-frequency ( kHz) noise study. Here we report the results of our extensive low- current power-spectral-density () measurements performed in the insulating phase of a:InO thin-films as a function of different control parameters. Our main observation is a huge enhancement of when driving the system out of equilibrium and above .
The results presented in this Letter are mainly obtained from two a:InO thin-films, IF5a and AD8a Noi (a). IF5a is insulating at while AD8a is driven into an insulating phase by increasing above a critical value, T (see Fig. 1a,b where we plot vs isotherms obtained from both samples). The insulating peak, indicative of CPI’s Sacépé et al. (2015), is observed in both samples.
The noise measured at relatively high ’s ( K) can be fully explained considering noise sources generated by our experimental setup (for further discussion see Supplementary information). The total signal measured in this case can be described using the following form:
| (1) |
where is the sample differential resistance and is the real part of the sample and measurement-wires parallel-impedance combination. At low-’s . The first term in Eq. 1 is the thermal noise, intrinsic to any resistive sample Johnson (1928); Nyquist (1928) and independent of (”white noise”). All other terms are related to our measurement setup. Note that different units are used: [A/], [V/] and [A] .
At lower ’s our results are dramatically different. Initially, at ’s below , we are unable to detect any noise above the instrumental noise (described by Eq. 1). Above the picture discontinuously transforms as the measured noise exhibits two successive signals separated by a narrow peak. The amplitude of the first signal (at Hz) follows the sharp decrease in that is observed above (in accordance with the last term of Eq. 1). The appearance of an orders of magnitude increase in , over a narrow -range, followed by the second decay is however unexpected. This observation is the focus of this Letter.
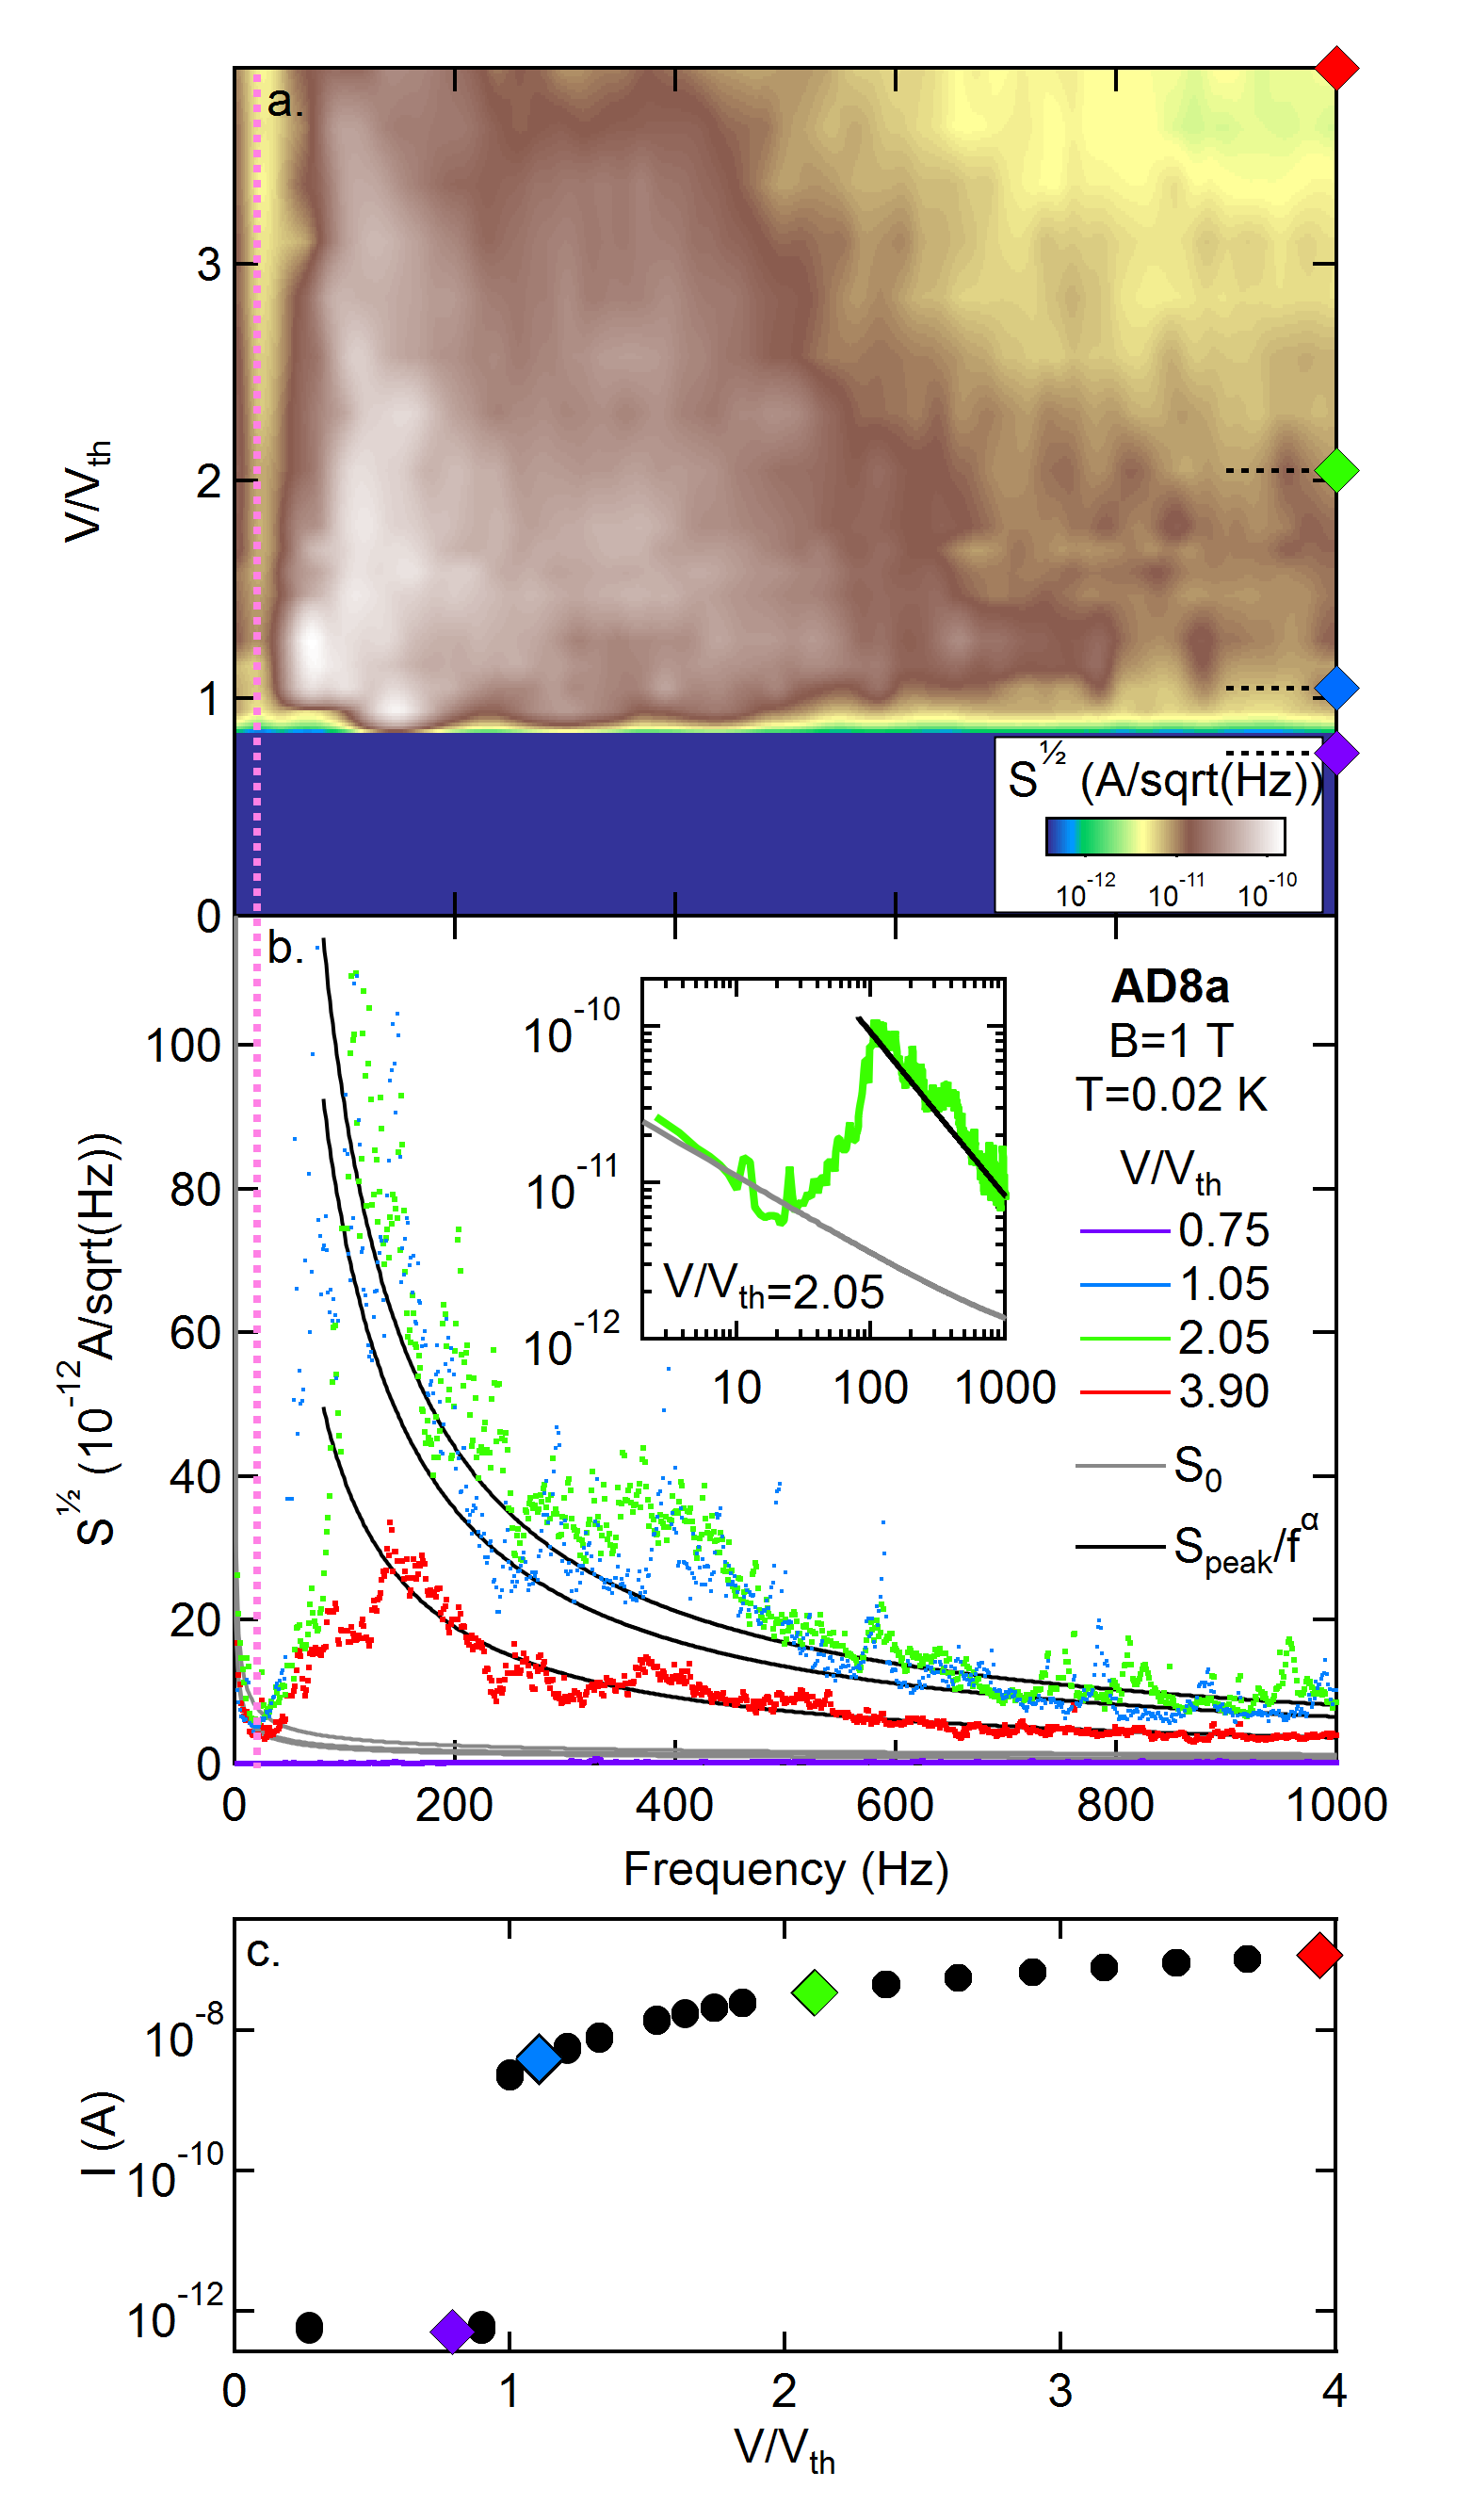
Typical low- results are shown in Fig. 2a where we present a color map of the amplitude spectral density () vs. both and . The data in the figure were obtained from AD8a at T and K. For reference we plot the, simultaneously measured, in Fig. 2c. To better illustrate the frequency dependence of the data we plot, in Fig. 2b, four curves (dots) measured at several constant ’s. Our best fits to Eq. 1 (solid gray lines) fail in describing the data. In fact, our data only follows Eq. 1 over a narrow -range (left to the dashed pink line). At higher ’s the data can be phenomenologically described by (solid black lines), where is some fit parameter. To further stress the power-law dependence of we re-plot, in the inset of Fig. 2b, the data adopting a log-log plot. Power-law dependences in such a plot appear as straight lines.
Before we continue our analysis, we note that -discontinuities alone do not necessarily produce the measured noise spectra. In a control experiment that we conducted in the same experimental setup under similar conditions, but using a two-dimensional electron system residing in a Si-MOSFET that also exhibit discontinuous ’s, we did not detect any excessive noise. The results obtained form this experiment are presented in Fig. S4 of the Supplementary information.
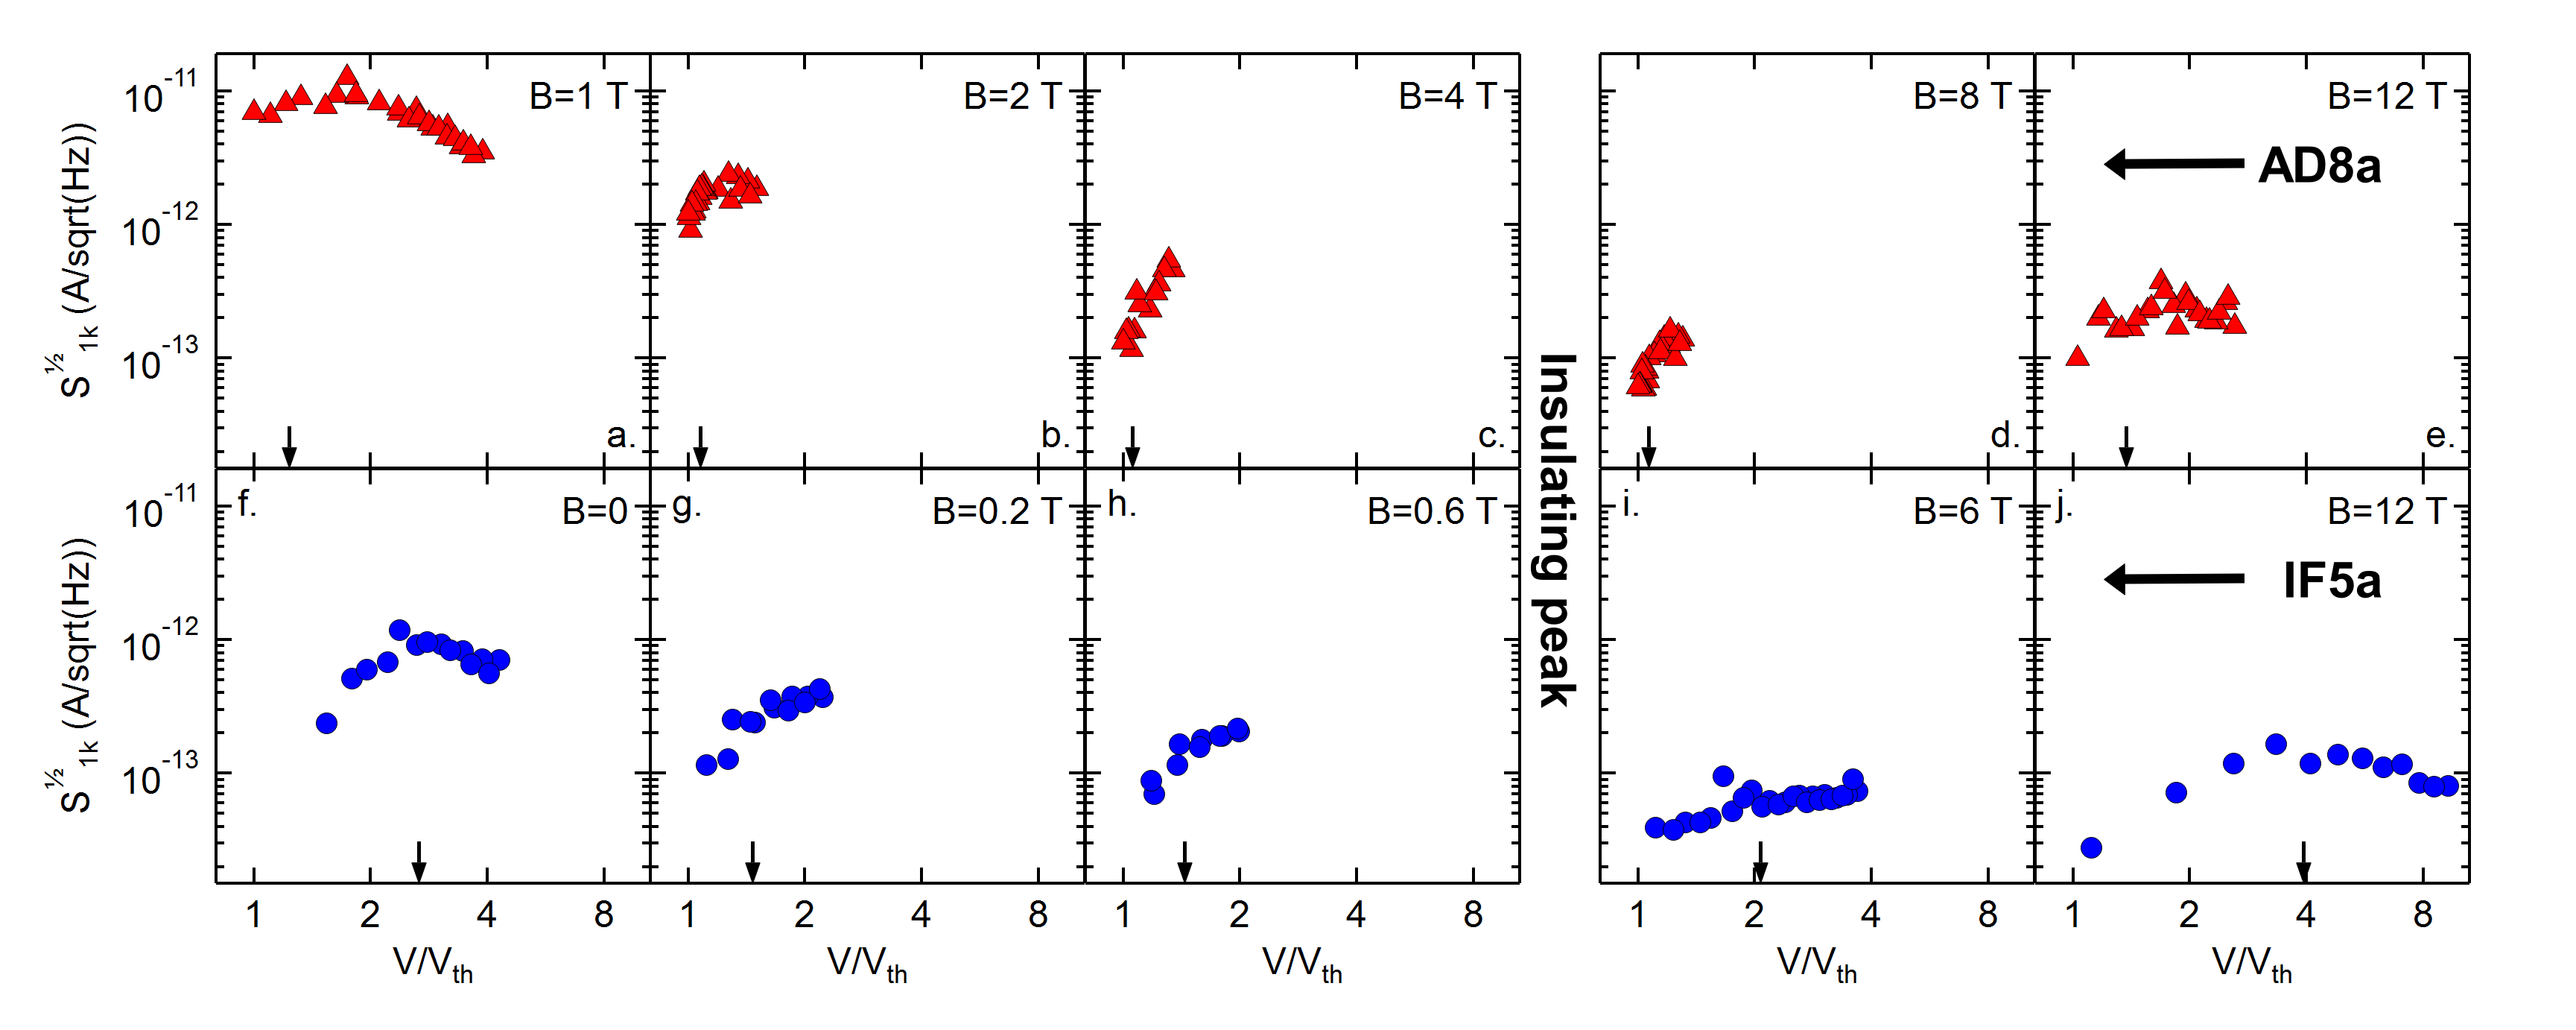
To facilitate a quantitative analysis of our results we define to be the excessive noise evaluated at 1 kHz, . While the peak amplitude of the noise would have been a more obvious choice, it exhibits non-trivial and time dependent fluctuations. Using our definition of we are able to described the measured data with high fidelity (see Supplementary information Fig. S5). Several observations are now made possible. In Fig. 3 we present log-log plots of vs. (normalized by Noi (b)) obtained from both samples at various ’s spanning both sides of the insulating peak (indicated by the arrows in Fig. 1a,b). Both samples exhibit qualitatively similar behavior: is detected only above , initially increasing with . Further increase of is followed by a decrease in , and, at even higher ’s, drops below our measurement sensitivity (see Supplementary information Fig. S5).
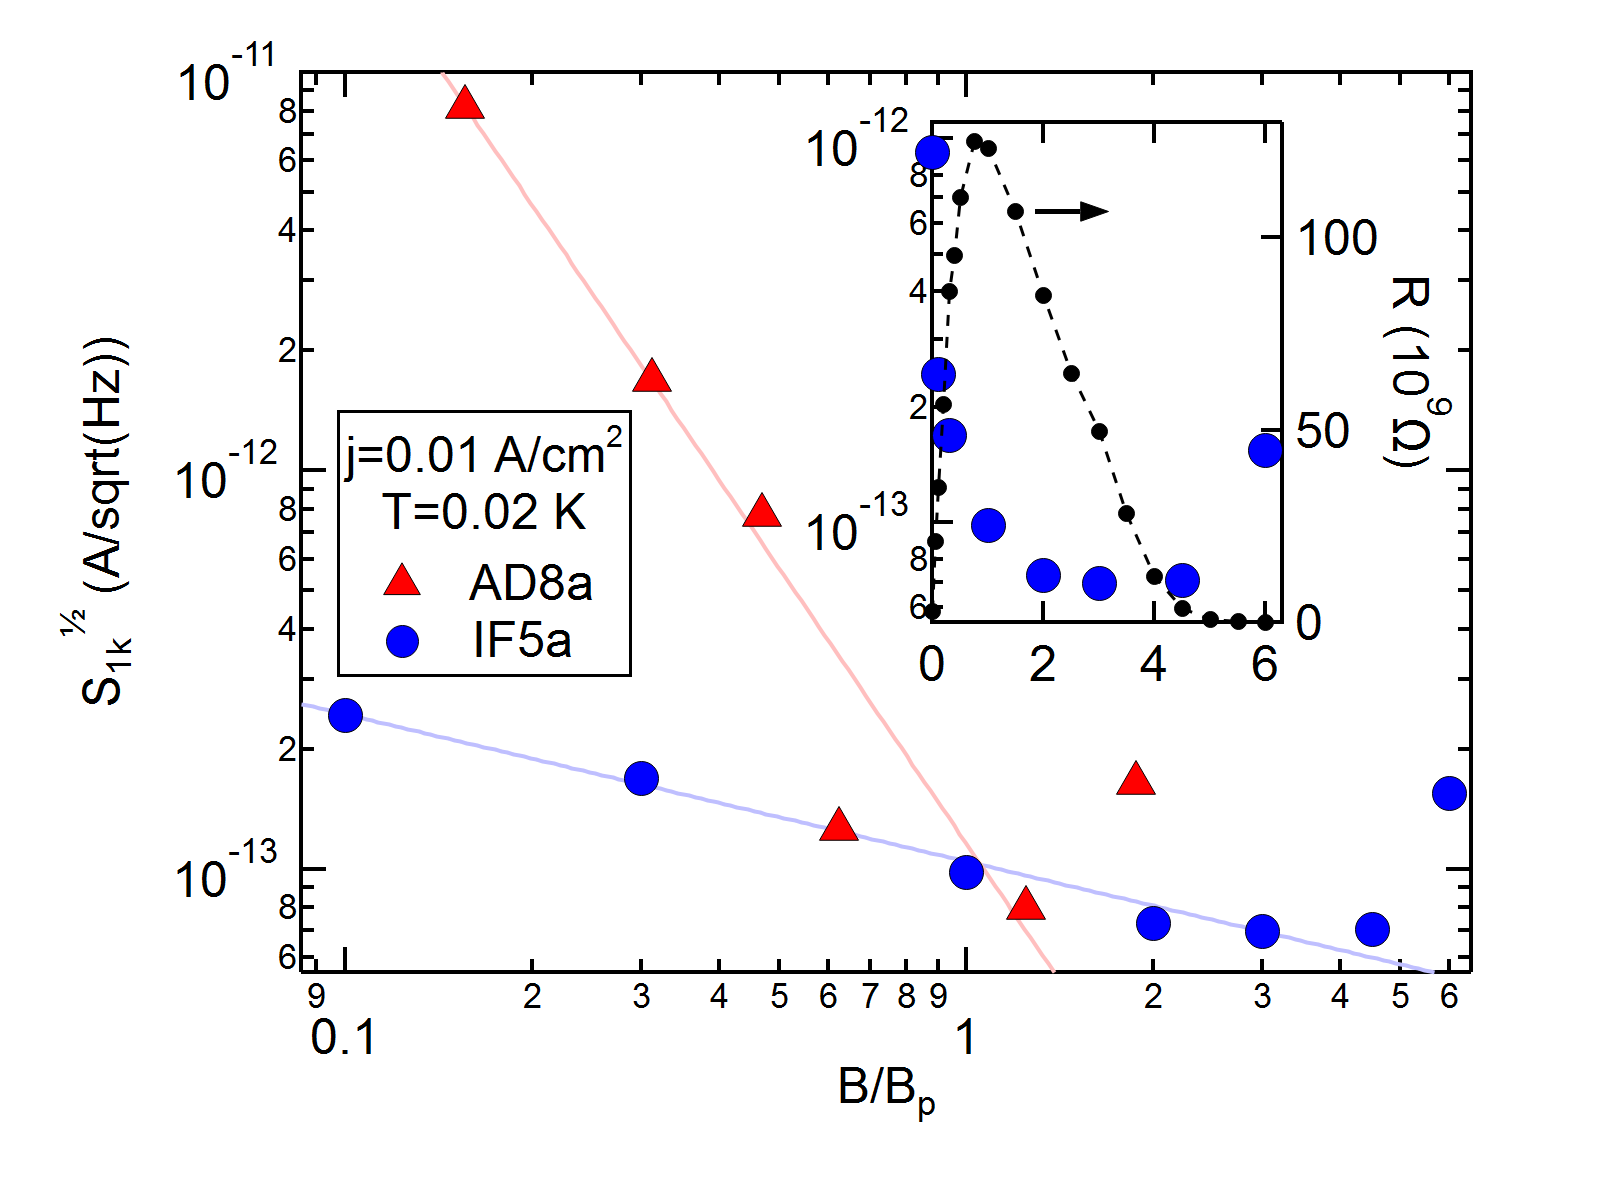
Next we address the dependence of . Comparing the two samples, in Fig. 4 we present a log-log plot of vs. , normalized by the estimated value of the insulating peak (), evaluated at a constant -density, A/cm2 Noi (c). We find that, for both samples, decreases with (solid lines are guides for the eyes) for all but the highest ’s. It is worth noting that does not follow the trend set by the insulating peak. This is demonstrated in the inset of Fig. 4 where we plot vs. (black circles, right axis), obtained from the sample IF5a at K, alongside (blue circles, left axis) adopting a semi-log plot such that the data is also apparent.
We now wish to discuss our results in light of the theoretical models. Electron-overheating is unlikely the source of our observations since it is expected to manifest as a thermal, white, noise Arai (1983); Wellstood et al. (1994). However, the data do not rule out electron-overheating in our system because the expected amplitude of this thermal noise component is below our sensitivity level.
The huge enhancement of above supports a finite- transition to an insulating MBL state following BAA prediction Basko et al. (2007). Furthermore, qualitatively similar spectral noise signature observed in superconducting films are related to vortex antivortex annihilation avalanches Eggenhöffner et al. (2005). Analogously, our observation can indicate the occurrence of avalanche processes further supporting the possibility of a transition to an MBL state where avalanches are expected to occur near the finite- transition as many-electron cascades predominate the transport. On the other hand, approaching the transition (by decreasing ), these cascades should involve more electrons and take longer times. Consequently, the peak in the power spectral density would shift to lower frequencies Eggenhöffner et al. (2005). This reduction in peak is not supported by our measurements as is demonstrated in Fig. 2b. We are also unsure whether MBL can account for the excessive noise observed at high ’s where VRH dominates the transport. Finally, while we are unaware of any predictions suggesting noise enhancement as a result of the charge-BKT transition, relating our results to avalanche processes of charge anti-charge annihilations is tempting. A detailed understanding of this scenario awaits further theoretical developments.
In summary, we performed a set of low- noise measurements in the disorder- and -driven insulating phases of a:InO thin films. These measurements were devised as a test for a possible MBL transition previously suggested to govern the low- transport in such films. Above we observed a sharp peak in which we attribute to the occurrence of avalanche processes that are dominating the conductivity. While this observation supports an MBL transition some discrepancies still prevent us from concluding the transition to such novel state, or excluding the possibility of a charge-BKT transition, without further theoretical and experimental considerations.
Acknowledgments
We are grateful to I. Aleiner, B. Altshuler, M. Feigelman, A. Finkel’stein, and K. Michaeli for fruitful discussions. We are particularly grateful to D. Basko for valuable comments regarding MBL. This work was supported by the Israeli Science Foundation (ISF) Grant No. 751/13 and the Minerva Foundation, Federal German Ministry for Education and Research, Grant No. 712942. We also acknowledge the support provided by The Leona M. and Harry B. Helmsley Charitable Trust.
References
- Gantmakher and Dolgopolov (2010) V. F. Gantmakher and V. T. Dolgopolov, Phys.-Usp. 53, 1 (2010).
- Paalanen et al. (1992) M. A. Paalanen, A. F. Hebard, and R. R. Ruel, Phys. Rev. Lett. 69, 1604 (1992).
- Gantmakher et al. (1996) V. F. Gantmakher, M. V. Golubkov, J. G. S. Lok, and A. K. Geim, JETP 82, 951 (1996).
- Sambandamurthy et al. (2004) G. Sambandamurthy, L. W. Engel, A. Johansson, and D. Shahar, Phys. Rev. Lett. 92, 107005 (2004).
- Nguyen et al. (2009) H. Q. Nguyen, S. M. Hollen, M. D. Stewart, J. Shainline, A. Yin, J. M. Xu, and J. M. Valles, Phys. Rev. Lett. 103, 157001 (2009).
- Baturina et al. (2007) T. I. Baturina, A. Y. Mironov, V. M. Vinokur, M. R. Baklanov, and C. Strunk, Phys. Rev. Lett. 99, 257003 (2007).
- Fisher (1990) M. P. A. Fisher, Phys. Rev. Lett. 65, 923 (1990).
- Dubi et al. (2007) Y. Dubi, Y. Meir, and Y. Avishai, Nature 449, 876 (2007).
- Pokrovsky et al. (2010) V. L. Pokrovsky, G. M. Falco, and T. Nattermann, Phys. Rev. Lett. 105, 267001 (2010).
- Feigel’man et al. (2010) M. Feigel’man, L. Ioffe, V. Kravtsov, and E. Cuevas, Annals of Physics 325, 1390 (2010).
- Bouadim et al. (2011) K. Bouadim, Y. L. Loh, M. Randeria, and N. Trivedi, Nat. Phys. 7, 884 (2011).
- Müller (2013) M. Müller, EPL (Europhysics Letters) 102, 67008 (2013).
- Gantmakher et al. (1998) V. F. Gantmakher, M. V. Golubkov, V. T. Dolgopolov, G. E. Tsydynzhapov, and A. A. Shashkin, JETP Lett. 68, 363 (1998).
- Steiner and Kapitulnik (2005) M. Steiner and A. Kapitulnik, Physica C: Superconductivity 422, 16 (2005), ISSN 0921-4534.
- Crane et al. (2007) R. Crane, N. P. Armitage, A. Johansson, G. Sambandamurthy, D. Shahar, and G. Grüner, Phys. Rev. B 75, 184530 (2007).
- Sacépé et al. (2008) B. Sacépé, C. Chapelier, T. I. Baturina, V. M. Vinokur, M. R. Baklanov, and M. Sanquer, Phys. Rev. Lett. 101, 157006 (2008).
- Kopnov et al. (2012) G. Kopnov, O. Cohen, M. Ovadia, K. H. Lee, C. C. Wong, and D. Shahar, Phys. Rev. Lett. 109, 167002 (2012).
- Sherman et al. (2012) D. Sherman, G. Kopnov, D. Shahar, and A. Frydman, Phys. Rev. Lett. 108, 177006 (2012).
- Sacépé et al. (2015) B. Sacépé, J. Seidemann, M. Ovadia, I. Tamir, D. Shahar, C. Chapelier, C. Strunk, and B. A. Piot, Physical Review B 91, 220508 (2015).
- Ovadia et al. (2015) M. Ovadia, D. Kalok, I. Tamir, S. Mitra, B. Sacépé, and D. Shahar, Scientific Reports 5, 13503 (2015).
- Efros and Shklovskii (1975) A. L. Efros and B. I. Shklovskii, J. Phys. C 8, L49 (1975).
- Mironov et al. (2018) A. Y. Mironov, D. M. Silevitch, T. Proslier, S. V. Postolova, M. V. Burdastyh, A. K. Gutakovskii, T. F. Rosenbaum, V. V. Vinokur, and T. I. Baturina, Scientific reports 8, 4082 (2018).
- Mooij et al. (1990) J. E. Mooij, B. J. van Wees, L. J. Geerligs, M. Peters, R. Fazio, and G. Schön, Phys. Rev. Lett. 65, 645 (1990).
- Berezinskiĩ (1972) V. L. Berezinskiĩ, Sov. Phys. JETP 34, 610 (1972).
- Kosterlitz and Thouless (1972) J. M. Kosterlitz and D. J. Thouless, Journal of Physics C: Solid State Physics 5 (1972).
- Beasley et al. (1979) M. R. Beasley, J. E. Mooij, and T. P. Orlando, Phys. Rev. Lett. 42, 1165 (1979).
- Ovadia et al. (2013) M. Ovadia, D. Kalok, B. Sacepe, and D. Shahar, Nat. Phys 9, 415 (2013).
- Tamir et al. (2017) I. Tamir, A. Doron, T. Levinson, F. Gorniaczyk, G. C. Tewari, and D. Shahar, Phys. Rev. B 96, 104513 (2017).
- Gornyi et al. (2005) I. V. Gornyi, A. D. Mirlin, and D. G. Polyakov, Phys. Rev. Lett. 95, 046404 (2005).
- Basko et al. (2006) D. M. Basko, I. L. Aleiner, and B. L. Altshuler, Annals of Phys. 321, 1126 (2006).
- Basko et al. (2007) D. M. Basko, I. L. Aleiner, and B. L. Altshuler, Phys. Rev. B 76, 052203 (2007).
- Sambandamurthy et al. (2005) G. Sambandamurthy, L. W. Engel, A. Johansson, E. Peled, and D. Shahar, Phys. Rev. Lett. 94, 017003 (2005).
- Ladieu et al. (1996) F. Ladieu, M. Sanquer, and J. P. Bouchaud, Phys. Rev. B 53, 973 (1996).
- Ovadia et al. (2009) M. Ovadia, B. Sacepe, and D. Shahar, Phys. Rev. Lett. 102, 176802 (2009).
- Altshuler et al. (2009) B. L. Altshuler, V. E. Kravtsov, I. V. Lerner, and I. L. Aleiner, Phys. Rev. Lett. 102, 176803 (2009).
- Schmid (1974) A. Schmid, Zeitschrift für Physik 271, 251 (1974).
- Levinson et al. (2016) T. Levinson, A. Doron, I. Tamir, G. C. Tewari, and D. Shahar, Phys. Rev. B 94, 174204 (2016).
- Noi (a) IF5a is 5 squares 0.1 mm wide bar and AD8a is 2 squares 2 mm wide bar. Both are 30 nm thick. Details regarding sample fabrication can be found elsewhere Shahar and Ovadyahu (1992).
- Johnson (1928) J. B. Johnson, Phys. Rev. 32, 97 (1928).
- Nyquist (1928) H. Nyquist, Phys. Rev. 32, 110 (1928).
- Noi (b) Whenever the ’s are nonlinear but continuous we define to be in which gains its maximum.
- Noi (c) Similar dependence is also observed if, instead of evaluating at a constant , we do so at either a constant , , or .
- Arai (1983) M. R. Arai, Applied Physics Letters 42, 906 (1983).
- Wellstood et al. (1994) F. C. Wellstood, C. Urbina, and J. Clarke, Phys. Rev. B 49, 5942 (1994).
- Eggenhöffner et al. (2005) R. Eggenhöffner, E. Celasco, V. Ferrando, and M. Celasco, Applied Physics Letters 86, 022504 (2005).
- Shahar and Ovadyahu (1992) D. Shahar and Z. Ovadyahu, Phys. Rev. B 46, 10917 (1992).