Environmental Monitoring for Belle II
Abstract
The Belle II experiment has just started, searching for physics beyond the Standard Model in , charm and decays using data with the integrated luminosity goal of . Before the physics run with full detector system being installed, Belle II Phase 2 run is on-going at the time of the conference, until July 2018. In this presentation, we describe the environmental monitoring system with an emphasis on the software tools to help the experts and the non-expert shifters who operate the experiment. The monitoring tools are prepared on the control room especially for the shift-takers. It consists of thre components: the monitoring GUI, the alarm system, and the archiver. The monitoring GUI shows the current state of the detector and the alarm system generate warning states from monitored variables with sound and email notification. The archiver is collecting data on single server and provide collected data to the experimental collaborators.
I Introduction
To search for physics beyond the Standard Model and make precision measurements of CP violation phenomena, the Belle II experiment using the SuperKEKB collider at KEK, Tsukuba, Japan, started taking data in April, 2018. It aims for collecting a huge number of and charm meson and lepton decays, as a successor of the Belle experiment that discovered CP violation in meson decays.
The final goal of Belle II[1] integrated luminosity is to accumulate by the year 2025. Belle II and SuperKEKB are going through the commissioning stage of three phases: the Phase 1 with no Belle II detector for the acceleration commissioning which was successfully finished, the Phase 2 with the Belle II detector except for the vertex detector which is being pursued, and then the final Phase 3 run with the full detector. During the Phase 2 run period, Belle II plans to collect integrated luminosity of around until July 2018.
The Belle II detector consists of 6 subdetector systems, for which the readout systems are installed inside and around the detector. Backend readout systems reside in the Electronics Hut (Ehut) located next to the detector, where various monitoring systems are also placed. We use two backbone systems and one graphical user interface (GUI) tool to distribute and share the monitoring information: a custom-made Network Share Memory (NSM)[2] tools, which has been used in Belle and was updated for Belle II, EPICS[3], which is widely used in high energy physics experiments, and Control System Studio (CSS)[4], with native EPICS handling and an additional plugin for NSM.
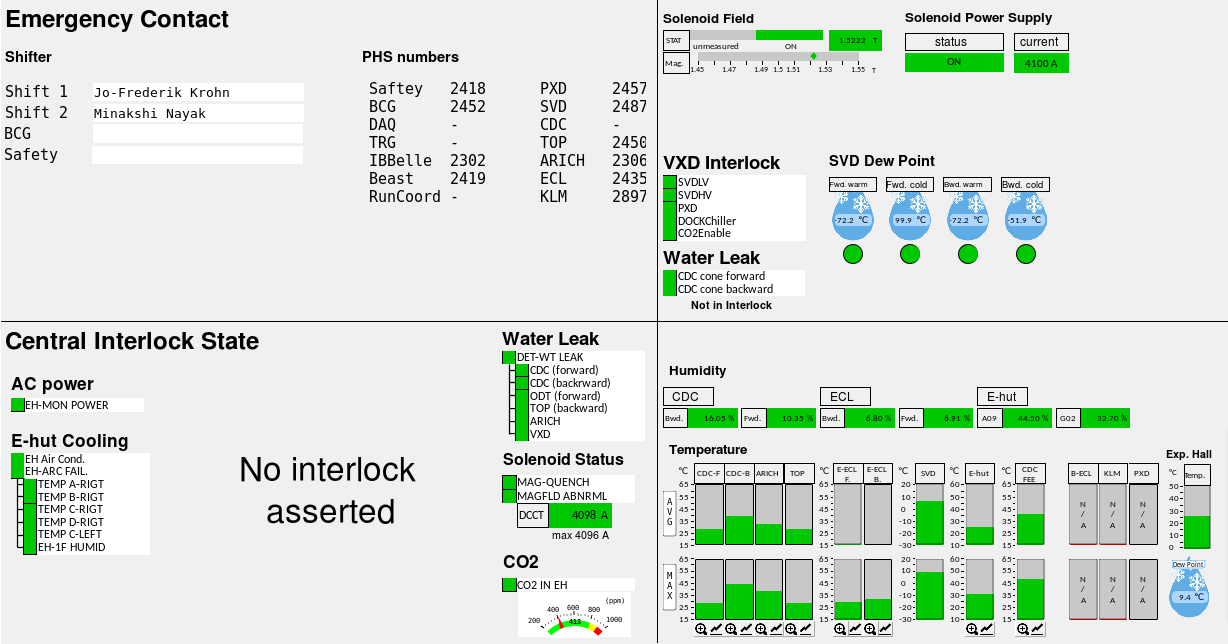
The Belle II control room is located in the underground side room of the experiment hall where the Belle detector is placed. The Belle II detector is operated by two control room shifters. In addition, a safety shifter is assigned for the safety of the experiment, and subdetector shifters take care of their subdetector systems. Our environmental monitoring tools provide the information of the detector to these shifters and store data on the central DAQ database server.
II Monitoring GUI
The monitoring GUI screens are constructed on top of the CSS platform, which is chosen for the common platform of all Belle II user interface programs including run control and slow control. These tools are used not only by the detector experts, but also for the shifters in the control room, who are most likely non-experts on the system.
The role of the monitoring GUI is to provide comprehensive information of the environmental status of the Belle II detector including as many variables yet in a visible size from a distance in a single screen. The nominal location is on a 50-inch 4K resolution monitor on the wall of the control panel. We consider the following points:
-
1.
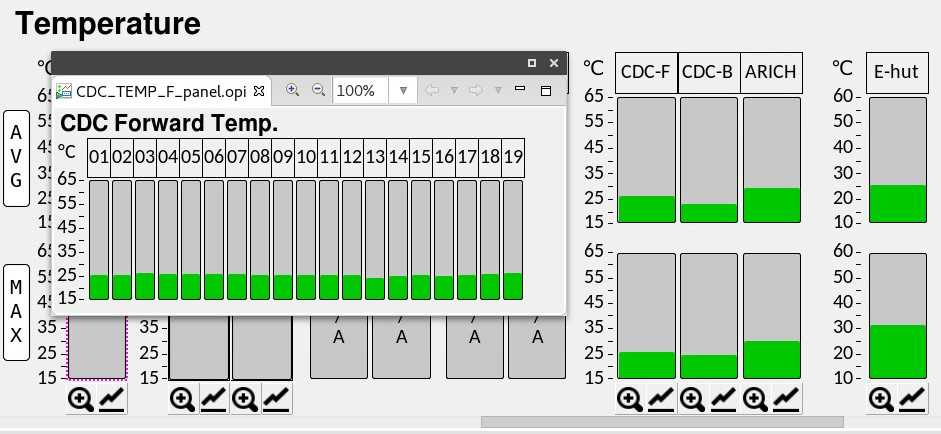
The GUI contains summarized information, e.g. average and maximum values for temperatures. In addition, small buttons are provided to display the detail information.
-
2.
Problems can be easily noticed and identified from distance. For this purpose, a unified color scheme is used. Normal, warning, and fatal states use green, orange, and red color respectively. The sizes of font and widget are well optimized to fit the control room display.
-
3.
While it can be opened on a smaller 4K monitors in front of shifters or other users. The panel is divided into regions in such a way that each region can also fit a more commonly used FullHD resolution.
III Archiver
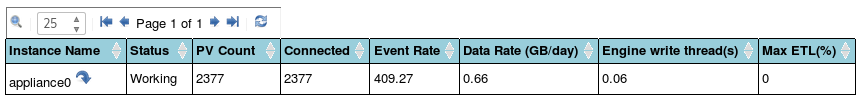
To store the detector information, provided in the form of NSM variables and EPICS process variables (PVs), we use the EPICS Archiver Appliance[5]. The archiver runs on the central DAQ database server, to record the history of various environemental variables such as temperature, humidity, magnetic field, voltage, luminosity, and so on. In order to archive NSM variables, we prepared an NSM EPICS conversion process (nsm2cad), because the EPICS Archiver Appliance can record EPICS PVs only. At this moment, the number of actively archived variables is 2377.
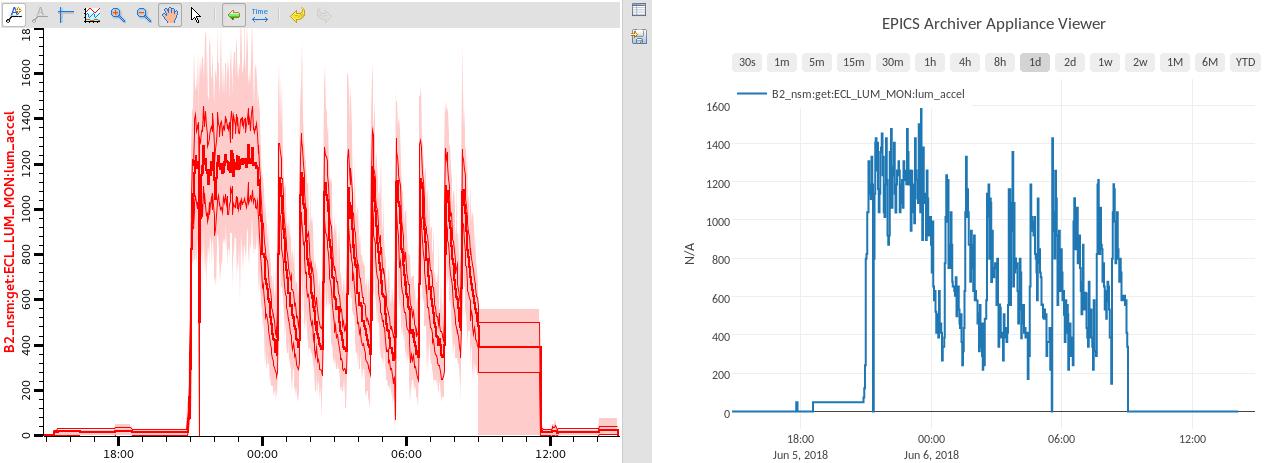
The management system (mgmt webapp) is protected by ID and password, to prevent modifications by unauthorized users. The viewer is open to anyone who can access the DAQ network. People can see the trend graphs through a web viewer or CSS. The archiver is also connected to the monitoring GUI. Button sets (small graph button in Fig. 2) are prepared so that people can easily find the trends of monitoring variables.
IV Alarm System
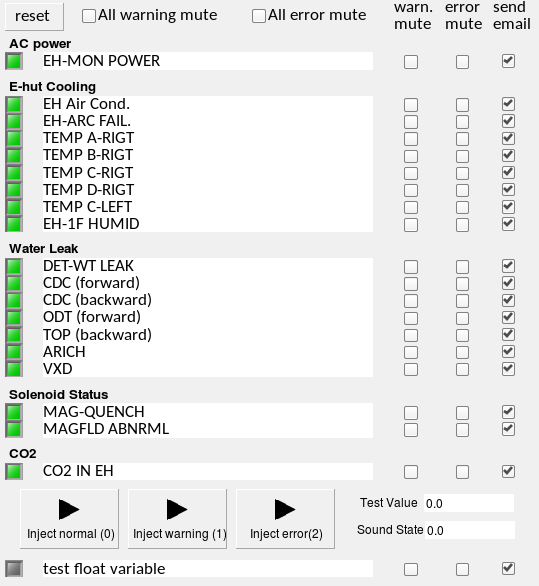
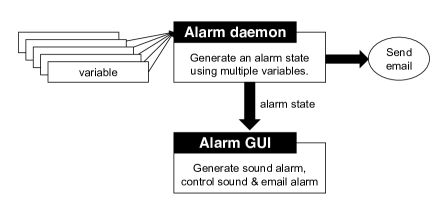
The purpose of the alarm system is to provide a sound warning for control room shifters and send email notification to subdetector experts. The alarm system is made of two parts, a daemon process and a GUI. The daemon is an NSM application, and the GUI is a CSS application.
One of the important aspects is to treat enormous number of variables. We made the alarm daemon to collect multiple values from which a single combined warning state is generated. Alarm daemons also send email notifications to each responsible expert. The warning state is sent to the GUI, and the GUI generates a sound for shifters. The GUI can include and exclude each variable for sound and email alarm.
The alarm system is in the commissioning stage. The connection between GUI and daemon-GUI works fine, while we are currently developing the alarm daemon itself.
V Conclusions and Plan
The Belle II Phase 2 operation is successfully being carried out, with the environmental monitoring tools being one of the crucial components. The monitoring tools have been improved upon various experiences during the commissioning of the Belle II detector, while there are still remaining works to be done. These will be solved before the Phase 3 operation with the fully integrated Belle II detector. Here are the action plans:
-
1.
Monitoring GUI A detection and refresh mechanism should be prepared for when the values are not updated, due to the frozen CSS panel or by a malfunction of the PC.
-
2.
Archiver A procedure to clone the archived data should be prepared, especially for use in the offline analysis. The computing resources are still available for additional PVs. The number of PVs can be increased to handle by an order of magnitude.
-
3.
Alarm System The commissioning of the alarm system should be completed. The alarm system is not used yet for the daily operation during the Phase 2 operation.
References
- [1] T. Abe et al. [Belle-II Collaboration], “Belle II Technical Design Report,” arXiv:1011.0352 [physics.ins-det].
- [2] M. Nakao and S. Y. Suzuki, “Network Shared Memory Framework for the Belle Data Acquisition Control System” IEEE Trans. Nucl. Sci. vol. 47, pp. 267 - 271, 2000.
- [3] “EPICS” [Online]. Available: https://epics.anl.gov.
- [4] “Control System Studio” [Online]. Available: http://controlsystemstudio.org.
- [5] “EPICS Archiver Appliance” [Online]. Available: https://slacmshankar.github.io/epicsarchiver_docs.