The evolution of SMBH spin and AGN luminosities for within a semi-analytic model of galaxy formation.
Abstract
Understanding how Active Galactic Nuclei (AGN) evolve through cosmic time allows us to probe the physical processes that control their evolution. We use an updated model for the evolution of masses and spins of supermassive black holes (SMBHs), coupled to the latest version of the semi-analytical model of galaxy formation galform using the Planck cosmology and a high resolution Millennium style dark matter simulation to make predictions for AGN and SMBH properties for . We compare the model to the observed black hole mass function and the SMBH versus galaxy bulge mass relation at , and compare the predicted bolometric, hard X-ray, soft X-ray and optical AGN luminosity functions to observations at , and find that the model is in good agreement with the observations. The model predicts that at and , the AGN luminosity function is dominated by objects accreting in an Advection Dominated Accretion Flow (ADAF) disc state, while at higher redshifts and higher luminosities the dominant contribution is from objects accreting via a thin disc or at super-Eddington rates. The model also predicts that the AGN luminosity function at and is dominated by the contribution from AGN fuelled by quiescent hot halo accretion, while at higher luminosities and higher redshifts, the AGN luminosity function is dominated by the contribution from AGN fuelled by starbursts triggered by disc instabilities. We employ this model to predict the evolution of SMBH masses, Eddington ratios, and spins, finding that the median SMBH spin evolves very little for .
keywords:
galaxies: high-redshift – galaxies: active – quasars: general1 Introduction
Ever since quasars were first identified to be cosmological sources (Schmidt, 1968), a key aim has been to to understand their evolution through cosmological time. Early studies showed that the number density of quasars shows strong evolution, with more luminous quasars present at than at , leading to the suggestion that quasars evolve by ‘pure luminosity evolution’ (PLE). In this scenario, quasars are long lived and fade through cosmic time, leading to an evolution in the luminosity function of only the characteristic luminosity (e.g. Boyle et al., 1990). However, more recent optical surveys, which can probe both the faint and bright end of the luminosity function, have shown not only that the slope of the luminosity function evolves (e.g. Richards et al., 2006; Croom et al., 2009), but also that the number density decreases at high redshift (e.g. Fan et al., 2001; Jiang et al., 2016). Surveys at X-ray wavelengths, show an evolution in the shape of the luminosity function (e.g. Ueda et al., 2014) as well as differences between the absorbed and unabsorbed populations (e.g. Aird et al., 2015; Georgakakis et al., 2015). Clearly, the full picture of supermassive black holes (SMBHs) and Active Galactic Nuclei (AGN) evolving through cosmological time is complicated, and requires detailed investigation. Theoretical models and cosmological simulations have allowed us to try to quantify the role of different contributing black hole fuelling mechanisms (e.g. mergers, disc instabilities) and obscuration to the AGN luminosity function (e.g. Fanidakis et al., 2012; Hirschmann et al., 2012), but we do not yet fully understand the reasons for the different features of the evolution.
The evolution of AGN through time also has significance for galaxy formation, since AGN are thought to have a dramatic effect on their host galaxies. The relativistic jets from AGN can have a strong effect on the surrounding hot gas by forming huge X-ray cavities (e.g. Forman et al., 2005; Randall et al., 2011; Blanton et al., 2011), or the AGN can drive powerful high-velocity outflows (e.g. Pounds et al., 2003; Reeves et al., 2003; Rupke & Veilleux, 2011).
The precise physical mechanism for the production of AGN jets has not yet been determined, but the two most popular mechanisms are either that the accretion flow determines the jet power (Blandford & Payne, 1982) or that the spin of the black hole determines the jet power (Blandford & Znajek, 1977). Many simulations of black hole accretion discs have been conducted to study jet formation, where black hole spin often plays a key role (e.g. Kudoh et al., 1998; Hawley & Balbus, 2002; McKinney, 2005; Hawley & Krolik, 2006; Tchekhovskoy & McKinney, 2012; Sa̧dowski et al., 2013). The importance of black hole spin has motivated observational studies to constrain black hole spin values (Brenneman & Reynolds, 2006; Chiang & Fabian, 2011; Done et al., 2013) and cosmological simulations of black hole spin evolution (Berti & Volonteri, 2008; Lagos et al., 2009; Fanidakis et al., 2011; Barausse, 2012; Dotti et al., 2013; Fiacconi et al., 2018). The latter have been used to try to understand the role of black hole mergers and accretion across cosmological time on SMBH growth and spin evolution.
Constructing a model that accounts for all the processes involved in changing SMBH spin is not a simple task - especially given the vast range of scales involved. On sub-parsec scales, the spin of the black hole affects the radius of the last stable orbit for orbiting material, and hence the radiative efficiency of the black hole. The SMBH spin can be misaligned with that of the accretion disc, causing the accretion disc to become warped, which affects how gas is accreted (Bardeen & Petterson, 1975). On larger scales it is currently unclear whether the gas accretes in an ordered manner or in a series of randomly oriented events (King et al., 2008), which affects how much the black hole spins up. On galaxy-wide scales, simulations and theoretical models predict that the SMBH may accrete gas from cold, infalling gas made available by galaxy mergers (e.g. Di Matteo et al., 2005) or by disc instabilities (e.g. Younger et al., 2008), or from gas accreted from the hot halo gas surrounding the galaxy (e.g. Bower et al., 2006). Cold streams may also supply gas to the central regions of galaxies (e.g. Khandai et al., 2012).
To be able to model all of these processes operating over all of these scales, some form of ‘sub-grid’ prescription is required to be able to model the effects going on below the numerical resolution of the calculation. Therefore, investigating SMBH spin evolution and mass growth and exploring their effects on galaxy wide scales is well suited to using a semi-analytic model of galaxy formation. Using a semi-analytic model of galaxy formation coupled with a large-volume, high-resolution dark matter simulation means that we can conduct detailed simulations within a computationally reasonable time-frame, which means that we can investigate the low redshift Universe (by comparing to observations), and can make predictions for the high-redshift Universe, with greater accuracy than previous studies using simulations.
Semi-analytic models of galaxy formation have greatly contributed to our understanding of SMBHs and AGN in galaxy formation. Bower et al. (2006) used galform with an AGN feedback prescription in which heating of halo gas by relativistic jets balance radiative cooling in the most massive haloes, to provide a match to the galaxy luminosity function at a range of redshifts, highlighting the potential importance of AGN feedback on galaxy formation. Malbon et al. (2007) extended the galform model of Baugh et al. (2005) by including SMBH growth from mergers, cold gas accreted from starbursts and from the hot halo mode introduced in Bower et al. (2006) to reproduce the quasar optical luminosity function. In Fanidakis et al. (2011), galform was updated to include an SMBH spin evolution model in which SMBH spin evolves during accretion of gas or by merging with other SMBHs. This model was then compared to observed AGN luminosity functions in the redshift range for optical and X-ray data in Fanidakis et al. (2012). Other semi-analytic galaxy formation models have also investigated SMBH growth and evolution (e.g. Lagos et al., 2008; Marulli et al., 2008; Bonoli et al., 2009; Hirschmann et al., 2012; Menci et al., 2013; Neistein & Netzer, 2014; Enoki et al., 2014; Shirakata et al., 2018) and studies have also been conducted using hydrodynamical simulations (e.g. Hirschmann et al., 2014; Sijacki et al., 2015; Rosas-Guevara et al., 2016; Volonteri et al., 2016; Weinberger et al., 2018).
In this paper, we present predictions for the evolution of SMBH and AGN properties in the redshift range , using an updated prescription for the evolution of SMBH spin within the galform semi-analytic model of galaxy formation. We include a more detailed treatment of the obscuration and compare the model predictions to more recent observational data. In a subsequent paper we will present predictions for .
This paper is organised as follows. In Section 2 we outline the galaxy formation model and the spin evolution model and in Section 3 we outline the calculation of AGN luminosities. In Section 4 we present predictions for black hole masses and spins for the model, as well as the dependence of AGN luminosities on galaxy properties. In Section 5 we show the evolution of the AGN luminosity function at different wavelengths for . In Section 6 we give concluding remarks.
2 The galaxy formation and SMBH evolution model
2.1 The galform model
To make our predictions, we use the Durham semi-analytic model of galaxy formation, galform. Building on the principles outlined in White & Rees (1978), White & Frenk (1991), and Cole et al. (1994), and introduced in Cole et al. (2000), in galform galaxies form from baryons condensing within dark matter haloes, with the assembly of the haloes described by the dark matter halo merger trees. While dark matter merger trees can be calculated using a Monte-Carlo technique that is based on the Extended Press-Schechter theory (Lacey & Cole, 1993; Cole et al., 2000; Parkinson et al., 2008), they can also be extracted from dark matter N-body simulations (Kauffmann et al., 1999; Helly et al., 2003; Jiang et al., 2014), which is the method that we follow in this paper. The baryonic physics is then modelled using a set of coupled differential equations to track the exchange of baryons between different galaxy components. The physical processes modelled in galform include: i) the merging of dark matter haloes, ii) shock heating and radiative cooling of gas in haloes, iii) star formation from cold gas, iv) photoionisation/supernova/AGN feedback, v) the chemical evolution of gas and stars, vi) galaxies merging in haloes due to dynamical friction, vii) disc instabilities viii) the evolution of stellar populations, and ix) the extinction and reprocessing of stellar radiation by dust. For a detailed description of the physical processes involved, see Lacey et al. (2016) and references therein.
In this paper we update the model for SMBHs and AGN presented in Fanidakis et al. (2011), superceding the equations in that paper, which contained some typographical errors, and also putting special emphasis on improving the model for the obscuration of AGN at X-ray and optical wavelengths. We incorporate the updated Fanidakis et al. (2011) SMBH model in the Lacey et al. (2016) galform model as updated for the Planck-Millennium simulation by Baugh et al. (2018). The Lacey et al. (2016) model brings together several galform developments into a single model, which fits well a wide range of observational data covering wavelengths from the far-UV to the sub-mm in the redshift range . The Lacey et al. (2016) galform model differs in a number of ways from that used in Fanidakis et al. (2011); Fanidakis et al. (2012), including having different IMFs for quiescent and starburst star formation, as opposed to the single IMF used in Fanidakis et al. (2011).
The dark matter simulation used for these predictions is a new Millennium style simulation (Springel et al., 2005) with cosmological parameters consistent with the Planck satellite results (Planck Collaboration et al., 2014) - henceforth referred to as the P-Millennium (Baugh et al., 2018). The P-Millennium has an increased number of snapshots output - 270 instead of 64 for the Millennium simulation, the time interval between outputs has been chosen to ensure there are sufficient output snapshots for convergence of galaxy properties (c.f. Benson et al., 2012). The halo mass resolution is , compared to the halo mass resolution of for the dark matter simulation used in Lacey et al. (2016). This halo mass resolution is a result of P-Millennium having a dark matter particle mass of .
| Parameter | Description | Lacey et al. (2016) | This study |
|---|---|---|---|
| Matter density | 0.272 | 0.307 | |
| Vacuum energy density | 0.728 | 0.693 | |
| h | Reduced Hubble parameter | 0.704 | 0.678 |
| Baryon density | 0.0455 | 0.0483 | |
| Power spectrum normalization | 0.818 | 0.829 | |
| Gas reincorporation timescale | 0.64 | 1.0 | |
| Slope of SN feedback mass loading | 3.2 | 3.4 | |
| Galaxy merger timescale | Jiang et al. (2008) | Simha & Cole (2017) |
Because of the changed cosmological parameters and improved halo mass resolution in P-Millennium compared to the simulation used in Lacey et al. (2016), it was necessary to re-calibrate some of the galaxy formation parameters - which was done in Baugh et al. (2018). The new model also includes a more accurate calculation of the timescale for galaxies to merge within a halo (Simha & Cole, 2017). Only two galform parameters were changed, both relating to supernova feedback and the return of ejected gas. The parameters were changed in Baugh et al. (2018) from the Lacey et al. (2016) model values are shown in Table 1. This P-Millennium based model has already been used in Cowley et al. (2018) to make predictions for galaxies for JWST in near- and mid-IR bands, and a model using P-Millennium and the model of Gonzalez-Perez et al. (2018) was used to study the effect of AGN feedback on halo occupation distribution models in McCullagh et al. (2017).
We emphasize that the aim in this paper is to study SMBH and AGN evolution in the framework of an existing galaxy formation model calibrated on a wide range observational data on galaxies. Therefore we do not consider any modifications to the underlying galaxy formation model, only to the modelling of SMBH and AGN within it.
2.2 SMBH growth
SMBHs in galform grow in three different ways.
2.2.1 Starburst mode gas accretion
Firstly, SMBHs can accrete gas during starbursts, which are triggered by either galaxy mergers or disc instabilities. In both of these cases, all of the remaining cold gas in a galaxy is consumed in a starburst and a fixed fraction of the mass of stars formed from the starburst feeds the SMBH, such that the accreted mass is where is the mass of stars formed in the starburst and is a free parameter (c.f. Lacey et al., 2016). Note that the mass of the stars formed is less than the initial mass of the gas in the starburst due to the ejection of gas by supernova feedback.
A galaxy merger can cause gas to be transferred to the centre of the galaxy and trigger a burst of star formation (e.g. Mihos & Hernquist, 1996). Some of this gas is then available to feed the central SMBH (Kauffmann & Haehnelt, 2000; Malbon et al., 2007). In the model, if the mass ratio of the two galaxies is less than 0.3, the merger is defined as a minor merger, and a starburst is triggered for a minor merger with mass ratio above 0.05. If the mass ratio of the galaxies is greater than 0.3, the merger is defined as a major merger, and a spheroid is formed. This is described in Section 3.6.1 of Lacey et al. (2016).
Disc instabilities cause a bar to be formed, which disrupts the galaxy disc (Efstathiou et al., 1982) and transfers gas to the centre of the galaxy to be fed into the SMBH. Disc instabilities driving gas into the centres of galaxies is an effect seen in various hydrodynamical simulations (e.g. Hohl, 1971; Bournaud et al., 2005; Younger et al., 2008), and used as a channel of black hole/bulge growth in many semi-analytic models of galaxy formation (e.g. De Lucia et al., 2011; Hirschmann et al., 2012; Menci et al., 2014; Croton et al., 2016; Lagos et al., 2018), although the implementation of these disc instabilities varies between models. Most models use the disc instability criterion of Efstathiou et al. (1982) in which the disc becomes unstable if it is sufficiently self-gravitating, however different models use this condition differently. For example, in the model of Hirschmann et al. (2012), if a disc is unstable, then enough gas and stars are transferred from the disc to the bulge to completely stabilise the disc, while in galform, we assume that if a disc is unstable, then it is completely destroyed and forms a bulge. Numerical simulations of isolated disks show that disc instabilities can transfer large fractions of gas and stars into the bulge in some situations (e.g. Bournaud et al., 2007; Elmegreen et al., 2008; Saha & Cortesi, 2018). Disc instabilities in galform are described in Section 3.6.2 of Lacey et al. (2016).
2.2.2 Hot halo mode gas accretion
In galform, we assume that SMBHs can also accrete gas from the hot gas atmospheres of massive haloes: when large haloes collapse, gas is shock heated to form a quasistatic hot halo atmosphere. For sufficiently massive haloes, the cooling time of this gas is longer than its free-fall time, and the SMBH is fed with a slow inflow from the halo’s hot atmosphere - ‘hot halo mode accretion’ (Bower et al., 2006). The black hole is assumed to grow by this fuelling mechanism only when AGN feedback is operational. In this regime, energy input by a relativistic jet is assumed to balance radiative cooling in the halo, with the mass accretion rate onto the black hole being determined by this energy balance condition. The mass accreted onto the SMBH in a simulation timestep is then . The hot halo accretion mode is fully described in Section 3.5.3 of Lacey et al. (2016).
2.2.3 SMBH mergers
SMBHs can be built up by SMBH-SMBH mergers. When galaxies merge, dynamical friction from gas, stars and dark matter causes the SMBH of the smaller galaxy to sink towards the other SMBH. Then, as the separation decreases, gravitational radiation provides a mechanism by which the SMBHs can lose angular momentum and spiral in to merge and form a larger SMBH. In the model, we assume the timescale on which the SMBHs merge is short, so that the SMBHs merge when the galaxies merge.
2.3 SMBH seeds
The starting point for the treatment of SMBHs in the model is SMBH seeds that eventually grow by accretion of gas and by merging with other SMBHs to form the objects in the Universe today. The processes for SMBH seed formation are uncertain (see e.g. Volonteri 2010, and references therein) and so we simply add a seed SMBH of mass into each halo, where is a parameter that we can vary. Unless otherwise stated, this parameter has the value - representative of the SMBH seeds formed by stellar collapse. The effect of varying this seed mass is discussed in Appendix A.
2.4 SMBH mass growth and spinup by gas accretion
Our model includes the evolution of SMBH spin. In this model, SMBHs can change spin in two ways: (i) by accretion of gas or (ii) by merging with another SMBH. The SMBH spin is characterised by the dimensionless spin parameter, , within the range , where is the angular momentum of the SMBH, and is the mass of the SMBH. represents a black hole that is not spinning and or represents a maximally spinning black hole. The sign of is defined by the direction of the angular momentum of the black hole relative to that of the innermost part of the accretion disc, so for the black hole is spinning in the same direction as the inner accretion disc and for the black hole is spinning in the opposite direction to the inner accretion disc. To calculate the SMBH spin, after an accretion episode, we use the expression in Bardeen (1970)111Note that equation (1) is corrected from Fanidakis et al. (2011) equation (6).:
| (1) |
where is the radius of the last stable circular orbit in units of the gravitational radius, , and the subscripts i and f indicate values at the start and end of an accretion event. The black hole mass before and after an accretion event are related by:
| (2) |
where is the mass accreted from the disc in this accretion episode and , the radiative accretion efficiency for a thin accretion disc, is given by:
| (3) |
is calculated from the spin , as in Bardeen et al. (1972):
| (4) |
with the minus sign for and the positive sign for . The functions and are given by:
| (5) |
| (6) |
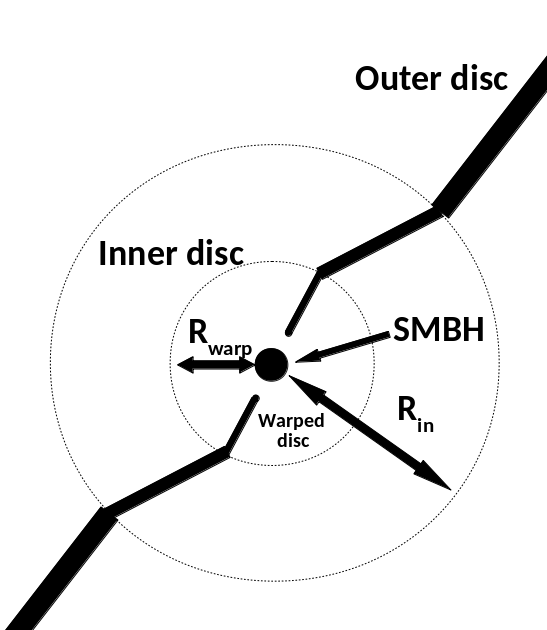
We consider the accretion disc in three separate parts as shown in Figure 1 - an outer disc at radii greater than an inner radius, , an inner disc for radii less than , and a warped disc for radii less than the warp radius, . The SMBH has an angular momentum , and the angular momentum of the disc within is . If is not in the same direction as a spinning black hole induces a Lense-Thirring precession in the misaligned disc elements. Because the precession rate falls off as , at smaller radii the black hole angular momentum and the accretion disc angular momentum vectors will become exactly aligned or anti-aligned, whereas at sufficiently large radii there will still be a misalignment (Bardeen & Petterson, 1975). The transition between these two regions occurs at the so-called ‘warp radius’, . The angular momentum of the disc within the warp radius is . At the start of an accretion event, the angular momentum within is assumed to be aligned with . As a result of the torques, then aligns with (which remains constant during this alignment process) and either anti-aligns or aligns with (King et al., 2005). The gas within is then assumed to be accreted onto the SMBH from the aligned/anti-aligned disc. As more gas is accreted, eventually aligns with the rest of the inner disc, as the gas in the inner disc is consumed.
We consider two alternative scenarios for how the angular momentum directions of the inner and outer disc are related. In the ‘prolonged mode’ accretion scenario, the angular momentum of the inner disc is in the same direction as the angular momentum of the outer disc, , but in the the ‘chaotic mode’ accretion scenario introduced in King et al. (2008), the orientation of the angular momentum of the inner disc is randomly oriented with respect to the angular momentum of the outer disc. King et al. (2008) propose that is the self-gravity radius of the disc, and we assume this in our model.
The motivation for chaotic mode accretion is twofold. Firstly, the Soltan (1982) argument, a comparison of the integral of the quasar luminosity function over luminosity and redshift to the integral over the black hole mass function in the local Universe, implies an average radiative efficiency of SMBH growth of (which corresponds to a spin value of ), suggesting that SMBHs in the Universe are typically not maximally spinning, as we would expect from SMBHs that have been spun up by the accretion of gas that is aligned in the same direction, as in the prolonged accretion scenario. Secondly, AGN jets seem to be misaligned with their host galaxies (e.g. Kinney et al., 2000; Sajina et al., 2007), suggesting a misaligned accretion of material onto the SMBH.
Accretion continues in this manner until the gas in the outer disc has been consumed. For this analysis, we adopt chaotic mode accretion as our standard choice.
2.5 Warped accretion discs
To obtain the warp radius, , of an accretion disc, we need expressions for the structure of the accretion disc. There are two different types of accretion discs: i) physically thin, optically thick, radiatively efficient ‘thin discs’ (Shakura & Sunyaev, 1973) and ii) physically thick, optically thin, radiatively inefficient Advection Dominated Accretion Flows (ADAFs - see Yuan & Narayan, 2014, for a review). Shakura & Sunyaev (1973) introduced the ‘-prescription’ to solve the accretion disc equations for a thin disc, where the viscosity, , is given by , where is the dimensionless Shakura & Sunyaev (1973) parameter, is the sound speed and is the disc semi-thickness. In this analysis, we use the solutions of Collin-Souffrin & Dumont (1990), in which the accretion disc equations are solved for AGN discs, assuming this -prescription. We use their solution for the regime where the opacity is dominated by electron scattering and where gas pressure dominates over radiation pressure.
The disc surface density, , is then given by:
| (7) |
where is the dimensionless mass accretion rate, is the radius from the centre of the disc and is the Schwarzschild radius. The value we use for is given in Table 2. The disc semi-thickness is given by222Note that equation (8) is different to Fanidakis et al. (2011) equation (25).:
| (8) |
We calculate the Eddington luminosity using:
| (9) |
where is the opacity, for which we have used the electron scattering opacity for pure hydrogen gas. We calculate the Eddington mass accretion rate from using a nominal accretion efficiency (as used in Yuan & Narayan, 2014) chosen so that the Eddington normalised mass accretion rate does not depend on the black hole spin:
| (10) |
Note that for the calculation of the luminosities, we do use the spin-dependent radiative efficiency. We then follow the method of Natarajan & Pringle (1998) and Volonteri et al. (2007) and take the warp radius as the radius at which the timescale for radial diffusion of the warp due to viscosity is equal to the local Lense-Thirring precession timescale. This then gives an expression for the warp radius333Note that equation (11) is different to Fanidakis et al. (2011) equation (15).:
| (11) |
where are the horizontal and vertical viscosities respectively. For this analysis, we assume that (e.g. King et al., 2008). The warp mass can then be calculated using:
| (12) |
to give an expression444Note that equation (13) is different to Fanidakis et al. (2011) equation (18).:
| (13) |
| Parameter | Fanidakis et al. (2012) | Adopted here | Significance |
| 0.087 | 0.1 | Shakura & Sunyaev (1973) viscosity parameter for ADAFs | |
| 0.087 | 0.1 | Shakura & Sunyaev (1973) viscosity parameter for TDs | |
| 0.2 | Fraction of viscous energy transferred to electrons in ADAF | ||
| 0.01 | 0.01 | Boundary between thin disc and ADAF accretion | |
| 4 | 4 | Super-Eddington suppression factor | |
| 10 | 10 | Ratio of lifetime of AGN episode to bulge dynamical timescale |
2.6 Self-gravitating discs
In the chaotic mode accretion scenario of King et al. (2008), the inner radius, , is assumed to be equal to the disc self-gravity radius, . The self-gravity radius of the accretion disc is the radius at which the vertical gravity due to the disc equals the vertical gravity of the central SMBH at the disc midplane. For thin discs and ADAFs, for thin discs (where ), the self-gravity condition is (Pringle, 1981):
| (14) |
where is the disc mass within the radius . For ADAFs (where ), , so the self-gravity condition is:
| (15) |
Using the accretion disc solutions of Collin-Souffrin & Dumont (1990), we derive an expression for the self-gravity radius for thin discs555Note that equation (16) is different to Fanidakis et al. (2011) equation (24).:
| (16) |
and using an integral similar to equation (12), the self-gravity mass for the thin disc is given by666Note that equation (17) is different to Fanidakis et al. (2011) equation (26).:
| (17) |
2.7 Numerical procedure for modelling SMBH accretion
We have calculated results for both the prolonged and chaotic scenario, and for gas accreted in increments of the self-gravity mass or warp mass. We present predictions mostly for our standard case in which mass is accreted in increments of the self-gravity mass and assuming the chaotic mode of accretion. We find that the predicted spin distribution of the SMBHs is the same if we use increments of the self-gravity mass or the warp mass (c.f. Figure 8) and so we use increments of the self-gravity mass as it is computationally faster. This is because when gas is accreted onto the SMBH in increments of the warp mass, for small SMBHs the warp mass is very small, and so in each accretion event the SMBH grows by a very small amount in each accretion event. First, we present the numerical procedure when mass is accreted in increments of the warp mass (c.f. Volonteri et al., 2007; Fanidakis et al., 2011), and then the case where mass is accreted in increments of the self-gravity mass (c.f. King et al., 2008).
2.7.1 Accretion in increments of the warp mass
For the first warp mass of gas, the angular momentum of the SMBH, , and the angular momentum of the inner disc, , are assigned a random angle, , in the range [0, ] radians. In the chaotic mode, each time the inner disc is consumed, is assigned a new random angle. The gas with initially has angular momentum aligned with , so is also the initial angle between and . and are then evolved according to the Lense-Thirring effect described in Section 2.4, with and respectively aligning and aligning/anti-aligning with . The magnitude of remains constant during this process, but the magnitude of changes. This is treated as happening before the mass consumption onto the SMBH starts.
We calculate the angular momentum of the material within the warped disc as and the angular momentum of the black hole, . Then the ratio of these two quantities is:
| (18) |
Whether and align or anti-align with each other depends on this ratio and on the angle . If , and become aligned (prograde accretion), whereas if , and become anti-aligned (retrograde accretion). The angle between and after the accretion event, , is determined by conservation of and || and is given by:
| (19) |
When a new warp mass , is then consumed, the gas is given a new pointing in the same direction as the inner disc and the same process happens again. This repeated process has the effect that gradually aligns with the angular momentum of the inner accretion disc, as more gas is accreted. Eventually the gas in the inner disc is completely consumed.
In the prolonged mode, this process continues until all of the gas in the outer disc has also been consumed, whereas in the chaotic mode, once a self-gravity mass of gas has been consumed, the angle between and is randomised again.
2.7.2 Accretion in increments of the self-gravity mass
In the scenario where gas is being accreted in increments of the self-gravity mass of gas, the above procedure is followed, but only once for each inner disc of gas consumed. For this case, the ratio of angular momenta is given by:
| (20) |
In the future we plan a more thorough analysis of the effect on the spin evolution of accreting in increments of self-gravity mass compared to increments of warp mass. The AGN luminosities are not affected by this choice as they depend on the accreted mass and the SMBH spin as we describe in Section 3.1.
2.8 Spinup by SMBH mergers
The other way in which an SMBH can change its spin is by merging with another SMBH. The spin of the resulting SMBH depends on the spins of the two SMBHs that merge and on the angular momentum of their binary orbit. To determine the final spin, , we use the expressions obtained from numerical simulations of BH-BH mergers in Rezzolla et al. (2008):
| (21) |
where are the spins of the SMBHs, is the mass ratio , with and chosen such that , is the symmetric mass ratio , and l is the contribution of the orbital angular momentum to the spin angular momentum of the final black hole. It is assumed that the direction of l is that of the initial orbital angular momentum, while its magnitude is given by:
| (22) |
where , , , , are values obtained in Rezzolla et al. (2008). The angles , and are the angles between the spins of the two black holes and their orbital angular momentum, and are given by:
| (23) |
| (24) |
| (25) |
When we consider two SMBHs merging, we calculate the angles between the three different vectors by randomly selecting directions for , and uniformly over the surface of a sphere. This prescription makes the assumption that the radiation of gravitational waves does not affect the direction of the orbital angular momentum as the binary orbit shrinks, and we also assume that the mass lost to gravitational radiation is negligible.
3 Calculating AGN luminosities
3.1 AGN bolometric luminosities
From the mass of gas that is accreted onto the SMBH, we can calculate a radiative bolometric luminosity as follows. In the starburst mode, we assume that during an accretion episode the accretion rate is constant over a time , where is the dynamical timescale of the bulge and is a free parameter, given in Table 2. Therefore, the mass accretion rate is given by:
| (26) |
where is as defined in Section 2.2. In the hot halo mode, which is only active when AGN feedback is active, the mass accretion rate is determined by the condition that the energy released is just enough to balance radiative cooling:
| (27) |
where is the radiative cooling luminosity of the hot halo gas, and is the efficiency of halo heating, which is treated as a free parameter (c.f. Lacey et al., 2016).
We then calculate the bolometric luminosity for a thin accretion disc using:
| (28) |
where the radiative efficiency for the thin disc case depends on the black hole spin, as given by equation (3). However, the radiative efficiency is not the same for all regimes of the accretion flow. As well as the thin disc and the ADAF case, there are also AGNs accreting above the Eddington accretion rate. Such objects are generally understood to be advection dominated and to have optically thick flows (Abramowicz et al., 1988).
For the ADAF regime we use the expressions for bolometric luminosity from Mahadevan (1997). There are two cases within this regime. For lower accretion rate ADAFs (), heating of the electrons is dominated by viscous heating, whereas for higher accretion rate ADAFs (), the ion-electron heating dominates the heating of the electrons. In the super-Eddington regime, the radiative efficiency is lower than the corresponding thin disc radiative efficiency, and so a super-Eddington luminosity suppression is introduced (Shakura & Sunyaev, 1973). This expression includes a free parameter, , the value for which is given in Table 2,
Hence, the bolometric luminosities in the model are given by the following expressions777Note that the coefficients of the ADAF luminosities are derived in Mahadevan (1997) and not free parameters.. For the low accretion rate ADAF regime, where :
| (29) |
For the higher accretion rate ADAF regime, where , we have:
| (30) |
For the thin disc regime, where , . Finally, for the super-Eddington regime, where , we have:
| (31) |
The value of adopted gives a similar luminosity at a given mass accretion rate in the super-Eddington regime to the model of Watarai et al. (2000) who model super-Eddington sources as advection dominated slim discs.
In the above, is the viscosity parameter in the ADAF regime (the value is given in Table 2). is the fraction of viscous energy transferred to the electrons (the value is given in Table 2). The current consensus for the value of is a value between 0.1 and 0.5, (c.f. Yuan & Narayan, 2014). Therefore, for this study we adopt a value , more in line with observational (Yuan et al., 2003; Liu & Wu, 2013) and theoretical (Sharma et al., 2007) constraints, as opposed to the value of adopted in Fanidakis et al. (2012). Changing the value of makes no discernible difference to the luminosity functions shown in this paper. is the ratio of gas pressure to total pressure (total pressure being the sum of gas pressure and magnetic pressure). Following Fanidakis et al. (2012), we use the relation , which is based on MHD simulations in Hawley et al. (1995).
The boundary between the two ADAF regimes is:
| (32) |
3.2 Converting from bolometric to optical and X-ray AGN luminosities
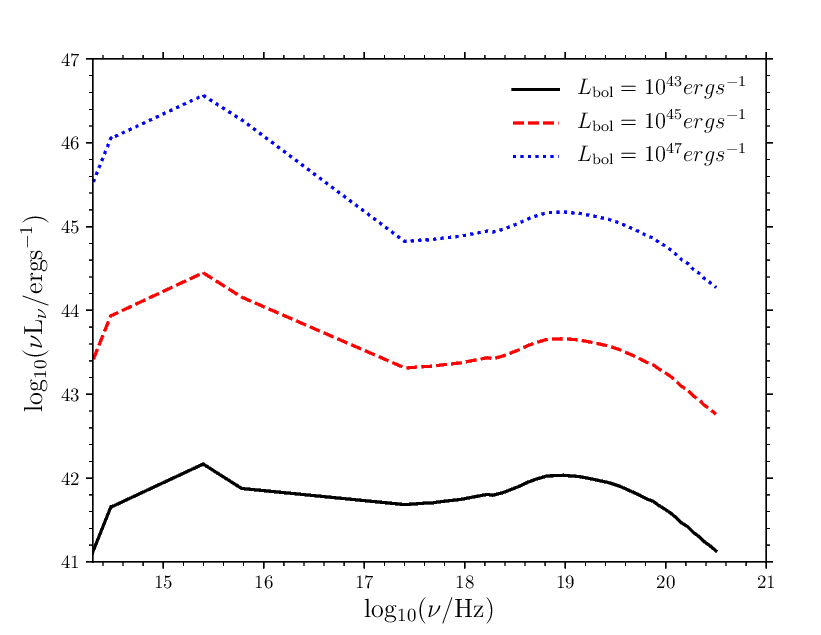
To convert from AGN bolometric luminosity to luminosities in other wavebands we use bolometric corrections derived from the empirical AGN SED template in Marconi et al. (2004). We show this SED for three different luminosities in Figure 2. The rest-frame bolometric corrections calculated from this SED are888Note that equations (33) and (34) are corrected from Fanidakis et al. (2012) equation (10).:
| (33) |
| (34) |
| (35) |
where , is the hard X-ray (2-10 keV) luminosity, is the soft X-ray (0.5-2 keV) luminosity, is the frequency of the centre of the B-band, and is the luminosity per unit frequency in the B-band.
To calculate B-band magnitudes we use the expression999Note that equation (36) is different to Fanidakis et al. (2012) equation (13).:
| (36) |
for magnitudes in the AB system, from the definition of AB magnitudes (Oke & Gunn, 1983). Using the Marconi et al. (2004) SED template, we convert from rest-frame B-band magnitudes to rest-frame 1500Å band magnitudes using a relation similar to equation (54) to give:
| (37) |
The Marconi et al. (2004) SED is based on observations of quasars, with the UV part of the SED based on observations at and the X-ray part of the SED based on observations at . Therefore, this SED is likely to be most appropriate for AGN in the thin disc and super-Eddington regime. For and for the luminosities that we are considering, the AGN are in the thin disc or super-Eddington regime, so this SED is appropriate, although in future work we plan to include a wider variety of SEDs for AGN in different accretion regimes.
3.3 AGN obscuration and visible fractions
AGN are understood to be surrounded by a dusty torus, which causes some of the radiation to be absorbed along some sightlines, and re-emitted at longer wavelengths. For simplicity, we assume that at a given wavelength, AGN are either completely obscured or completely unobscured. The effect of obscuration can therefore be expressed as a visible fraction, which is the fraction of objects that are unobscured in a certain waveband at a given luminosity and redshift.
The fraction of obscured objects in the hard X-ray band is thought to be small, so for this work we assume that there is no obscuration at hard X-ray wavelengths. There is a population of so-called ‘Compton-thick’ AGNs for which the column density of neutral hydrogen exceeds , which is the unit optical depth corresponding to the Thomson cross section. Such objects are difficult to detect, even at hard X-ray wavelengths. The number of such objects is thought to be small, so we ignore their contribution for this work.
We calculate the visible fractions in the soft X-ray and optical bands using one of three observationally determined empirical relations from the literature, and also two more introduced in this work.
-
1.
The visible fraction of Hasinger (2008) is:
(38) where
(39) is the hard X-ray luminosity in the observer frame and is the redshift101010This empirical model and others we use from observational studies were derived using a slightly different cosmology from the one used in the P-Millennium, for simplicity we ignore the effect of this here.. The redshift dependence of the visible fraction in this model saturates at and the visible fraction is not allowed to have values below 0 or above 1. Because the observational data on which this obscuration model is based only extend to , we extrapolate the model to using as the rest-frame hard X-ray band at , i.e. 6-30 keV. For this obscuration model, if an object is obscured at soft X-ray wavelengths, then it is also assumed to be obscured at optical/UV wavelengths.
-
2.
Hopkins et al. (2007) derive a visible fraction of the form:
(40) where and are constants for each band. For the B-band, [, ] are [0.260, 0.082] and for the soft X-ray band, [, ] are [0.609, 0.063]. This model does not require a high redshift extrapolation, as it depends only on bolometric luminosity.
-
3.
Aird et al. (2015) observationally determine a visible fraction for soft X-rays of the form:
(41) where , the number density of unabsorbed sources, and , the number density of absorbed sources, are given by:
(42) where the constants for both cases are given in Table 3. As for the Hasinger (2008) obscuration model, if the object is obscured at soft X-ray wavelengths, then we assume that it is also obscured at optical/UV wavelengths. For this obscuration model, we extrapolate to high redshift such that for , the hard X-ray band is the rest-frame band for .
-
4.
We also use visible fractions that are modified versions of Hopkins et al. (2007). These visible fractions also depend solely on , but with different coefficients. These coefficients were derived by constructing a bolometric luminosity function from the luminosity functions at optical, UV, and X-ray wavelengths. We used the Marconi et al. (2004) bolometric corrections and selected coefficients for the visible fraction so as to create a resultant bolometric luminosity function with the scatter between points minimised. This is described in Appendix C. The first of these new obscuration relations, the ‘low-z modified Hopkins’, (LZMH) visible fraction for rest-frame has the form:
(43) and for the soft X-ray band it has the form:
(44) -
5.
The second of these modified Hopkins visible fractions, the ‘ modified Hopkins’ (Z6MH) visible fraction was derived by fitting the galform luminosity functions at and in the soft X-ray band to the observational estimates. This visible fraction is:
(45) for both rest-frame and soft X-rays.
3.4 Calculating model AGN luminosity functions
Typically when one constructs a luminosity function from a simulation, only the AGN that are switched on at each snapshot are included. However, if one does this, rarer objects with higher luminosities but which are only active for a short time are not sampled well. To probe the luminosity function for such objects, we average over a time window, . The time window should not be too large, as then we may miss the effect of multiple starbursts within the time window, because the simulation only outputs information on the most recent starburst. We select a time window for which the luminosity function using the time average method is converged to the luminosity function using only the AGN switched on at the snapshots. For the predictions here we set , where is the age of the Universe at that redshift.
Each object is assigned a weight, , given by:
| (46) |
where is the lifetime of the most recent quasar episode occurring within the time interval as in Section 3.1. This weight is then applied to the number densities counting all AGN occurring within the time interval which then allows us to include higher luminosity events at lower number densities in the luminosity function. We show the effect of changing the value of , as well as the effect of simply using snapshot quantities on the predicted luminosity functions in Appendix D.
4 SMBH Masses, accretion rates and spins
We start by showing some basic predictions from the new model for SMBH masses, accretion rates and spins.
4.1 Black hole masses
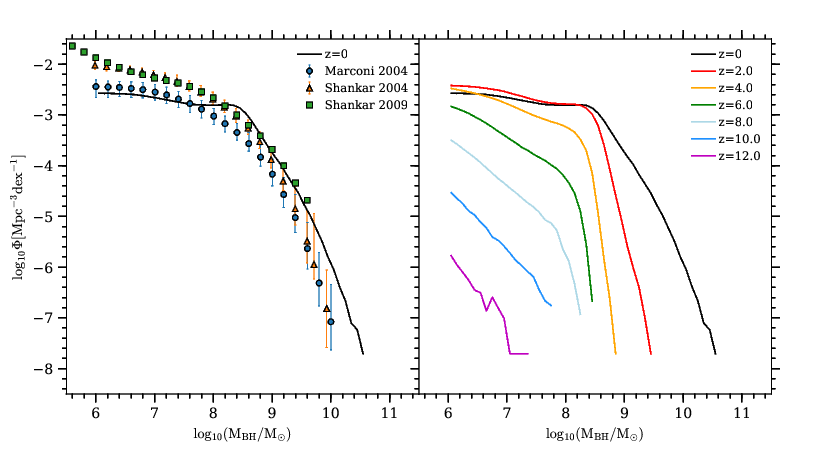
In the left panel of Figure 3 we show the black hole mass function at predicted by our model compared to observational estimates. The observations use indirect methods to estimate the black hole mass function, because of the lack of a large sample of galaxies with dynamically measured black hole masses. In Marconi et al. (2004) and Shankar et al. (2004, 2009) galaxy luminosity/velocity dispersion functions are combined with relations between black hole mass and host galaxy properties to estimate black hole mass functions. The predictions of the model fit well to the observational estimates within the observational errors, especially given that there will also be uncertainties on the black hole mass measurements and given the discrepancies between the observational estimates. The former means the predictions could still be consistent with observations at the high mass end ().
The evolution of the black hole mass function for is shown in the right panel of Figure 3. Most of the SMBH mass is formed by , as the mass density of black holes is dominated by objects around the knee of the black hole mass function, and this knee is in place by . The dominant fuelling mechanism for growing the black hole mass density across all redshifts is gas accretion in starbursts triggered by disc instabilities, and disc instabilities play an important role in shaping the black hole mass function for . However, SMBH mergers are more important for determining the shape of the black hole mass function for , as they are the mechanism by which the largest SMBHs are formed. AGN feedback also plays an important role in shaping the black hole mass function at this high mass end, by suppressing gas cooling and so slowing down the rate at which the SMBHs grow by cold gas accretion.
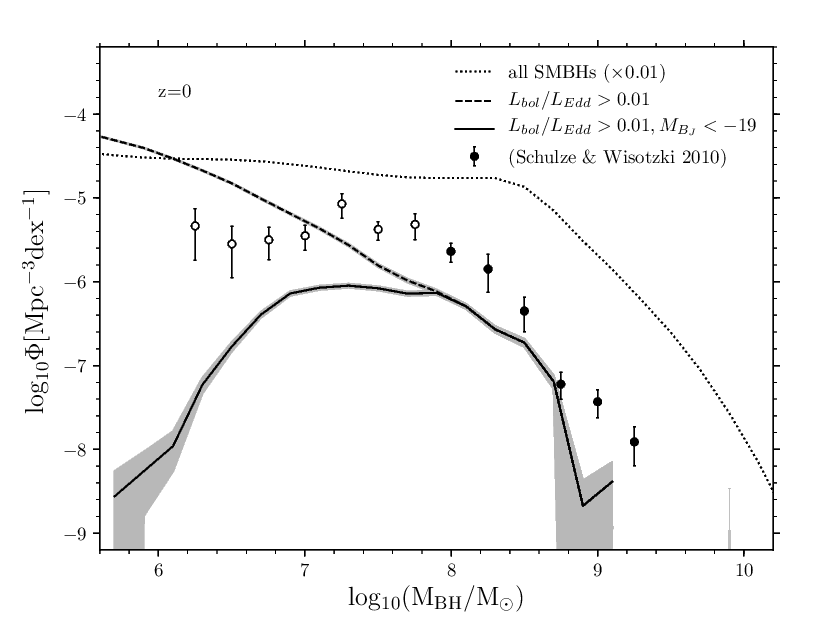
In Figure 4, we show the ‘active’ black hole function at compared to observational estimates from Schulze & Wisotzki (2010). In this observational estimate, active SMBHs are defined as AGN radiating above a certain Eddington ratio (). The flux limit in the observations results in the observational sample being incomplete for . The observational sample also only includes type 1 (unobscured) AGN. Therefore, we apply these selections to the model predictions, using the LZMH visible fraction, to compare with this observational estimate of the active black hole mass function. We also present predictions where the selection on has not been applied. The effect of the selection on can be seen at the low mass end (), where the dashed and solid lines diverge. While the model is in reasonable agreement with the observations at , the model generally underpredicts the active black hole mass function, although the model does reproduce the overall shape of the shape of the observational active black hole mass function. We found similar results when comparing with other studies, such as those from SDSS (e.g. Vestergaard & Osmer, 2009).

Figure 5 shows the relation between SMBH mass and bulge or total stellar mass. In the left panel of Figure 5 we show the predicted SMBH mass versus bulge mass relation compared to observational data from McConnell & Ma (2013). The predictions follow the observations well, with the scatter decreasing towards higher masses. BH-BH mergers contribute towards this decrease in scatter, as seen in Jahnke & Macciò (2011), although they are not the only contributing mechanism, with AGN feedback also affecting the scatter at the high mass end.
In the middle panel of Figure 5, we show the evolution of the ratio of SMBH mass to bulge mass () versus bulge stellar mass for , showing the scatter of the distribution for and . As we go to higher redshift, the ratio increases, as also seen in observations (e.g. Peng et al., 2006). The ratio reflects the mechanism by which these two galaxy components form. At higher redshift, bulges grow mainly by starbursts, which also feeds the growth of SMBHs and so the distribution of the ratio peaks at (the fraction of the mass of stars formed in a starburst accreted onto a black hole), with some scatter caused by mergers. At lower redshift the ratio decreases, as galaxy mergers cause bulges to form from discs, but without growing the SMBHs. We also note how the scatter of the relation is lower at than at for all masses - by galaxies have had more varied formation histories compared to the population.
In the right panel of Figure 5 we show the evolution of the ratio of the SMBH mass to the galaxy stellar mass () versus galaxy stellar mass for the redshift range . Galaxies of larger stellar mass and the largest SMBHs form at late times, and at lower masses (), is smaller at later times. At lower masses, the ratio decreases with time because the fraction of the stellar mass that is in the bulge decreases. This evolution slows down at . At higher masses (), the stellar mass and SMBH mass stay on the same relation independent of redshift. It is in this regime that the AGN feedback is operational: in our model we use the AGN feedback prescription of Bower et al. (2006) in which AGN feedback is only active where the hot gas halo is undergoing ‘quasistatic’ (slow) cooling. This has the effect that AGN feedback is only active for haloes of mass above . The relation between SMBH mass and stellar mass at this high mass end is caused by both AGN feedback and mergers, with neither mechanism dominant in establishing this relation.
4.2 Black hole accretion rates
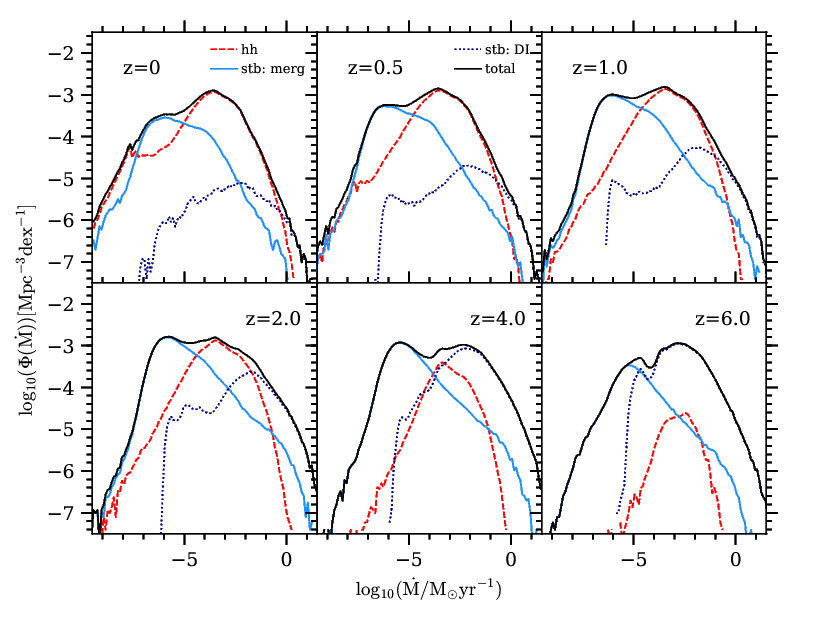
In Figure 6 we show the black hole mass accretion rate distribution, showing its evolution with redshift and split by fuelling modes: the hot halo mode, starbursts triggered by mergers and starbursts triggered by disc instabilities (see Section 2). The hot halo mode becomes more dominant at later times, because the hot halo mode requires long cooling times, and hence it occurs for massive haloes, and because dark matter haloes grow hierarchically, these large haloes only form at later times. The contribution from starbursts triggered by galaxy mergers peaks at . Starbursts triggered by mergers peak at a low mass accretion rate, as seen in Figure 6, albeit with a tail that extends to high . The peak at /yr is mostly due to minor mergers with mass ratios (mergers with mass ratios in this range cause about three quarters of the merger triggered starbursts at this mass accretion rate)111111Note that a mass ratio of 0.05 is assumed to be the lower threshold for starburst triggering in galaxy mergers (Lacey et al., 2016). The contribution from starbursts triggered by disc instabilities increases as the redshift increases. Starbursts triggered by mergers typically have lower values than starbursts triggered by disc instabilities. There are two reasons for this. Firstly, the average stellar mass formed by bursts triggered by disc instabilities is higher than for bursts triggered by mergers, and this occurs because the average cold gas mass is higher for galaxies in which bursts triggered by disc instabilities occur. Secondly, the average bulge dynamical timescale for starbursts triggered by disc instabilities is smaller than for those triggered by mergers due to the average bulge size being smaller for starbursts triggered by disc instabilities. The combination of these effects accounts for the lack of starbursts triggered by disc instabilities at the very lowest values. The galaxies that host such starburst episodes would be below the mass at which the simulation is complete.
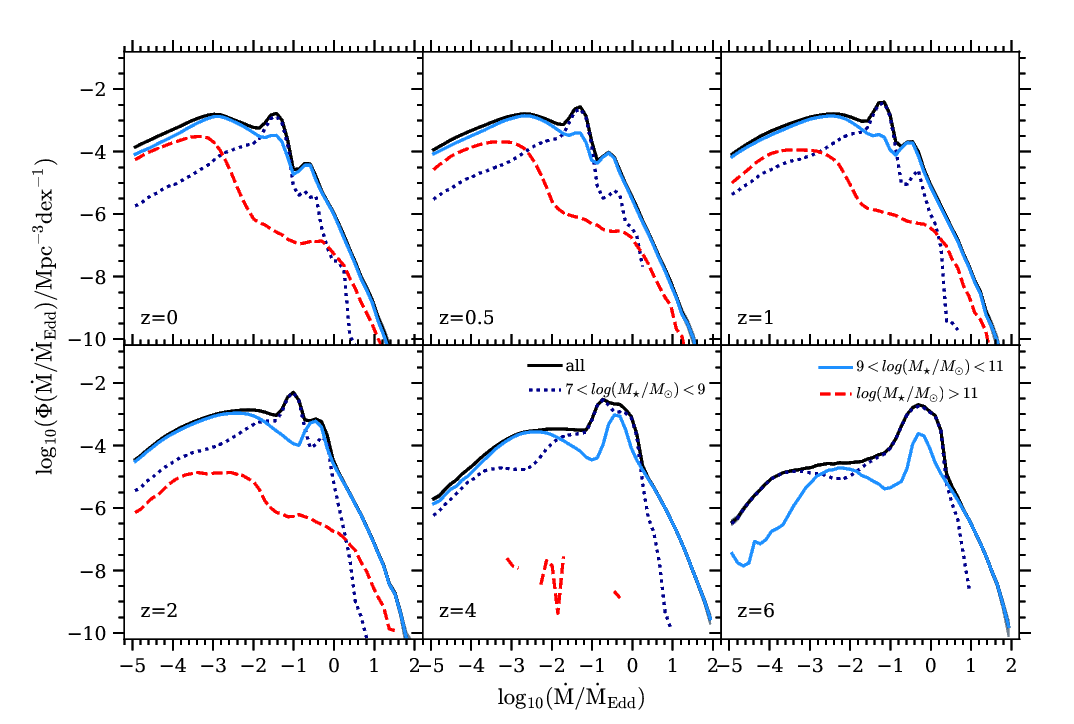
In Figure 7 we show the evolution of the distribution of Eddington normalised mass accretion rate . We also show the predictions in different stellar mass ranges. Looking at the total distribution (), for increasing redshift, the distribution shifts to somewhat higher values. This is seen as the number of objects with log decreasing with increasing redshift, a peak at log building up with increasing redshift and the number of objects with log increasing with increasing redshift. The different bins of stellar mass have different distributions of , and evolve differently. At , the lowest bin in stellar mass () shows a broad distribution around a peak at log, the middle bin in stellar mass () also shows a broad distribution, but with a peak at log and also has features at log and log. The distribution in the highest stellar mass bin () peaks at lower value of log, but has fewer objects at high Eddington ratios than the lower stellar mass bins. The distribution in the highest stellar mass bin peaks at a lower Eddington ratio because this is where the hot halo mode is operational, so SMBHs are typically quiescently accreting.
As redshift increases, the number density at the peak in the distribution for the lowest stellar mass bin increases, such that by , the peak for the lowest stellar mass bin and the middle stellar mass bin are both at log. The number of objects in the highest stellar mass bin decreases strongly at high redshift, so the hot halo mode is much less prevalent at higher redshift, .
We also have compared the predicted Eddington luminosity ratio, () distribution at , to the observational data compiled in Wu et al. (2015) Figure 4. The distribution at from galform has a median and 10-90 percentiles at for AGN with ) and for AGN with , whereas the median and 10-90 percentiles in Wu et al. (2015) is for a mixture of samples with . The predicted are somewhat larger than the observational estimate. One possible reason for the different distributions is systematic uncertainties in the black hole mass estimates in the observations. We plan to conduct a more detailed investigation in future work.
4.3 Black hole spins
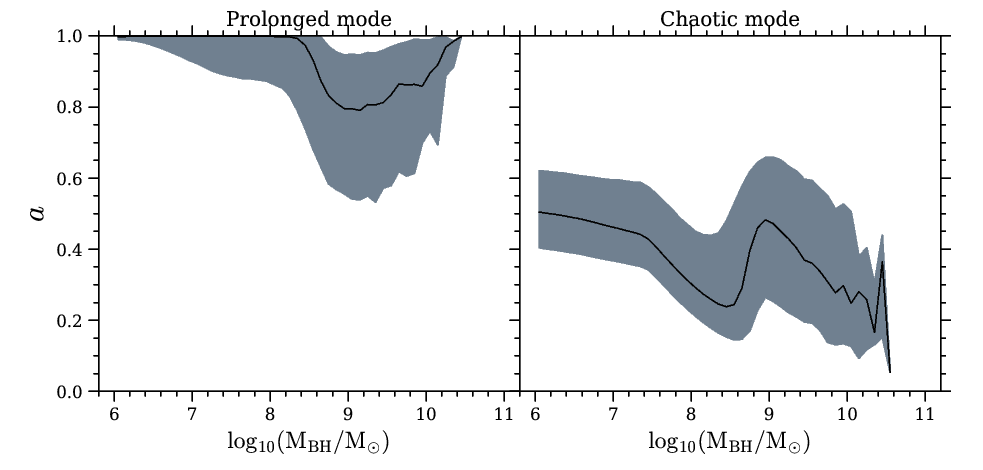
In Figure 8 we show the SMBH spin distribution predicted by the model for both the prolonged and chaotic accretion modes. Note that here represents the magnitude of the spin. The low mass end of the spin distribution (6 < < 8) is dominated by accretion spinup whereas the high mass end (8 < < 10) is dominated by merger spinup. For prolonged mode accretion, the coherent accretion spinup means that SMBHs quickly reach their maximum spin value, giving rise to a population of maximally spinning SMBHs at low mass. At high masses, the average spin value is lower because of SMBH mergers. This is because even if two maximally spinning SMBHs merge, the result is typically a SMBH with a lower spin value because of misalignment between the black hole spins and the orbital angular momentum. For chaotic mode accretion, the accretion direction is constantly changing and so the accretion spinup leads to SMBHs with lower median spin values (), compared to prolonged accretion. The spin values are not zero in the chaotic mode, as one may be tempted to expect, because the accretion spinup is more efficient if the accretion disc and SMBH spin are in the same direction compared to the case of anti-alignment (King et al., 2008). The mean value of the SMBH spin decreases with increasing black hole mass at this low mass end, for chaotic mode accretion as also reported in King et al. (2008). At the high mass end, the increase in average spin at is due to spinup by BH mergers. Two slowly spinning SMBHs typically form a higher spin SMBH when they merge, due to the angular momentum of the orbit between them.
One of the conclusions of Fanidakis et al. (2011) was that for chaotic mode accretion, smaller SMBHs will have lower spin values () whereas larger SMBHs will have higher spin values (). Our new analysis predicts that for chaotic mode accretion SMBHs will generally have moderate spin values, , yielding radiative accretion efficiencies of , not too dissimilar from the value of required by the Soltan (1982) argument. However, the average radiative accretion efficiency implied by prolonged mode accretion is , in tension with the Soltan (1982) argument.
The chaotic mode spin distribution is different to that in Fanidakis et al. (2011) because the equations for SMBH spinup by gas accretion have changed from that paper (causing higher spin values at the low SMBH mass end) and because the directions for the spinup due to SMBH mergers are sampled from the surface of a sphere as opposed to the circumference of a circle, leading to lower spin values at the high SMBH mass end.
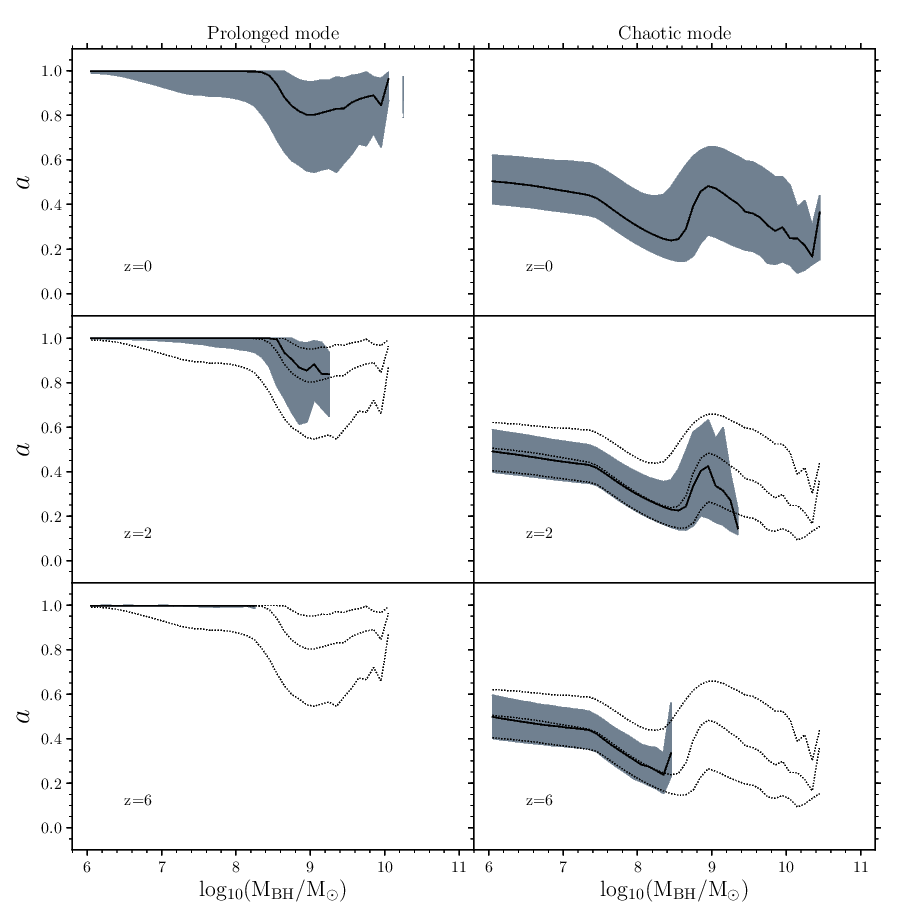
We then show the evolution of the SMBH spin distribution for the prolonged and chaotic modes in Figure 9. The black hole spin versus black hole mass relation shows negligible evolution for both modes, with the median black hole spin at any black hole mass approximately the same over the range . For both modes the scatter of the distribution decreases with increasing redshift, with the scatter for the prolonged mode decreasing much more than the scatter for the chaotic mode. For the prolonged mode, by , nearly all of the black holes with have the maximal spin permitted by the model. Also, there is a lack of high mass, , black holes at for both modes. This is due to a low abundance of high mass galaxies at .
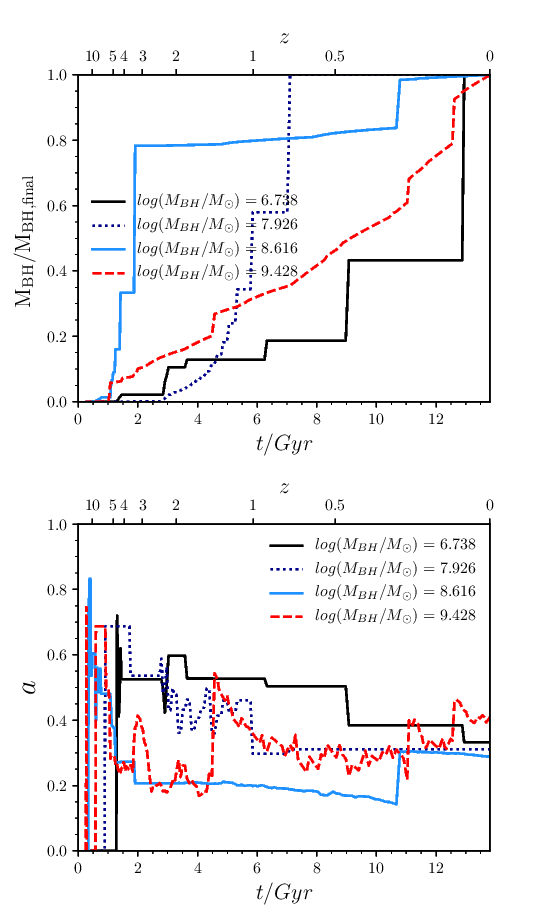
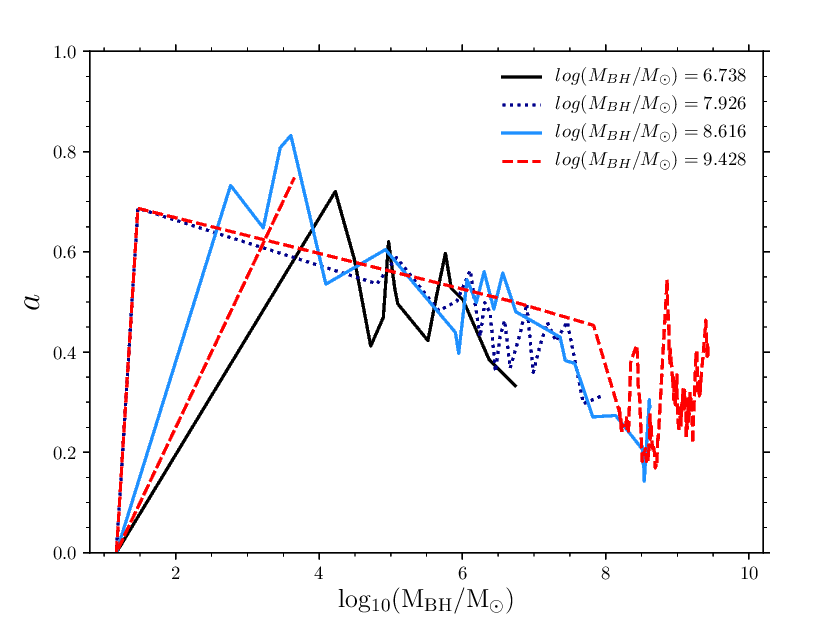
We show how typical black holes evolve in the chaotic mode (the standard choice for this analysis) for four different black hole masses in Figures in 10 and 11. When we generate each black hole history, we only follow the largest progenitor black hole back in time when two or more black holes merge. In the upper panel of Figure 10 we show the evolution of the black hole mass through time evolution for these objects, where the time is measured from the Big Bang. Some of the features discussed for the black hole mass function in Figure 3 can be seen here, such as how most of the SMBH mass is assembled at early times, and how the very largest black holes build up gradually at late times. It can also be seen how the larger SMBHs generally grow their mass quickest, with smaller SMBHs generally growing later. This is seen in Figure 10 where the SMBH of mass reaches of its final mass at 9 Gyr, whereas the SMBH of mass reaches of its final mass at 6 Gyr, and the SMBH of mass reaches of its final mass at 2 Gyr. However, the SMBH of mass grows more gradually.
In the lower panel of Figure 10 we show the evolution of SMBH spin through time. SMBHs of different masses generally show the same trends as their spin evolves through time. At early times, the black holes are smaller and so the spin values will change dramatically (with changing between 0 and 0.8) if there is an accretion or merger event, whereas at later times, the spin values do not change as dramatically ( only varies by about 0.1 for each event) with time. The spin values generally converge on a moderate value () at late times.
In Figure 11, we show the evolution of the black holes through the spin versus mass plane. First, the black holes are spun up to high spins by mergers at small masses. Then the black holes of different masses generally show a similar evolution through the spin versus black hole mass plane as they evolve from high spins at lower black hole masses to lower spins at higher black hole masses, as they accrete gas by chaotic mode accretion. For the two largest black hole masses, there is an additional feature, as the black hole spin increases at the very highest masses. This is a result of the black holes merging with other black holes following their host galaxies merging.
4.4 AGN luminosities and black hole/galaxy properties
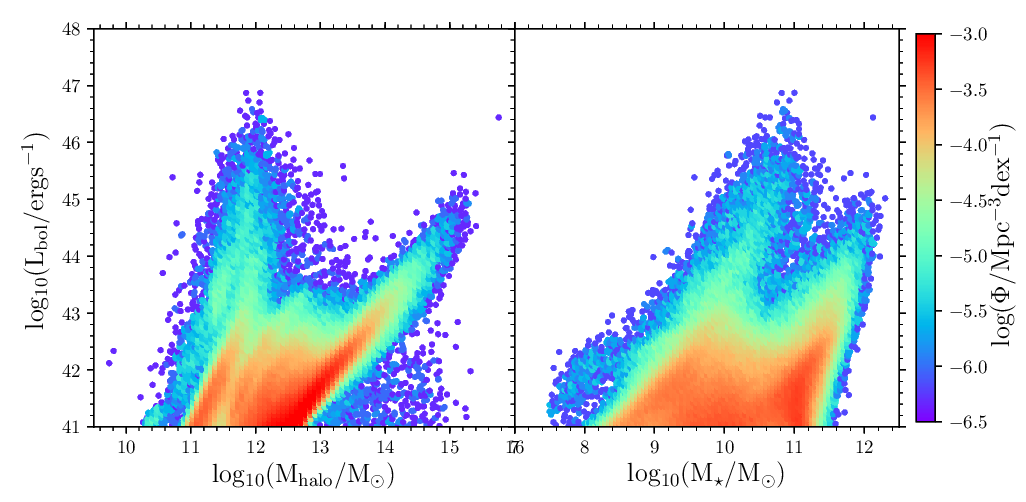
Before comparing the predicted AGN luminosity functions to observational estimates, we first show the dependence of AGN luminosities on some different galaxy properties.
First in the left panel of Figure 12, we show the dependence of bolometric luminosity on halo mass, where the points are coloured by the density of points. Each halo mass can host an AGN up to , with the brightest AGN not residing in the largest haloes, but instead in haloes of mass . This is a result of how in the model, AGN activity is inhibited in the largest haloes due to AGN feedback (c.f. Fanidakis et al., 2013). The overall distribution is bimodal, which is a result of the two primary fuelling modes. The AGN at are mostly fuelled by starbursts triggered by disc instabilities, whereas the AGN at are mostly fuelled by hot halo mode accretion. AGN fuelled by starbursts triggered by mergers make a minor contribution to both parts of this distribution. Hot halo mode accretion fuels the objects at the peak of the 2D distribution in this plane seen at and . The peak of the distribution of objects fuelled by starbursts triggered by disc instabilities is at and , while the peak in the distribution for starbursts triggered by mergers is at and .
In the right panel of Figure 12, we show the dependence of bolometric luminosity on stellar mass. There is more of a correlation between bolometric luminosity and stellar mass than between bolometric luminosity and halo mass. The brightest AGN in the model do not live in the largest stellar mass galaxies, but rather reside in galaxies of . This distribution also shows a bimodality, where generally the objects at lower masses () are fuelled by the starburst mode, while objects at higher masses () are fuelled by the hot halo mode, although there is some overlap between the two. For the starburst mode, the peak of the distribution for starbursts triggered by disc instabilities and the peak of the distribution for starbursts triggered by mergers are both at stellar mass . This peak is at for disc instabilities, whereas for mergers this peak is at . Starbursts triggered by mergers do also occur for galaxies of stellar mass , whereas starbursts triggered by disc instabilities do not occur for galaxies of this mass.
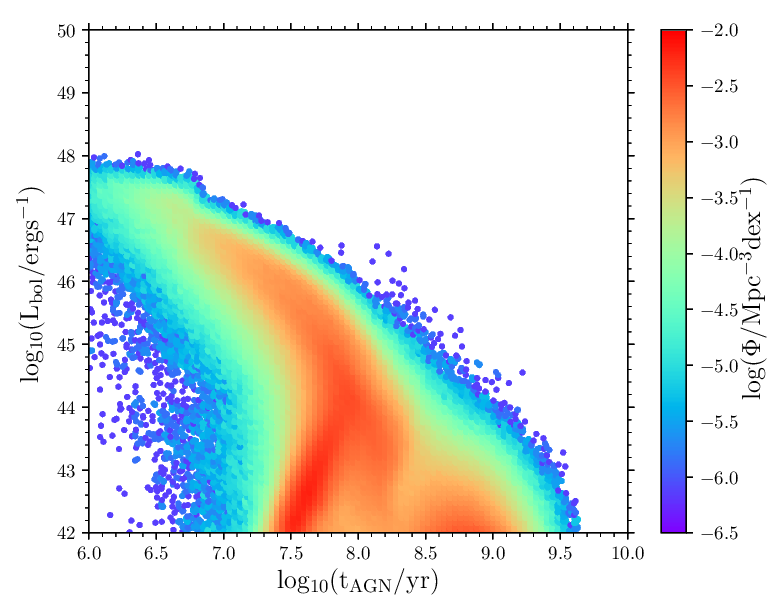
In Figure 13, we show the dependence of AGN bolometric luminosity on the duration of the AGN episode. The distribution peaks at yr and , with objects with luminosities having a wide range of durations of the AGN episodes. However, the brightest objects at all have durations of yr with an anti-correlation between duration of the AGN episode and the AGN luminosity. This anti-correlation arises because in general, shorter AGN epsiodes lead to higher AGN luminosities.
5 Evolution of the AGN luminosity function at z < 6
We first discuss the evolution of the predicted AGN luminosity function, as it is the simplest to predict, and then the AGN luminosity functions at different wavelengths, which depend on bolometric and obscuration corrections.
5.1 Bolometric luminosity function
We present the predicted bolometric luminosity function compared to our observationally estimated bolometric luminosity function constructed from multiwavelength data. This observationally estimated bolometric luminosity function is described in Appendix C, and is compared to other observational estimates in Appendix C.
The model for SMBH evolution and AGN luminosity also involves some free parameters additional to those in the galaxy formation model, as shown in Table 2. We have calibrated the values of and , and found that the best-fitting values are those adopted in Fanidakis et al. (2012). We show the effect of varying these parameters in Figures 29 and 30. We also slightly adjust the values of and from 0.087 to 0.1. This is for simplicity and to keep the values in line with MHD simulations (e.g. Penna et al., 2013). The value of has been updated from Fanidakis et al. (2012) (c.f. Section 3.1)
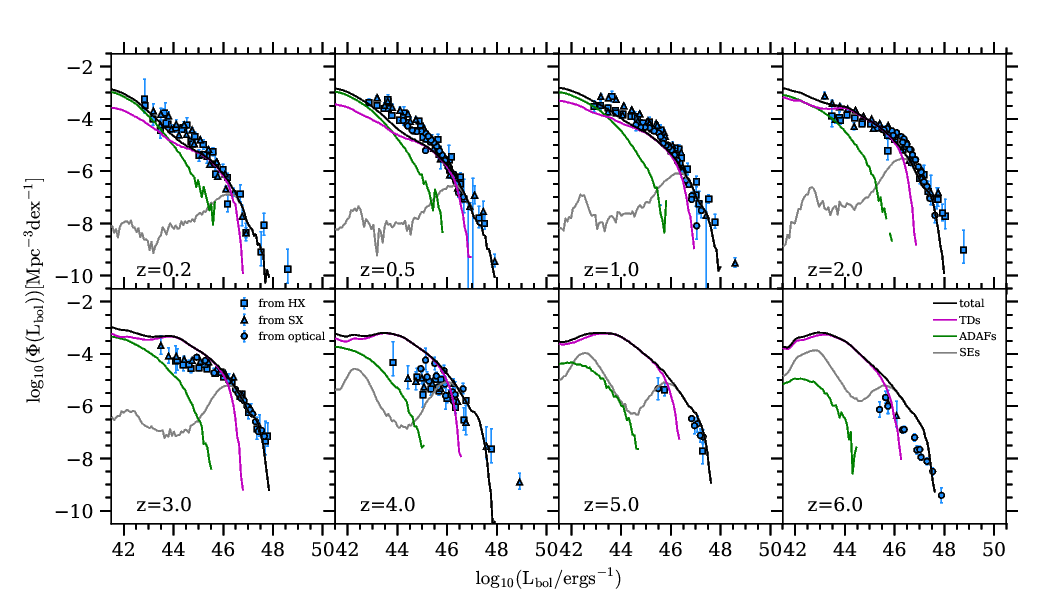
In Figure 14, the predictions (where the black line is the sum of the contributions from all accretion modes) compare well to the observational bolometric luminosity function across the range of redshifts and for the luminosities shown. Exceptions include the faint end at high redshift where the model overpredicts the observations by 0.5 dex for for , and the faint end at low redshift where the model underpredicts the observations for and by 0.5 dex. The underpredictions at the faint end at low redshift may be because the ADAF radiative accretion efficiency is lower than the thin disc accretion efficiency, leading to lower luminosities (see Figure 33 for a prediction using only a thin disc accretion efficiency for all values of ). Alternatively, this discrepancy might be resolved by assuming an accretion timescale with a dependence on accreted gas mass or black hole mass. For a different model, Shirakata et al. (2018) obtain a better fit to the hard X-ray luminosity function at low luminosity and low redshift by doing this. In general, our model is a good match to these observations across a broad range.
We also show in Figure 14 the separate contributions to the AGN luminosity function from ADAFs (), thin discs () and super-Eddington objects (). At low redshift, ADAFs dominate the faint end (), thin discs dominate at intermediate luminosities () and super-Eddington objects dominate the bright end (). As we go to higher redshift, the ADAFs contribution to the luminosity function decreases: for the evolution is not that strong, although the contribution from ADAFs at each luminosity decreases slightly as we increase in this range, whereas for , the evolution in the ADAF population is pronounced, and the number of ADAFs drops off sharply with increasing redshift. In contrast, the contribution from the thin disc population increases until , after which it remains approximately constant. At , there are not very many super-Eddington objects and so they make a fairly small contribution to the luminosity function but their contribution increases at . The distribution of super-Eddington objects is bimodal, and for , the higher luminosity peak has a higher number density, while for , the lower luminosity peak has a higher number density. The bimodality is not due to the bimodality in the fuelling modes, as all the super-Eddington objects are fuelled by starbursts triggered by disc instabilities, but it seems to be caused by a bimodality in the bulge stellar mass. We plan to explore this issue in more detail in future work.
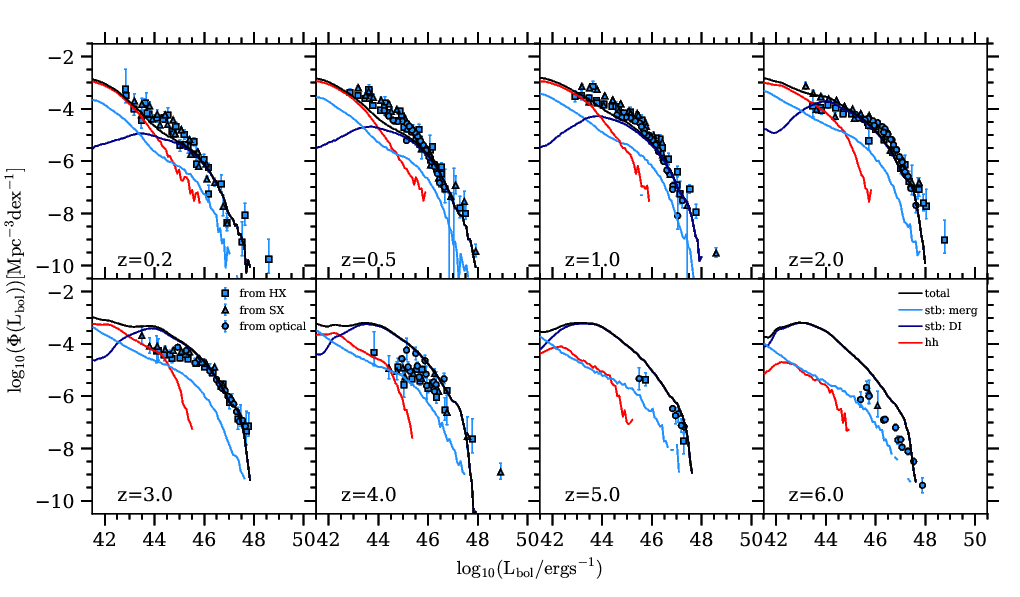
In Figure 15 we split the AGN luminosity function by contributions from the hot halo mode, starbursts triggered by mergers and starbursts triggered by disc instabilities. At low redshift (), the faint end is dominated by the hot halo mode, whereas the bright end is dominated by starbursts triggered by disc instabilities. Starbursts triggered by mergers make a small contribution to the AGN bolometric luminosity function at low redshift. Starbursts triggered by disc instabilities typically have higher values of and so higher luminosities compared to starbursts triggered by mergers, which is why they dominate the bright end.
The hot halo mode only operates in the most massive haloes, and so it only begins to significantly contribute to the AGN luminosity function for . The hot halo mode does not strongly evolve for . For , starbursts triggered by disc instabilities dominate the AGN luminosity function, with starbursts from mergers not significantly contributing. This implies that the inclusion of black hole growth via disc instabilities is significant for reproducing AGN luminosity functions at high redshift.
A key aspect of the success of the galform AGN model is the different channels of black hole growth, particularly the inclusion of disc instability triggered starbursts, that allow a good match to the AGN luminosity functions to be obtained. Other semi-analytic models do not necessarily include disc instabilities, which may explain why they do not reproduce AGN properties particularly well at high redshift (e.g. Bonoli et al., 2009; Menci et al., 2013; Neistein & Netzer, 2014; Enoki et al., 2014). The effect of disc instabilities on the AGN predictions at is shown in Figure 31 and the effect on galaxy properties is shown in Lacey et al. (2016).
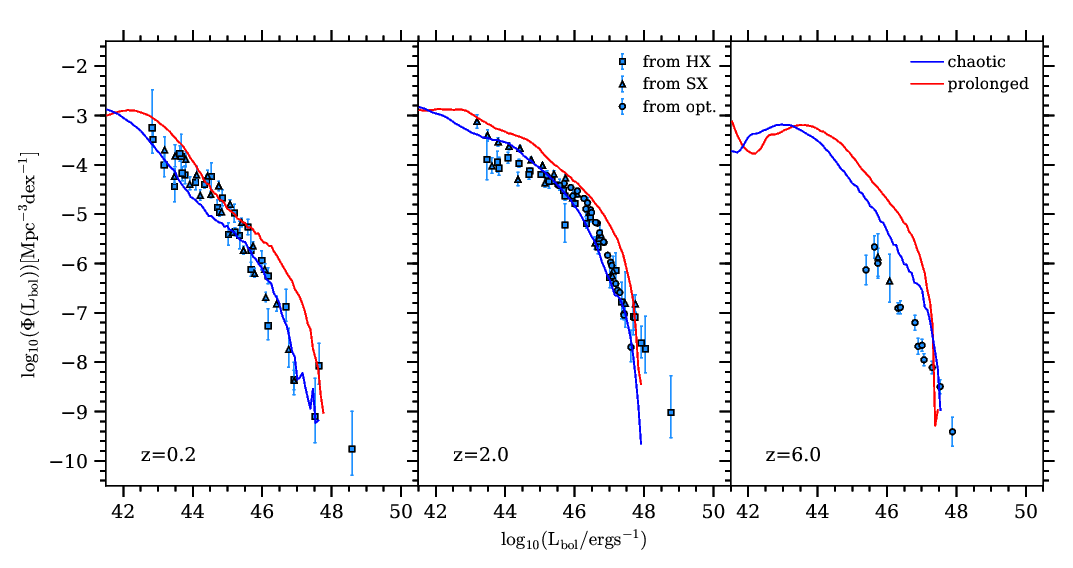
We show the effect on the AGN bolometric luminosity function of changing between chaotic mode (our standard choice) and prolonged mode in Figure 16. In the prolonged mode, SMBH spins are generally higher (see Figure 8), which results in a higher radiative accretion efficiency leading to higher bolometric luminosities.121212Note that the shape of the luminosity function changes little between the two models.
5.2 Luminosity functions at different wavelengths
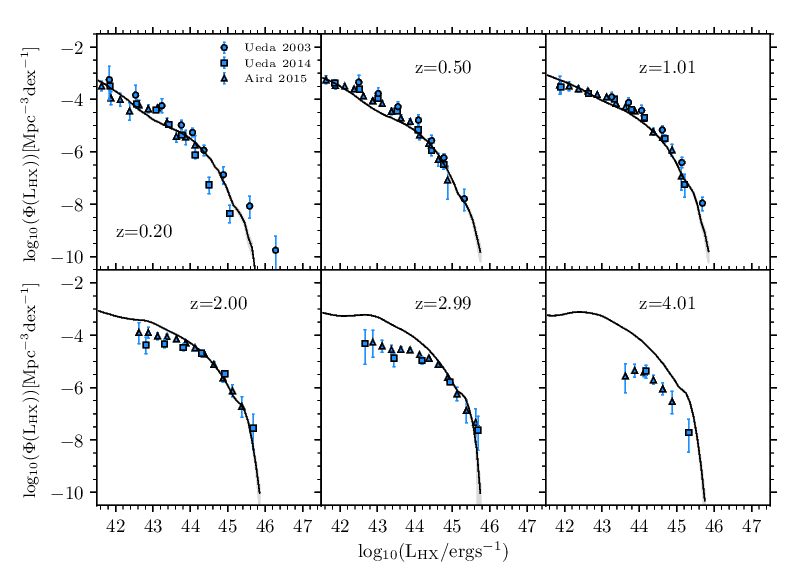
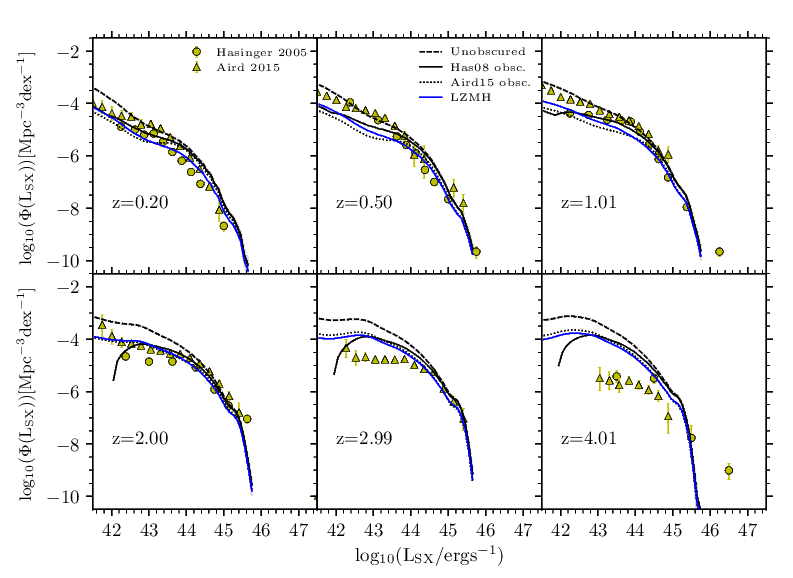
We use the SED template described in Section 3.2 and visible fractions described in Section 3.3 to make predictions for the luminosity function in the rest-frame hard X-ray, soft X-ray and 1500Å bands. in Figure 17 we compare our hard X-ray predictions to observational data. The model is generally in good agreement with the observational data, particularly in the range . For at , the model underpredicts the observations by about 0.5 dex, and for at , the model overpredicts the observations by about 1 dex. The former discrepancy corresponds to the model bolometric luminosity function underpredicting the observations in the same redshift and luminosity regime, and the latter also cooresponds to the bolometric luminosity function slightly overpredicting the observational estimates in that regime, but may also be influenced by our assumption that there is no obscuration for hard X-ray sources. This assumption may be not valid for the high redshift Universe; more observations are needed to constrain the obscuration effect on hard X-rays.
Our soft X-ray predictions are compared to observations in Figure 18. The predicted luminosity function without taking into account obscuration is shown alongside the model with the visible fractions of Hopkins et al. (2007), Hasinger (2008), Aird et al. (2015) and our observationally determined LZMH model. The luminosity functions with different visible fractions are very similar except for . The LZMH model fits best to the observations in the range . At higher redshifts and lower luminosities the visible fraction in the Hasinger (2008) model drops to zero, which causes the corresponding drop off in the luminosity function for that obscuration model.
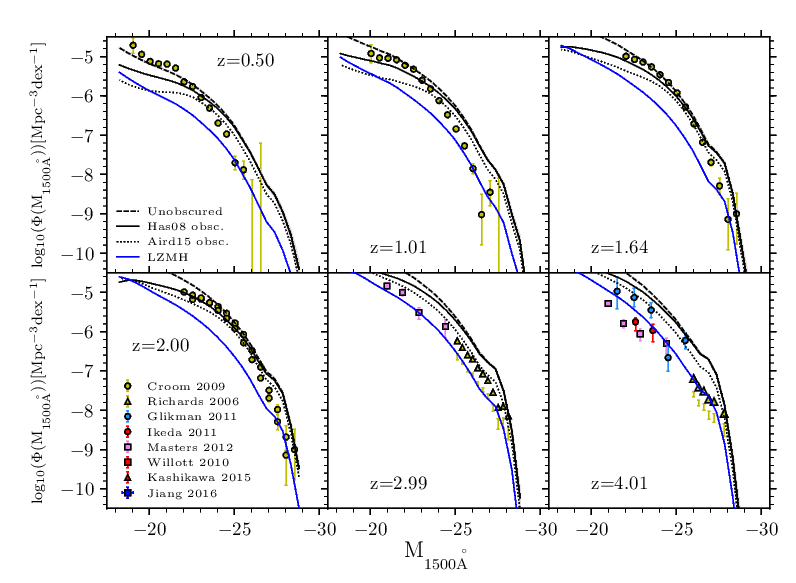
Our 1500Å predictions are shown in Figure 19 compared to observational estimates. These have been converted to 1500Å - the conversions made are detailed in Appendix B. There is a strong dependence of the predictions on the assumed obscuration model. Our predictions are a good fit to observations at if we adopt the Hasinger (2008) visible fraction, whereas our observationally determined LZMH model fits best for . The reason for this difference is likely to be because Hasinger (2008) fitted their obscuration model at lower redshift whereas we are trying to fit for with our LZMH visible fraction. Therefore, unsurprisingly, the different visible fractions are likely to fit better in different redshift ranges.
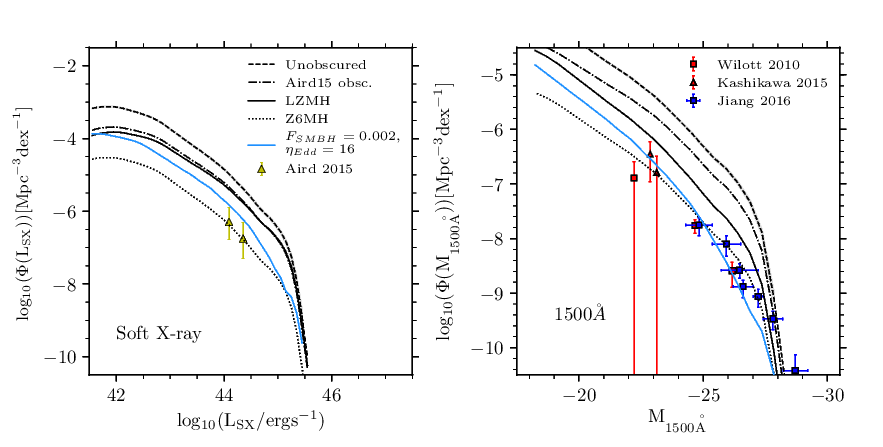
We present the soft X-ray and optical luminosity functions at in Figure 20. The predicted soft X-ray luminosity function exceeds the observations at as a result of the model bolometric luminosity function overpredicting the observations. For the optical luminosity function, while the model gives an acceptable fit to observations of the optical luminosity function at , it overpredicts the number of AGN compared to the observed luminosity function at . This is a result of the model not strongly evolving in the redshift interval , while the observations indicate a stronger evolution in this redshift interval (Jiang et al., 2016). These discrepancies could be due to a variety of reasons. We suggest two possible explanations for this discrepancy and two corresponding variants on the model which provide a better fit to the observations at .
Firstly, the discrepancy could be due to the obscuration model. At the visible fraction is not constrained by any observations, and so in Figure 20 we present predictions with a lower visible fraction at , which give a better fit to the optical luminosity function. We show predictions for the standard model with two obscuration models: the LZMH visible fraction and the Z6MH visible fraction (c.f. Section 3.3). The Z6MH visible fraction needed to fit is about a quarter of the LZMH visible fraction at . Thus QSOs could be much more obscured than QSOs.
Secondly, the discrepancy could be due to black hole accretion being less efficient at high redshift. While the model for black hole accretion has been calibrated at low redshift, the conditions for black hole accretion could be different at higher redshift. We therefore present a model with parameters that have been modified compared to the original calibration on observed data at low redshift. We change the parameter , which sets the fraction of mass accreted onto a black hole in a starburst event and the parameter , which controls the degree of super-Eddington luminosity suppression. In the fiducial model, and . and give a better fit to the observations of the luminosity function at in Figure 20. However, we note that means that there is very little super-Eddington luminosity suppression, whereas the ‘slim disc’ model for super-Eddington sources predicts significant super-Eddington luminosity suppression. We refer to this model as the ‘low accretion efficiency model’. In this model we use the LZMH visible fraction.
Both of these alternative models are in better agreement with observations of the AGN luminosity function at than our standard model, and so we will use them for future studies inestigating AGN observed in future surveys.
5.3 Comparison with hydrodynamical simulations
An alternative theoretical approach for simulating galaxy formation is hydrodynamical simulations. A few of these simulations have been used to make predictions for the evolution of AGN luminosity functions through time. We give a brief comparison to some of these here.
The bolometric luminosity function predicted by the model in Hirschmann et al. (2014) over the redshift range is shown in their Figure 8. When compared to Hopkins et al. (2007), their model is a good fit to the observations at , but overpredicts the observations at the faint end at , and underpredicts the observations at . When comparing their results to the model presented in this paper (c.f. Figure 14), our model agrees similarly well with the observations for , and with better agreement to the observations for . For example, at , at (around the knee of the luminosity function at this redshift), our model agrees within 0.5 dex with the observed bolometric luminosity function, whereas the model of Hirschmann et al. (2014) underpredicts the observed bolometric luminosity function by 1 dex at this redshift and luminosity. The hard X-ray luminosity function predicted by EAGLE in Rosas-Guevara et al. (2016) is compared to the observational estimate of Aird et al. (2015) over the redshift range in their Figure 7. Their model fits well to the observations at , but by , the slope of the luminosity function in their work is steeper than the observations. The model in this paper is in similar agreement for , and in better agreement with the observations for . For example, at , at (around the knee of the luminosity function at this redshift), our model agrees within 0.5 dex with the observations, whereas the model of Rosas-Guevara et al. (2016) underpredicts the observations by about 1 dex. Finally, Weinberger et al. (2018) compare the bolometric luminosity function from IllustrisTNG to Hopkins et al. (2007) in the redshift range . Their model underpredicts the observations at the faint and bright end of the bolometric luminosity function and overpredicts the observations at intermediate luminosities at , and overpredicts the observations at all luminosities at . Around the knee of the luminosity function at (), our model agrees within 0.5 dex with the observations, whereas the model of Weinberger et al. (2018) overpredicts the observations by 0.5 dex.
Overall, the AGN luminosity functions from the hydrodynamical simulations do not agree as well to the observational estimates as this model. The reasons for the differences in the AGN luminosity functions may be because the black hole mass accretion rates are calculated differently - in these simulations the Bondi-Hoyle approximation is used, as opposed to the calculation in Section 3.1 used in this work.
6 Conclusions
Understanding the evolution of AGN across cosmic time has been of interest ever since they were discovered. AGN have also been shown to be important in how galaxies evolve through AGN feedback. However, many uncertainties remain, such as the nature of the physical processes involved in AGN feedback.
We present predictions for the evolution of SMBHs and AGN at using a high volume, high resolution dark matter simulation (P-Millennium) populated with galaxies using the semi-analytic model of galaxy formation galform. This updated scheme for the SMBH spin evolution is used within the Lacey et al. (2016) galform model as updated by Baugh et al. (2018) for the P-Millennium simulation. The Lacey et al. (2016) model has been shown to reproduce a large number of observable galaxy properties over an unprecedented wavelength and redshift range. The model that we use incorporates an updated prescription for SMBH spin evolution: for these predictions we have assumed SMBH spin evolving in a ‘chaotic accretion’ scenario in which the angle between the accretion disc and the SMBH spin randomises once a self-gravity mass of gas has been consumed.
We then calculated AGN bolometric luminosities from the SMBH mass accretion rate, taking into account the SMBH spin and the different radiative efficiencies for different accretion regimes (ADAFs, thin discs, super Eddington objects). Then using a template SED and different obscuration models we derived AGN luminosities in the hard X-ray, soft X-ray and optical/UV (1500Å) bands.
The model predictions are consistent with both the observed black hole mass functions and SMBH mass versus bulge mass correlations. We present the spin distribution of SMBHs in the simulation, for the chaotic and prolonged modes of accretion, and their evolution for . The median SMBH spin in both the chaotic and prolonged modes evolves very little. For the prolonged mode, the scatter in the SMBH spin distribution decreases with increasing redshift. We also present examples of the evolution of spin and mass for typical SMBHs, and find that for most masses the evolution is similar, except at the highest masses, , where mergers cause the SMBHs to be spun up to higher spin values.
We compare the AGN luminosity functions in the redshift range to a wide range of observations at different wavelengths. The model is in good agreement with the observations. We split the luminosity functions by accretion mode (ADAFs, thin discs, super-Eddington objects) and by fuelling mode (hot halo or starbursts triggered by disk instabilities or mergers) to see the relative contributions. At low redshifts, , and low luminosities, , the ADAF contribution dominates but at higher luminosities and higher redshifts, the thin disc and super-Eddington objects dominate the luminosity function. Hot halo mode fuelled accretion dominates at , and , but at higher redshift and higher luminosity, starbursts triggered by disc instabilities dominate the luminosity function.
There are many natural continuations from this work. We have already mentioned that we always assume a quasar SED for our bolometric corrections, while in reality we have a variety of AGNs having different accretion rates in different accretion regimes, which will have different SED shapes (e.g. Jin et al., 2012). Using different template SEDs for different regimes may allow the model to predict luminosity functions in better agreement with the observations. Secondly, we could more thoroughly explore the dependence of the model on the SMBH spin evolution model used e.g. investigating the dependence of the results on the size of the increments in mass used in the SMBH accretion calculation. Finally, in this paper we do not show radio luminosity functions - given that AGN jets are observed to have a strong effect on their host galaxies and given that these jets emit at radio wavelengths via synchrotron emission, an investigation into radio emission would also be important for understanding the role of AGN in galaxy evolution.
Acknowledgements
This work was supported by the Science and Technology facilities Council ST/L00075X/1. AJG acknowledges an STFC studentship funded by STFC grant ST/N50404X/1. CL is funded by an Australian Research Council Discovery Early Career Researcher Award (DE150100618) and by the Australian Research Council Centre of Excellence for All Sky Astrophysics in 3 Dimensions (ASTRO 3D), through project number CE170100013. This work used the DiRAC Data Centric system at Durham University, operated by the Institute for Computational Cosmology on behalf of the STFC DiRAC HPC Facility (www.dirac.ac.uk). This equipment was funded by BIS National E-infrastructure capital grant ST/K00042X/1, STFC capital grants ST/H008519/1 and ST/K00087X/1, STFC DiRAC Operations grant ST/K003267/1 and Durham University. DiRAC is part of the National E-Infrastructure.
References
- Abramowicz et al. (1988) Abramowicz M. A., Czerny B., Lasota J. P., Szuszkiewicz E., 1988, ApJ, 332, 646
- Aird et al. (2015) Aird J., Coil A. L., Georgakakis A., Nandra K., Barro G., Pérez-González P. G., 2015, MNRAS, 451, 1892
- Barausse (2012) Barausse E., 2012, MNRAS, 423, 2533
- Bardeen (1970) Bardeen J. M., 1970, Nature, 226, 64
- Bardeen & Petterson (1975) Bardeen J. M., Petterson J. A., 1975, ApJ, 195, L65
- Bardeen et al. (1972) Bardeen J. M., Press W. H., Teukolsky S. A., 1972, ApJ, 178, 347
- Baugh et al. (2005) Baugh C. M., Lacey C. G., Frenk C. S., Granato G. L., Silva L., Bressan A., Benson A. J., Cole S., 2005, MNRAS, 356, 1191
- Baugh et al. (2018) Baugh C. M., et al., 2018, preprint, (arXiv:1808.08276)
- Benson et al. (2012) Benson A. J., Borgani S., De Lucia G., Boylan-Kolchin M., Monaco P., 2012, MNRAS, 419, 3590
- Berti & Volonteri (2008) Berti E., Volonteri M., 2008, ApJ, 684, 822
- Blandford & Payne (1982) Blandford R. D., Payne D. G., 1982, MNRAS, 199, 883
- Blandford & Znajek (1977) Blandford R. D., Znajek R. L., 1977, MNRAS, 179, 433
- Blanton et al. (2011) Blanton E. L., Randall S. W., Clarke T. E., Sarazin C. L., McNamara B. R., Douglass E. M., McDonald M., 2011, ApJ, 737, 99
- Bonoli et al. (2009) Bonoli S., Marulli F., Springel V., White S. D. M., Branchini E., Moscardini L., 2009, MNRAS, 396, 423
- Bournaud et al. (2005) Bournaud F., Combes F., Semelin B., 2005, MNRAS, 364, L18
- Bournaud et al. (2007) Bournaud F., Elmegreen B. G., Elmegreen D. M., 2007, ApJ, 670, 237
- Bower et al. (2006) Bower R. G., Benson A. J., Malbon R., Helly J. C., Frenk C. S., Baugh C. M., Cole S., Lacey C. G., 2006, MNRAS, 370, 645
- Boyle et al. (1990) Boyle B. J., Fong R., Shanks T., Peterson B. A., 1990, MNRAS, 243, 1
- Brenneman & Reynolds (2006) Brenneman L. W., Reynolds C. S., 2006, ApJ, 652, 1028
- Chiang & Fabian (2011) Chiang C.-Y., Fabian A. C., 2011, MNRAS, 414, 2345
- Cole et al. (1994) Cole S., Aragon-Salamanca A., Frenk C. S., Navarro J. F., Zepf S. E., 1994, MNRAS, 271, 781
- Cole et al. (2000) Cole S., Lacey C. G., Baugh C. M., Frenk C. S., 2000, MNRAS, 319, 168
- Collin-Souffrin & Dumont (1990) Collin-Souffrin S., Dumont A. M., 1990, A&A, 229, 292
- Cowley et al. (2018) Cowley W. I., Baugh C. M., Cole S., Frenk C. S., Lacey C. G., 2018, MNRAS, 474, 2352
- Croom et al. (2009) Croom S. M., et al., 2009, MNRAS, 399, 1755
- Croton et al. (2016) Croton D. J., et al., 2016, ApJS, 222, 22
- De Lucia et al. (2011) De Lucia G., Fontanot F., Wilman D., Monaco P., 2011, MNRAS, 414, 1439
- Di Matteo et al. (2005) Di Matteo T., Springel V., Hernquist L., 2005, Nature, 433, 604
- Done et al. (2013) Done C., Jin C., Middleton M., Ward M., 2013, MNRAS, 434, 1955
- Dotti et al. (2013) Dotti M., Colpi M., Pallini S., Perego A., Volonteri M., 2013, ApJ, 762, 68
- Efstathiou et al. (1982) Efstathiou G., Lake G., Negroponte J., 1982, MNRAS, 199, 1069
- Elmegreen et al. (2008) Elmegreen B. G., Bournaud F., Elmegreen D. M., 2008, ApJ, 688, 67
- Enoki et al. (2014) Enoki M., Ishiyama T., Kobayashi M. A. R., Nagashima M., 2014, ApJ, 794, 69
- Fan et al. (2001) Fan X., et al., 2001, AJ, 122, 2833
- Fanidakis et al. (2011) Fanidakis N., Baugh C. M., Benson A. J., Bower R. G., Cole S., Done C., Frenk C. S., 2011, MNRAS, 410, 53
- Fanidakis et al. (2012) Fanidakis N., et al., 2012, MNRAS, 419, 2797
- Fanidakis et al. (2013) Fanidakis N., Macciò A. V., Baugh C. M., Lacey C. G., Frenk C. S., 2013, MNRAS, 436, 315
- Fiacconi et al. (2018) Fiacconi D., Sijacki D., Pringle J. E., 2018, MNRAS, 477, 3807
- Forman et al. (2005) Forman W., et al., 2005, ApJ, 635, 894
- Georgakakis et al. (2015) Georgakakis A., et al., 2015, MNRAS, 453, 1946
- Glikman et al. (2011) Glikman E., Djorgovski S. G., Stern D., Dey A., Jannuzi B. T., Lee K.-S., 2011, ApJ, 728, L26
- Gonzalez-Perez et al. (2018) Gonzalez-Perez V., et al., 2018, MNRAS, 474, 4024
- Hasinger (2008) Hasinger G., 2008, A&A, 490, 905
- Hasinger et al. (2005) Hasinger G., Miyaji T., Schmidt M., 2005, A&A, 441, 417
- Hawley & Balbus (2002) Hawley J. F., Balbus S. A., 2002, ApJ, 573, 738
- Hawley & Krolik (2006) Hawley J. F., Krolik J. H., 2006, ApJ, 641, 103
- Hawley et al. (1995) Hawley J. F., Gammie C. F., Balbus S. A., 1995, ApJ, 440, 742
- Helly et al. (2003) Helly J. C., Cole S., Frenk C. S., Baugh C. M., Benson A., Lacey C., 2003, MNRAS, 338, 903
- Hirschmann et al. (2012) Hirschmann M., Somerville R. S., Naab T., Burkert A., 2012, MNRAS, 426, 237
- Hirschmann et al. (2014) Hirschmann M., Dolag K., Saro A., Bachmann L., Borgani S., Burkert A., 2014, MNRAS, 442, 2304
- Hohl (1971) Hohl F., 1971, ApJ, 168, 343
- Hopkins et al. (2007) Hopkins P. F., Richards G. T., Hernquist L., 2007, ApJ, 654, 731
- Ikeda et al. (2011) Ikeda H., et al., 2011, ApJ, 728, L25
- Jahnke & Macciò (2011) Jahnke K., Macciò A. V., 2011, ApJ, 734, 92
- Jiang et al. (2008) Jiang C. Y., Jing Y. P., Faltenbacher A., Lin W. P., Li C., 2008, ApJ, 675, 1095
- Jiang et al. (2009) Jiang L., et al., 2009, AJ, 138, 305
- Jiang et al. (2014) Jiang L., Helly J. C., Cole S., Frenk C. S., 2014, MNRAS, 440, 2115
- Jiang et al. (2016) Jiang L., et al., 2016, ApJ, 833, 222
- Jin et al. (2012) Jin C., Ward M., Done C., 2012, MNRAS, 425, 907
- Kashikawa et al. (2015) Kashikawa N., et al., 2015, ApJ, 798, 28
- Kauffmann & Haehnelt (2000) Kauffmann G., Haehnelt M., 2000, MNRAS, 311, 576
- Kauffmann et al. (1999) Kauffmann G., Colberg J. M., Diaferio A., White S. D. M., 1999, MNRAS, 303, 188
- Khandai et al. (2012) Khandai N., Feng Y., DeGraf C., Di Matteo T., Croft R. A. C., 2012, MNRAS, 423, 2397
- King et al. (2005) King A. R., Lubow S. H., Ogilvie G. I., Pringle J. E., 2005, MNRAS, 363, 49
- King et al. (2008) King A. R., Pringle J. E., Hofmann J. A., 2008, MNRAS, 385, 1621
- Kinney et al. (2000) Kinney A. L., Schmitt H. R., Clarke C. J., Pringle J. E., Ulvestad J. S., Antonucci R. R. J., 2000, ApJ, 537, 152
- Kudoh et al. (1998) Kudoh T., Matsumoto R., Shibata K., 1998, ApJ, 508, 186
- Lacey & Cole (1993) Lacey C., Cole S., 1993, MNRAS, 262, 627
- Lacey et al. (2016) Lacey C. G., et al., 2016, MNRAS, 462, 3854
- Lagos et al. (2008) Lagos C. D. P., Cora S. A., Padilla N. D., 2008, MNRAS, 388, 587
- Lagos et al. (2009) Lagos C. D. P., Padilla N. D., Cora S. A., 2009, MNRAS, 395, 625
- Lagos et al. (2018) Lagos C. d. P., Tobar R. J., Robotham A. S. G., Obreschkow D., Mitchell P. D., Power C., Elahi P. J., 2018, preprint, (arXiv:1807.11180)
- Liu & Wu (2013) Liu H., Wu Q., 2013, ApJ, 764, 17
- Mahadevan (1997) Mahadevan R., 1997, ApJ, 477, 585
- Malbon et al. (2007) Malbon R. K., Baugh C. M., Frenk C. S., Lacey C. G., 2007, MNRAS, 382, 1394
- Marconi et al. (2004) Marconi A., Risaliti G., Gilli R., Hunt L. K., Maiolino R., Salvati M., 2004, MNRAS, 351, 169
- Marulli et al. (2008) Marulli F., Bonoli S., Branchini E., Moscardini L., Springel V., 2008, MNRAS, 385, 1846
- Masters et al. (2012) Masters D., et al., 2012, ApJ, 755, 169
- McConnell & Ma (2013) McConnell N. J., Ma C.-P., 2013, ApJ, 764, 184
- McCullagh et al. (2017) McCullagh N., Norberg P., Cole S., Gonzalez-Perez V., Baugh C., Helly J., 2017, preprint, (arXiv:1705.01988)
- McKinney (2005) McKinney J. C., 2005, ApJ, 630, L5
- Menci et al. (2013) Menci N., Fiore F., Lamastra A., 2013, ApJ, 766, 110
- Menci et al. (2014) Menci N., Gatti M., Fiore F., Lamastra A., 2014, A&A, 569, A37
- Mihos & Hernquist (1996) Mihos J. C., Hernquist L., 1996, ApJ, 464, 641
- Natarajan & Pringle (1998) Natarajan P., Pringle J. E., 1998, ApJ, 506, L97
- Neistein & Netzer (2014) Neistein E., Netzer H., 2014, MNRAS, 437, 3373
- Oke & Gunn (1983) Oke J. B., Gunn J. E., 1983, ApJ, 266, 713
- Parkinson et al. (2008) Parkinson H., Cole S., Helly J., 2008, MNRAS, 383, 557
- Peng et al. (2006) Peng C. Y., Impey C. D., Rix H.-W., Kochanek C. S., Keeton C. R., Falco E. E., Lehár J., McLeod B. A., 2006, ApJ, 649, 616
- Penna et al. (2013) Penna R. F., Sa̧dowski A., Kulkarni A. K., Narayan R., 2013, MNRAS, 428, 2255
- Planck Collaboration et al. (2014) Planck Collaboration et al., 2014, A&A, 571, A16
- Pounds et al. (2003) Pounds K. A., Reeves J. N., King A. R., Page K. L., O’Brien P. T., Turner M. J. L., 2003, MNRAS, 345, 705
- Pringle (1981) Pringle J. E., 1981, ARA&A, 19, 137
- Randall et al. (2011) Randall S. W., et al., 2011, ApJ, 726, 86
- Reeves et al. (2003) Reeves J. N., O’Brien P. T., Ward M. J., 2003, ApJ, 593, L65
- Rezzolla et al. (2008) Rezzolla L., Barausse E., Dorband E. N., Pollney D., Reisswig C., Seiler J., Husa S., 2008, Phys. Rev. D, 78, 044002
- Richards et al. (2006) Richards G. T., et al., 2006, AJ, 131, 2766
- Rosas-Guevara et al. (2016) Rosas-Guevara Y., Bower R. G., Schaye J., McAlpine S., Dalla Vecchia C., Frenk C. S., Schaller M., Theuns T., 2016, MNRAS, 462, 190
- Rupke & Veilleux (2011) Rupke D. S. N., Veilleux S., 2011, ApJ, 729, L27
- Saha & Cortesi (2018) Saha K., Cortesi A., 2018, ApJ, 862, L12
- Sajina et al. (2007) Sajina A., Yan L., Lacy M., Huynh M., 2007, ApJ, 667, L17
- Sa̧dowski et al. (2013) Sa̧dowski A., Narayan R., Penna R., Zhu Y., 2013, MNRAS, 436, 3856
- Schmidt (1968) Schmidt M., 1968, ApJ, 151, 393
- Schulze & Wisotzki (2010) Schulze A., Wisotzki L., 2010, A&A, 516, A87
- Shakura & Sunyaev (1973) Shakura N. I., Sunyaev R. A., 1973, A&A, 24, 337
- Shankar et al. (2004) Shankar F., Salucci P., Granato G. L., De Zotti G., Danese L., 2004, MNRAS, 354, 1020
- Shankar et al. (2009) Shankar F., Weinberg D. H., Miralda-Escudé J., 2009, ApJ, 690, 20
- Sharma et al. (2007) Sharma P., Quataert E., Hammett G. W., Stone J. M., 2007, ApJ, 667, 714
- Shirakata et al. (2018) Shirakata H., et al., 2018, preprint, (arXiv:1802.02169)
- Sijacki et al. (2015) Sijacki D., Vogelsberger M., Genel S., Springel V., Torrey P., Snyder G. F., Nelson D., Hernquist L., 2015, MNRAS, 452, 575
- Simha & Cole (2017) Simha V., Cole S., 2017, MNRAS, 472, 1392
- Soltan (1982) Soltan A., 1982, MNRAS, 200, 115
- Springel et al. (2005) Springel V., et al., 2005, Nature, 435, 629
- Tchekhovskoy & McKinney (2012) Tchekhovskoy A., McKinney J. C., 2012, MNRAS, 423, L55
- Ueda et al. (2003) Ueda Y., Akiyama M., Ohta K., Miyaji T., 2003, ApJ, 598, 886
- Ueda et al. (2014) Ueda Y., Akiyama M., Hasinger G., Miyaji T., Watson M. G., 2014, ApJ, 786, 104
- Vestergaard & Osmer (2009) Vestergaard M., Osmer P. S., 2009, ApJ, 699, 800
- Volonteri (2010) Volonteri M., 2010, A&ARv, 18, 279
- Volonteri et al. (2007) Volonteri M., Sikora M., Lasota J.-P., 2007, ApJ, 667, 704
- Volonteri et al. (2016) Volonteri M., Dubois Y., Pichon C., Devriendt J., 2016, MNRAS, 460, 2979
- Watarai et al. (2000) Watarai K.-y., Fukue J., Takeuchi M., Mineshige S., 2000, PASJ, 52, 133
- Weinberger et al. (2018) Weinberger R., et al., 2018, MNRAS, 479, 4056
- White & Frenk (1991) White S. D. M., Frenk C. S., 1991, ApJ, 379, 52
- White & Rees (1978) White S. D. M., Rees M. J., 1978, MNRAS, 183, 341
- Willott et al. (2010) Willott C. J., et al., 2010, AJ, 139, 906
- Wu et al. (2015) Wu X.-B., et al., 2015, Nature, 518, 512
- Younger et al. (2008) Younger J. D., Hopkins P. F., Cox T. J., Hernquist L., 2008, ApJ, 686, 815
- Yuan & Narayan (2014) Yuan F., Narayan R., 2014, ARA&A, 52, 529
- Yuan et al. (2003) Yuan F., Quataert E., Narayan R., 2003, ApJ, 598, 301
Appendix A Effects of varying SMBH seed mass
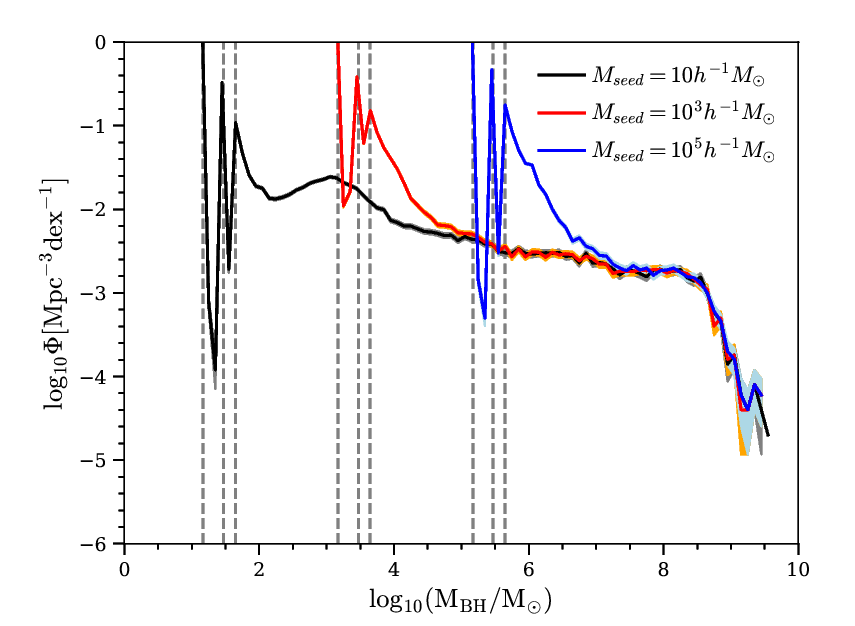
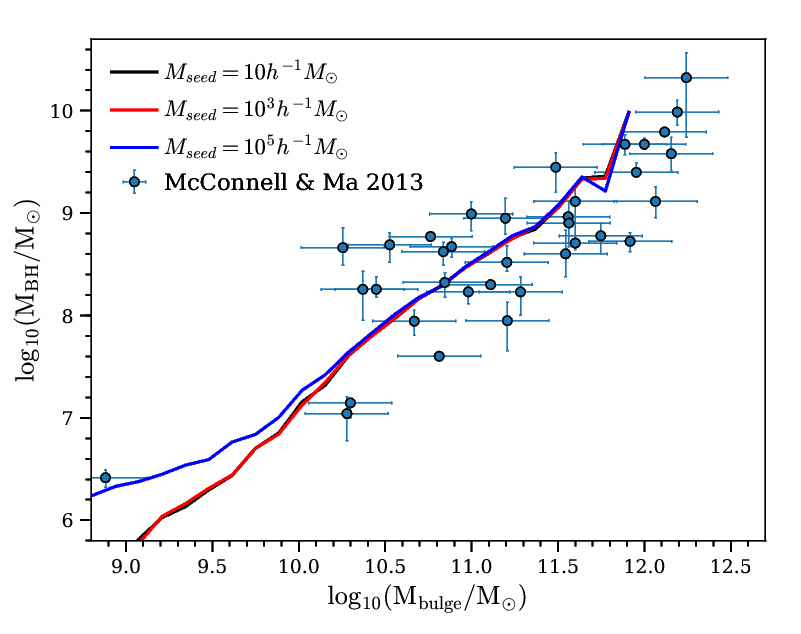
In Figure 21 we show the effect of varying the SMBH seed mass on the black hole mass function at . We show plots for SMBH seed masses of (the default value), and . Generally the black hole mass function reaches a converged value at about 100 times the black hole seed mass. We also plot as vertical lines , and . It can be seen that the spikes in the black hole mass function occur at these values due to SMBH seeds merging with other SMBH seeds.
This convergence in properties at around 100 times the seed mass can also be seen in Figure 22, where the median of the SMBH mass versus bulge mass relation for seeds of mass only converges with that for the other seed masses for SMBH masses above around .
Appendix B Calculating broad-band optical magnitudes for AGN
We define the filter-averaged luminosity per unit frequency for a filter R in the observer frame at redshift as:
| (47) |
where is the luminosity per unit frequency in the rest frame, is the response function of the filter at observed frequency . The absolute magnitude in the AB system in the observer frame band defined by the filter R for redshift , is then defined as:
| (48) |
where with Jy, the flux corresponding to an apparent AB magnitude of 0, and the corresponding luminosity per unit frequency for an absolute AB magnitude of 0. We remind readers that monochromatic AB (Absolute Bolometric) apparent magnitudes are defined using the following relation (Oke & Gunn, 1983):
| (49) |
where is the observed flux of the source, which is related to the luminosity per unit frequency in the rest-frame of the object as:
| (50) |
The apparent and observer frame absolute magnitudes for a filter R are then related by
| (51) |
We then use the following formulae to convert the observational data from the different wavelengths given to rest-frame wavelength 1500Å. Note that we are are only comparing continuum luminosities in this study, which is consistent with the Marconi et al. (2004) template used throughout this paper. The data presented in the studies that we use have the contribution from the emission lines removed and so this is an appropriate comparison. The results presented in Richards et al. (2006) are given in the K-corrected SDSS i band at , which we write as . This is given by , where we define as the absolute magnitude at the rest-frame wavelength corresponding to the observed i-band at , as in equations (48) and (51). To convert from to 1500Å, we follow Richards et al. (2006) by using but using a spectral index value of from Marconi et al. (2004) instead of in Richards et al. (2006). First we convert from to using equations (47) and (48):
| (52) | ||||
where is the absolute magnitude at the central wavelength of the rest-frame i-band () corresponding to equation (48) for . Then we relate to the absolute magnitude at rest-frame , , to give the conversion to :
| (53) | ||||
where in the last line we used equation (52). Jiang et al. (2009); Willott et al. (2010); Ikeda et al. (2011); Masters et al. (2012); Kashikawa et al. (2015) report observed absolute continuum magnitudes, , corresponding to rest frame . These absolute magnitudes are defined without the extra redshift factor included in the Richards et al. (2006) definition. These absolute magnitudes at , , can be converted to 1500Å using:
| (54) | ||||
Finally Croom et al. (2009) report observations in the SDSS g-band () K-corrected to , so we use the correction in their paper:
| (55) |
and combine it with the above relation to give:
| (56) |
Appendix C Visible and obscured fractions for AGN
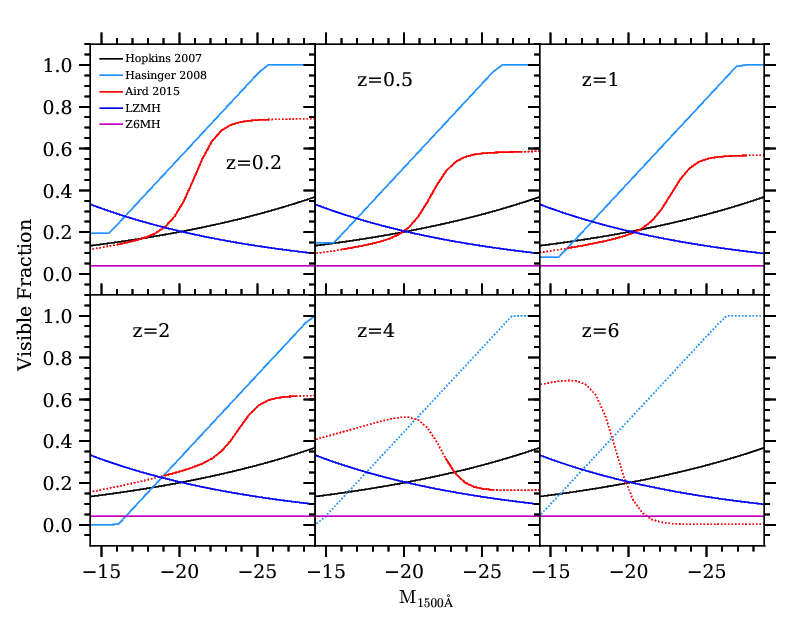
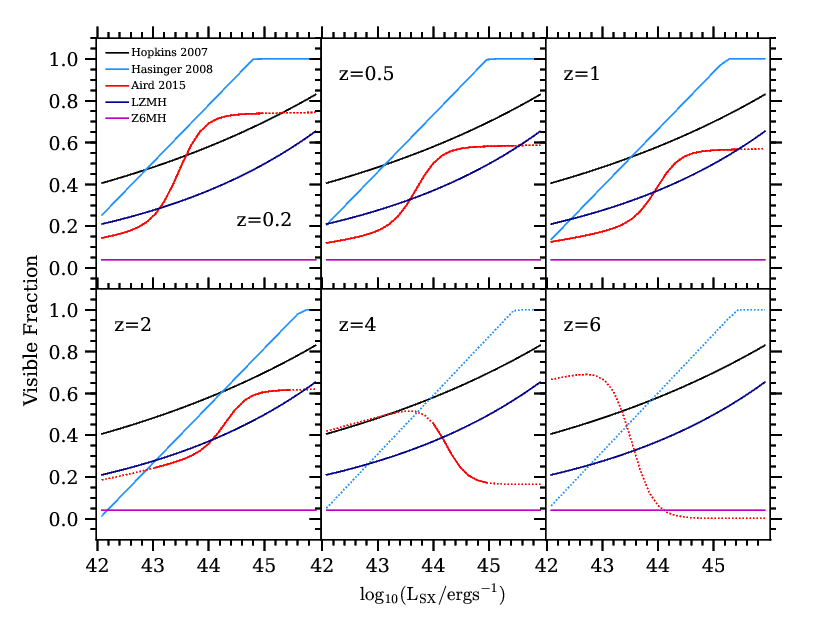
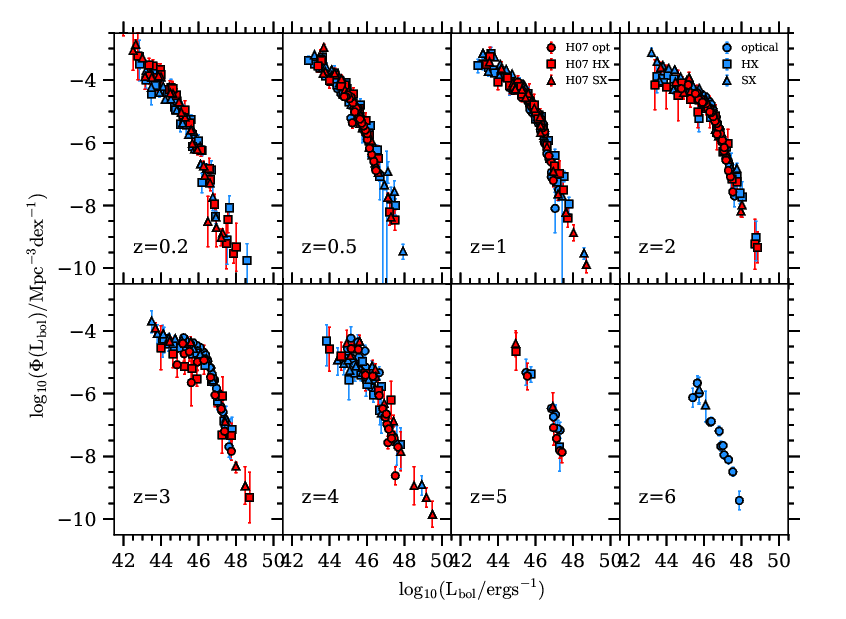
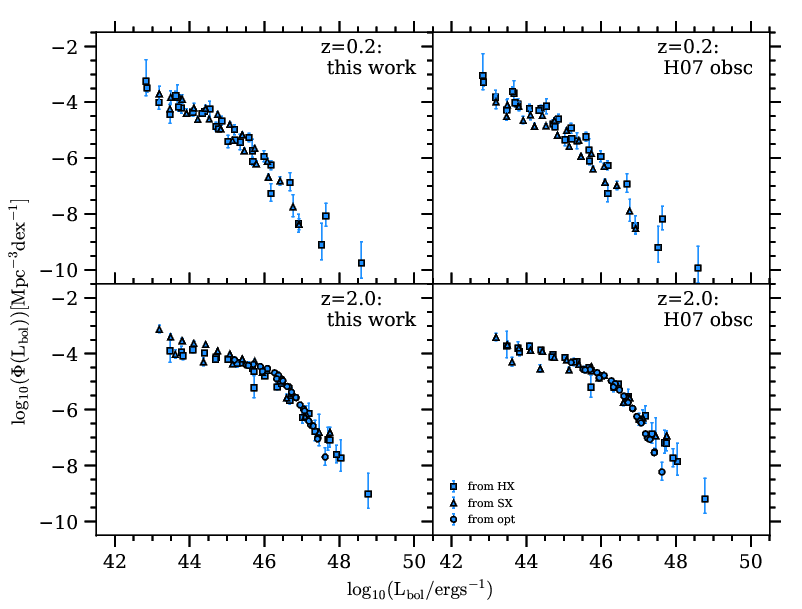
The AGN visible fractions (the fraction of sources at a particular luminosity and redshift that are unobscured) derived in this paper have been estimated by constructing an observational bolometric luminosity function from observed luminosity functions at X-ray and optical wavelengths. These luminosities were converted to bolometric using the Marconi et al. (2004) AGN SED, and then the observed number densities were converted to total number densities using visible fractions of a functional form similar to Hopkins et al. (2007) dependent only on (c.f. equation (40)). We assumed that there is no obscuration for hard X-ray wavelengths. The coefficients in the expressions for the visible fractions were then selected (c.f. equations (43), (44) and (45)) so as to minimise the scatter in the estimated bolometric luminosity function.
To construct a bolometric luminosity function from multiple sets of observations in different wavebands, different authors use different template SEDs. Some authors include reprocessed radiation from dust (its inclusion causes an ‘IR bump’ in the SED) whereas some do not. Including reprocessed radiation gives observed bolometric luminosities, whereas not including the IR bump gives intrinsic bolometric luminosities. The intrinsic bolometric luminosities are isotropic, while the observed bolometric luminosities are not isotropic because the obscuring torus is not isotropic. The observed bolometric luminosity functions of Hopkins et al. (2007) are given in terms of observed rather than intrinsic bolometric luminosities, so when we compare with these, we multiply the luminosities of Hopkins et al. (2007) by a factor (c.f. Marconi et al., 2004) to account for this effect.
We show a comparison of the different obscuration models at in Figure 23 and at soft X-ray energies in Figure 24. The values from different studies are not all on a single curve, and so there is clearly still some uncertainty in the visible fraction.
Our bolometric luminosity function is shown compared to the bolometric luminosity functions estimated in Hopkins et al. (2007) in Figure 25, and the two are in agreement. The bolometric luminosity function derived in this work is also similar to that determined by Shankar et al. (2009).
Our observationally estimated visible fractions are redshift independent by construction. We have explored whether a better fit could be obtained by including a redshift dependence. To obtain a better fit, the visible fraction needs to increase and then decrease with redshift (c.f. the redshift dependence derived by Aird et al., 2015), but even with a functional form to allow this, the scatter in the bolometric luminosity function was only slightly less than for redshift independent versions of the visible fraction.
To quantify the effect of using the new visible fraction derived in this paper, we compare the bolometric luminosity function derived using the Hopkins et al. (2007) visible fraction, to the bolometric luminosity function derived using the visible fraction presented in this paper, in Figure 26. The new visible fraction does improve the constructed bolometric luminosity function, this reduction in scatter can be seen particularly at at and at at .
Appendix D The effect of the time averaging method
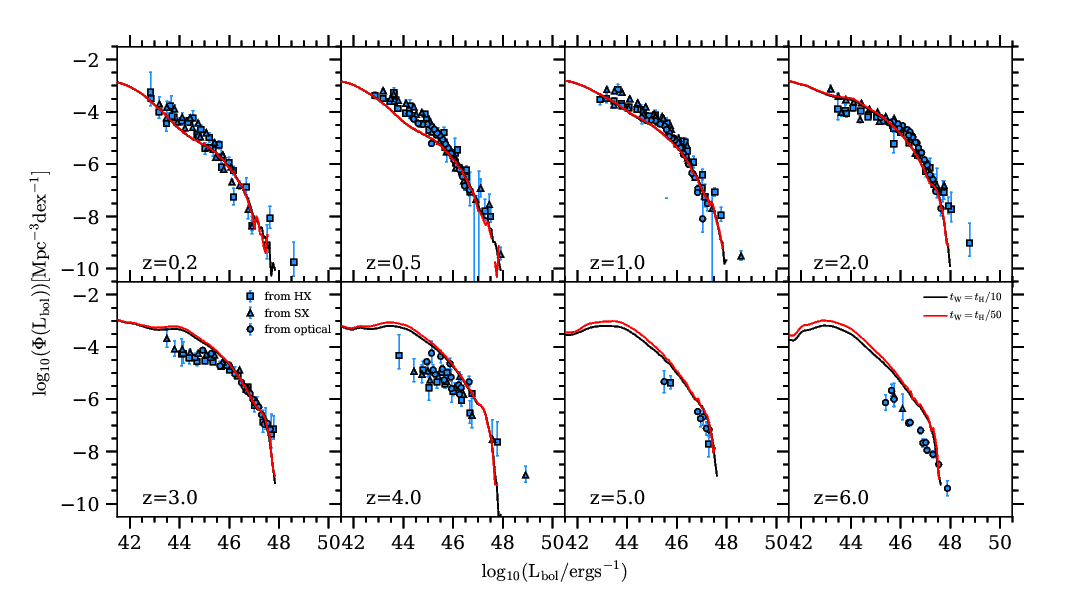
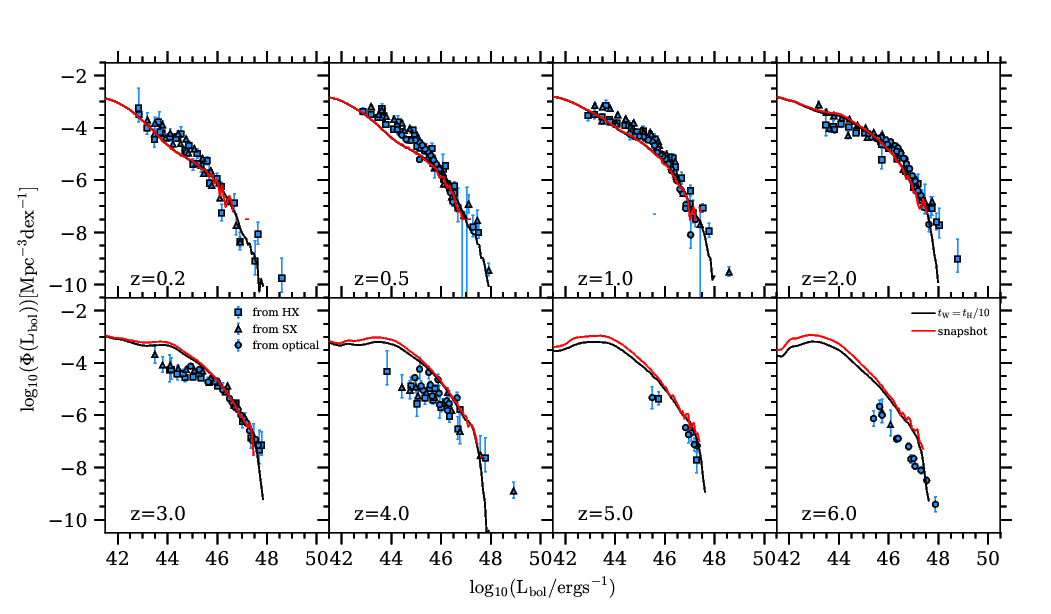
In this appendix, we show the effect of varying on the AGN luminosity function, as introduced in Section 3.4, and compare the luminosity function obtained using the time averaging method in Section 3.4 to a luminosity function constructed using the snapshot luminosities. In Figure 27, the predicted luminosity function with a value of (the standard model), is compared to the predicted luminosity function with a value of . The two are very similar, except at low luminosities at high redshift, where there is a slight difference. The similarity shows that the value of adopted does not strongly affect the luminosity function. In Figure 28, the predicted luminosity function with a value of is compared to the luminosity function where only the snapshot luminosities are used to construct the luminosity function. It can be seen how the time averaging method allows predictions for much lower number densities that for the snapshot case. These two cases are very similar in the luminosity range where they overlap, showing that the time averaging method does not change the predicted luminosity function significantly.
Appendix E Exploring the effect of varying parameters
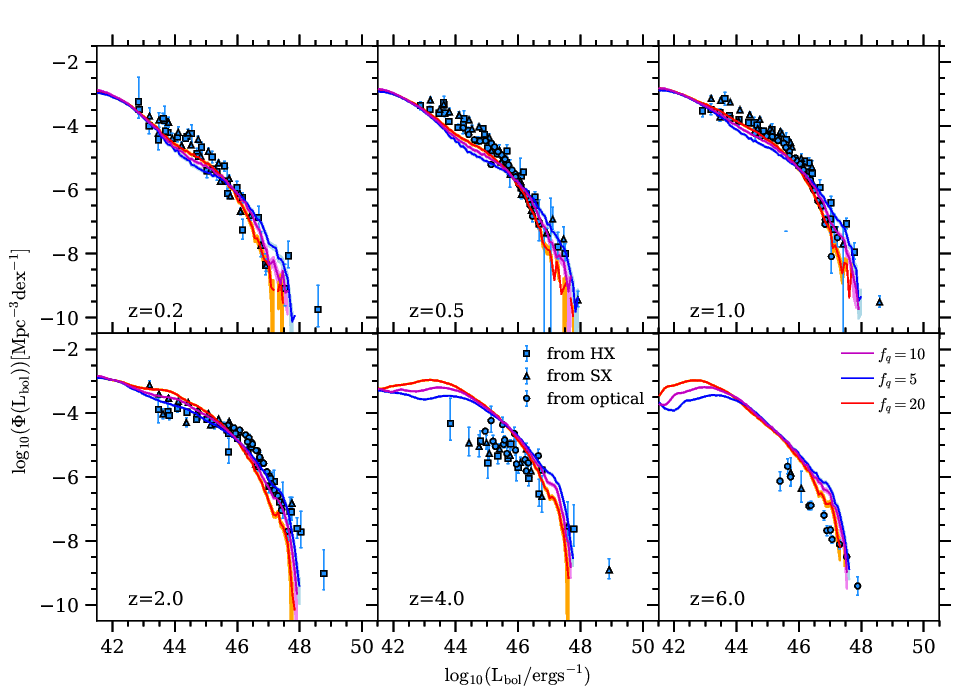
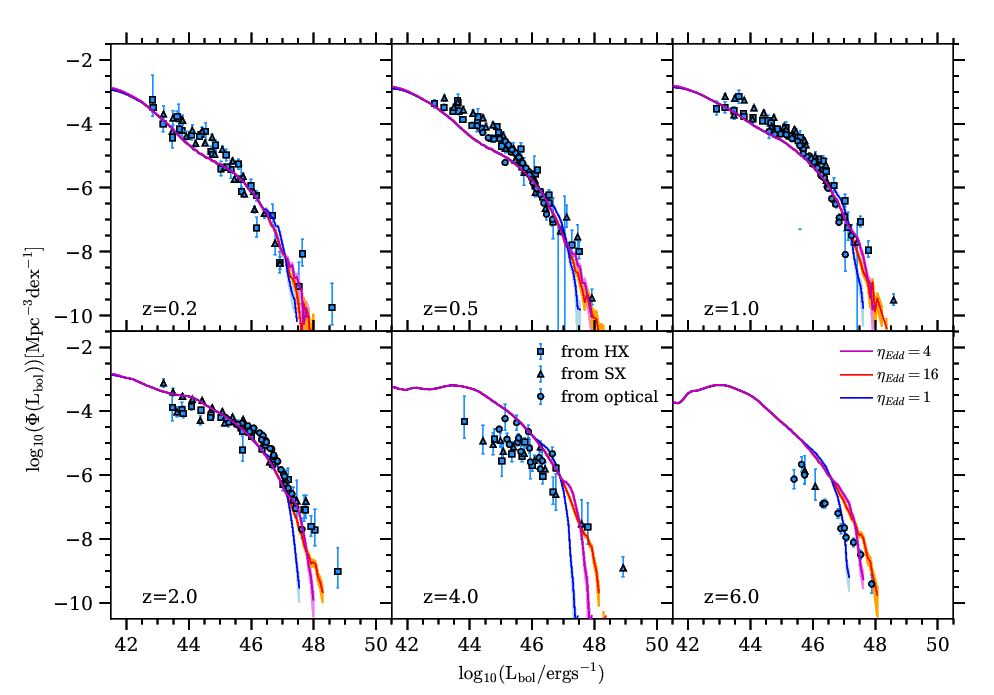
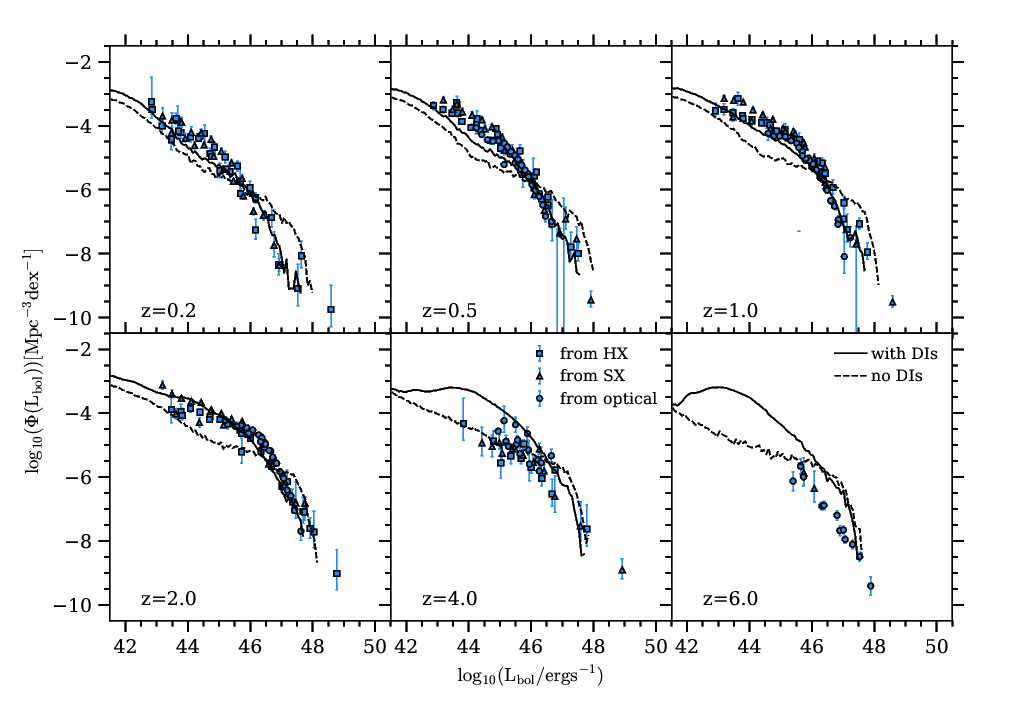
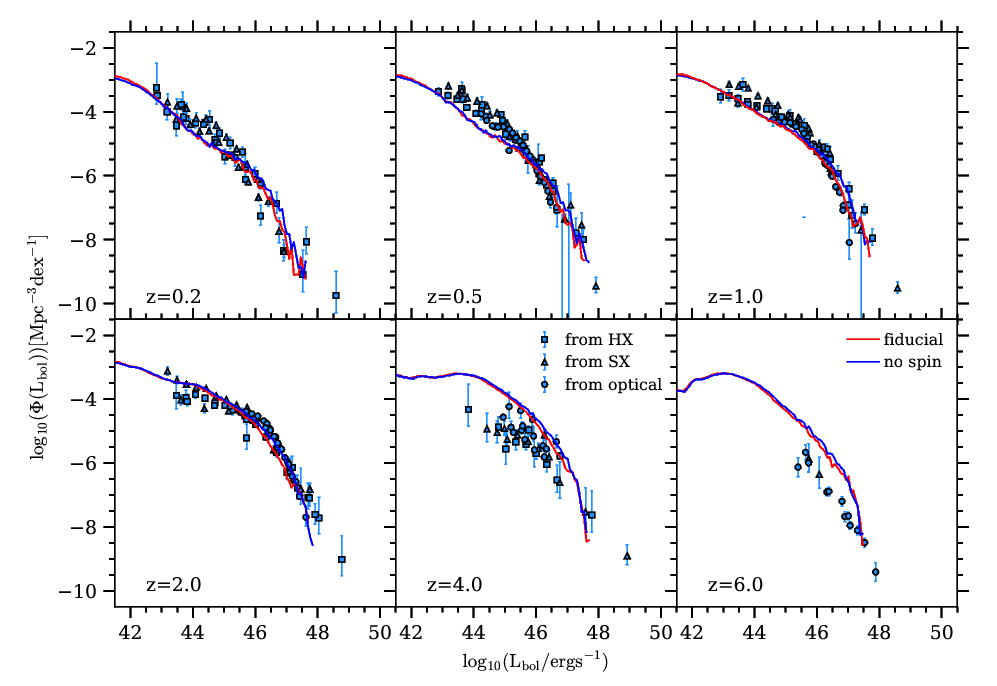
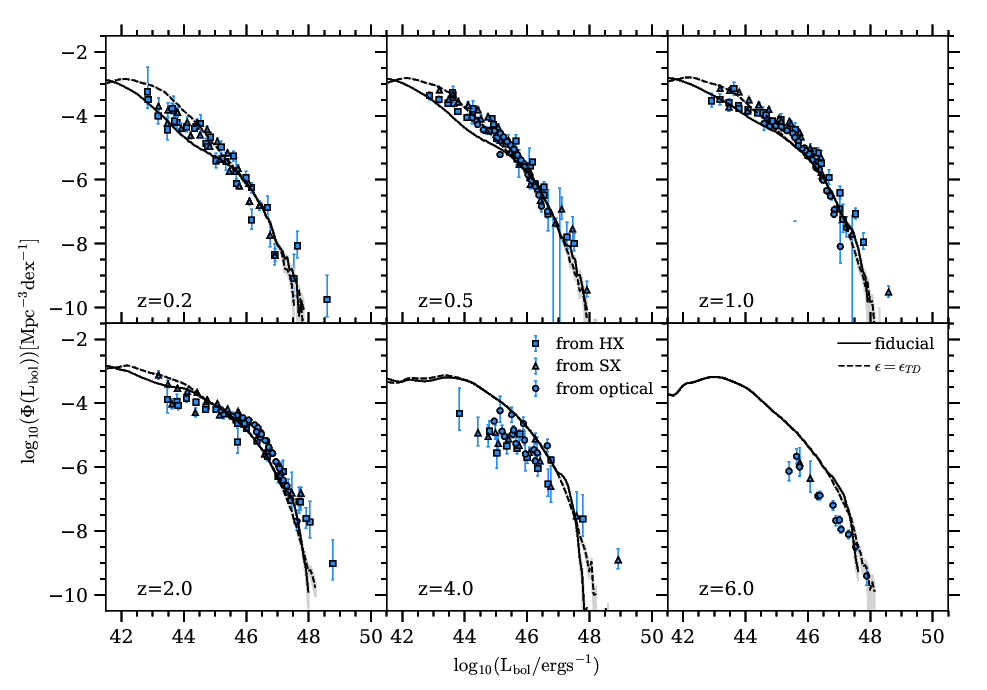
We show the effect on the bolometric luminosity function of varying some of the free parameters for SMBH and AGN used in the model; in Figure 29, we show the effect of varying the parameter (c.f. equation (26)). affects the value of and therefore the AGN luminosities. One expects a higher value of to lead to lower values of and therefore a steeper luminosity function at the bright end, as we see in Figure 29. At the faint end, a lower value of results in a poorer fit to the observations at low redshift () but is a better fit to the observations at high redshift (). At the bright end, a higher value of seems to give a better fit to the observations at low redshift but gives a worse fit to the observations at high redshift (e.g. around at ). With these considerations in mind, we decide to keep the Fanidakis et al. (2012) value of for our predictions in this paper.
We show the effect of varying the parameter (c.f. equation (31)) in Figure 30. controls the suppression of the luminosity for super-Eddington accretion rates, where a low value of corresponds to stronger luminosity suppression than a high value of . This parameter only affects the very bright end of the luminosity function, as we would expect. This parameter also has more of an effect at high redshift, where there are more super-Eddington sources. A value of gives a slightly better fit to the bright end observations at but gives a better fit to bright end observations at and . Therefore we once again to opt to keep the Fanidakis et al. (2012) value of for our predictions in this paper.
We show the effect of switching off disc instabilities in Figure 31. We show the fiducial model alongside a model in which all discs are stable and so no disc instability starbursts occur. Disc instabilities dominate the AGN luminosity function at , and so this is the regime where we expect turning off disc instabilities to have the most effect. For , at switching off disc instabilities results in fewer starbursts and so there are fewer objects at these luminosities. For , at the two models are similar - this is because if we switch off disc instabilities, galaxy mergers trigger the starbursts that would have otherwise happened due to disc instabilities. At , switching off disc instabilities makes the luminosity function less steep.
We show the effect of switching off the accretion and merger spinup in Figure 32. The radiative accretion efficiency given to the black holes is . The luminosity functions for the two models are generally similar, although the fiducial model has a slightly lower number density at high luminosities.
We show the effect of changing the assumptions for accretion efficiency, , in Figure 33. We compare the fiducial model to a model in which the accretion efficiency is the thin disc accretion efficiency for all values of the specific mass accretion rate, . Interestingly, this result provides a slightly better fit to the bolometric luminosity function, particularly for and , where the fiducial model underpredicts the number density. This is the regime where ADAFs dominate the luminosity function, and so this test suggests that a better fit to the observed AGN luminosity function might be obtained if the radiative accretion efficiency for ADAFs is higher than the values assumed in our standard model.