The Suppression of Star Formation on the Smallest Scales: What Role Does Environment Play?
Abstract
The predominantly ancient stellar populations observed in the lowest-mass galaxies (i.e. ultra-faint dwarfs) suggest that their star formation was suppressed by reionization. Most of the well-studied ultra-faint dwarfs, however, are within the central half of the Milky Way dark matter halo, such that they are consistent with a population that was accreted at early times and thus potentially quenched via environmental processes. To study the potential role of environment in suppressing star formation on the smallest scales, we utilize the Exploring the Local Volume in Simulations (ELVIS) suite of -body simulations to constrain the distribution of infall times for low-mass subhalos likely to host the ultra-faint population. For the ultra-faint satellites of the Milky Way with star-formation histories inferred from Hubble Space Telescope imaging, we find that environment is highly unlikely to play a dominant role in quenching their star formation. Even when including the potential effects of pre-processing, there is a probability that environmental processes quenched all of the known ultra-faint dwarfs early enough to explain their observed star-formation histories. Instead, we argue for a mass floor in the effectiveness of satellite quenching at roughly , below which star formation in surviving galaxies is globally suppressed by reionization. We predict a large population of quenched ultra-faint dwarfs in the Local Field (), with as many as to be discovered by future wide-field imaging surveys.
keywords:
galaxies: evolution – galaxies: dwarf – Local Group – galaxies: formation – galaxies: star formation – galaxies: general1 Introduction
The Local Group serves as a cosmic Rosetta Stone, offering the opportunity to study galaxy formation and evolution at a level of detail not possible at cosmological distances (Boylan-Kolchin et al., 2016). This is especially true at the smallest galactic scales — i.e. for very low-mass galaxies or what are often referred to as ultra-faint dwarfs (UFDs). Photometric observations of UFDs in the Local Group find universally old stellar populations, such that these systems have typically ceased forming stars by (or a lookback time of Gyr, Brown et al., 2014; Weisz et al., 2014b). The prevalence of ancient stellar components in these extremely low-mass systems is commonly interpreted as evidence of star formation suppression via reionization, where a photoionizing background increases the cooling time for low-density gas so as to quell the fuel supply for star formation in the lowest-mass halos (e.g. Efstathiou, 1992; Quinn et al., 1996; Thoul & Weinberg, 1996).
While the measured star formation histories of UFDs are broadly compatible with quenching via reionization, the most well-studied systems in the Local Group are located at relatively small galactocentric radii, which is also consistent with a population that was accreted at early cosmic time (Rocha et al., 2012; Oman et al., 2013). As such, the old stellar populations identified in UFDs orbiting the Milky Way and M31 may instead be the result of environmental processes that quenched star formation following infall onto the host halo. For example, recent measurements of the proper motion for the Segue I dwarf (Belokurov et al., 2007) suggest that it was accreted by the Milky Way halo roughly Gyr ago (Fritz et al., 2017), such that rapid environmental quenching would produce an ancient and metal-poor stellar population as observed today (Frebel et al., 2014; Webster et al., 2016). Undoubtedly, observations of isolated UFDs (i.e. beyond the reach of environmental effects) would be an excellent way to differentiate between these two physical scenarios (quenching via reionization versus via environment). Current datasets, however, lack the depth to identify and characterize the stellar populations of UFDs in the local field.
To address the potential role of environment in quenching UFDs, we utilize a suite of -body simulations to track the accretion and orbital history of the low-mass subhalos that host the UFD satellite population. Our approach is similar to that utilized by Rocha et al. (2012, see also ), with the clear distinction that we aim to study the UFD satellites as an ensemble and not on an object-by-object basis. For example, herein, we study the likelihood that the galaxies in the UFD sample from Brown et al. (2014) were accreted at early cosmic times, such that environmental quenching could reproduce their observed star formation histories. Overall, we strive to quantify the likelihood that environmental effects can explain the universal ancient stellar populations in the lowest-mass galaxies. In §2, we provide a brief census of the UFD satellite population of the Milky Way along with a description of our simulation dataset and our primary analysis methods. In §3, we present our results regarding the role of environment in quenching UFDs. Finally, we conclude with a brief discussion and summary of our work in §4 and §5, respectively.
2 Data
2.1 UFD Galaxy Sample
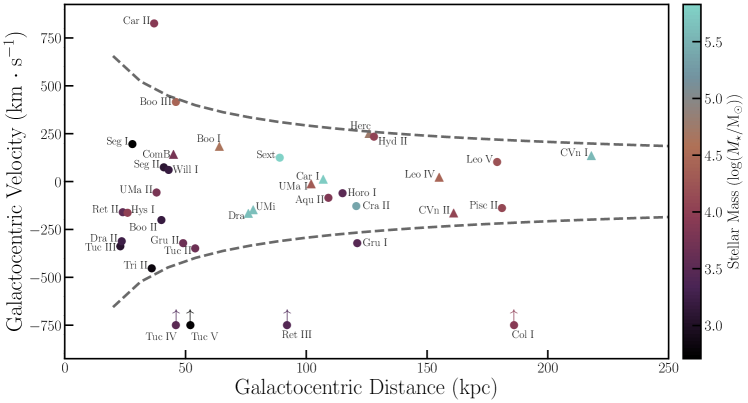
Since the discovery of the first ultra-faint dwarfs using photometric data from the Sloan Digital Sky Survey (SDSS, York et al., 2000), a large number of UFDs have been identified as satellites of the Milky Way (e.g. Willman et al., 2005a, b; Zucker et al., 2006b, a; Belokurov et al., 2010; Bechtol et al., 2015; Drlica-Wagner et al., 2015). Deep imaging of M31 has likewise uncovered a population of UFDs orbiting M31, with similarly old stellar populations (e.g. Martin et al., 2009; Weisz et al., 2014b; Skillman et al., 2017). Throughout this work, we focus our analysis on the ultra-faint satellite population of the Milky Way, selecting all systems with () as UFDs. Figure 1 shows the position and line-of-sight velocity of these systems relative to the Milky Way, with velocities scaled by a factor of to crudely account for potential tangential motion.111This typically serves as a lower limit to the total velocity, with the recently measured motions for a subset of UFDs from Gaia Data Release 2 (Simon, 2018; Fritz et al., 2018) yielding higher total velocities than our estimate.
Of the known UFD satellites of the Milky Way, there are published star-formation histories (SFHs) in the literature for based on Hubble Space Telescope (HST) imaging from Brown et al. (2014) and Weisz et al. (2014b). For all of these systems, the reported mean stellar age is with of the stars forming by . For the small number of objects included in both the Brown et al. (2014) and Weisz et al. (2014b) samples, there is relatively good agreement between the measured SFHs. The exception is CVn II, for which Weisz et al. (2014b) find a tail of star formation extending to . The HST/WFPC2 imaging analyzed by Weisz et al. (2014b), however, is shallower and covers a smaller area than the HST/ACS imaging utilized by Brown et al. (2014), such that greater photometric errors may be increasing the dispersion in the main sequence turn-off population and thereby yielding a broader SFH. Altogether, observations of the known UFD population orbiting the Milky Way suggest that these very low-mass systems have old stellar populations, with little star-formation activity since (e.g. Okamoto et al., 2008, 2012; de Jong et al., 2008; Sand et al., 2009, 2010, 2012; Brown et al., 2012; Martin et al., 2015; Bettinelli et al., 2018).
2.2 N-Body Cosmological Simulations
To investigate the role environmental mechanisms play in the quenching of UFDs, we utilize the Exploring the Local Volume In Simulations (ELVIS) suite of high-resolution, cosmological zoom-in simulations of Milky Way-like halos (Garrison-Kimmel et al., 2014). Within the suite, simulations are of isolated Milky Way-like halos and 12 are of Milky Way- and M31-like pairs. Each simulation occurs within a high-resolution uncontaminated volume spanning Mpc in size with a particle mass of and a Plummer-equivalent force softening length of physical parsecs. Within the high-resolution volumes, the halo catalogs are complete down to , , , and — thus sufficient to track the evolution of halos hosting Local Group dwarfs with stellar masses of . ELVIS adopts a CDM cosmological model based on Wilkinson Microwave Anisotropy Probe 7-year data (Komatsu et al., 2011; Larson et al., 2011) with the following parameters: , , , , and .
As a dark matter-only simulation suite, ELVIS fails to capture the impact of the host baryonic component on the subhalo population. In short, the inclusion of a disk potential can substantially alter the subhalo distribution inside of the host virial radius by tidally disrupting subhalos (D’Onghia et al., 2010; Brooks et al., 2013; Brooks & Zolotov, 2014; Garrison-Kimmel et al., 2017b; Sawala et al., 2017). This subhalo destruction preferentially occurs in objects with early infall times and/or more radial orbits. As such, the distribution of subhalo infall times for a dark matter-only simulation (such as ELVIS) will be biased towards earlier cosmic times, so as to overestimate the role of environmental mechanisms in quenching star formation at high .
To account for the impact of the host baryonic component, following the work of Fillingham et al. (2018), we implement a correction to the ELVIS subhalo population that will broadly capture the tidal effects of the host. Based on Figures 5 and A2 from Garrison-Kimmel et al. (2017b), we model the ratio of subhalos in dark matter-only versus hydrodynamic simulations of Milky Way-like hosts as
where is the number of subhalos that survive to present-day in a dark matter-only simulation, is the corresponding subhalo count for a hydrodynamic simulation, and is the host-centric distance at pericenter in kpc. This relationship between pericentric passage and the likelihood of subhalo disruption is supported by a larger number of dark matter-only simulations of Milky Way-like hosts, run with (and without) an evolving disk potential (Kelley et al., 2018).
To mimic the disruption of subhalos in ELVIS, we adopt as the likelihood that a subhalo survives to as a function of pericentric distance; for , we assume no subhalo destruction (i.e. ). Within the ELVIS halo catalogs, we then randomly destroy subhalos as a function of their pericentric distance given this probability of survival. In total, this removes approximately of the subhalo population at the selected mass scale (). Throughout the remainder of this work, we refer to these modified halo populations as comprising the “Fat” ELVIS halo catalogs, given their inclusion of the destructive effects produced by the host’s additional baryonic mass component. As hosts of the Milky Way’s UFD population, we select subhalos from our Fat ELVIS catalogs at within the host virial radius and within a mass range of , following the stellar mass-halo mass (SMHM) relation of Garrison-Kimmel et al. (2014). This yields a population of subhalos across the ELVIS host systems.
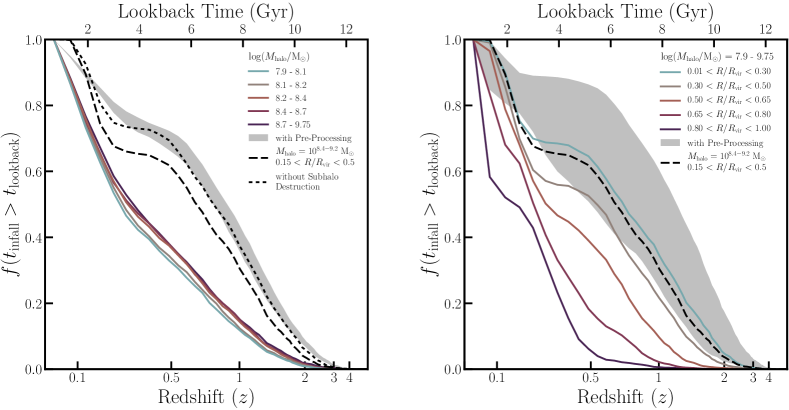
The ELVIS merger trees include snapshots ranging from to . Following Fillingham et al. (2015), all halo properties are spline interpolated across the snapshots at a time resolution of Myr, which enables more precise measurement of subhalo infall times and pericentric distances. To constrain the infall time () for each subhalo in our Fat ELVIS catalogs, we measure the redshift at which a subhalo was first and last accreted onto its host halo. In of cases, the first infall is the only infall, such that . To account for the potential role of pre-processing, we also track the first infall onto any host halo with at . Following the SMHM relation of Garrison-Kimmel et al. (2014), this host selection corresponds to systems that are similar to the Small Magellanic Cloud (SMC) or more massive. In total, roughly of subhalos in our chosen mass range () experience pre-processing, such that they are influenced by environment roughly Gyr earlier on average (see also Wetzel et al., 2015a). Throughout this work, we take the last infall onto the current host (i.e. onto a Milky Way-like host) as the infall time for a subhalo, unless otherwise stated. In general, our primary results are qualitatively independent of the adopted definition of infall time.
As shown in Figure 2, the distribution of subhalo infall times is very weakly dependent upon subhalo mass at , such that our results are largely independent of the assumed stellar mass-halo mass relation. Likewise, we find very little difference in the distribution of infall times for subhalos associated with the Local Group-like, paired hosts versus the isolated hosts in the ELVIS suite, with subhalos typically accreted Gyr earlier in the Local Group-like simulations. In contrast, the typical infall time of a subhalo depends much more significantly on host-centric distance, with those systems located near the host biased towards early accretion. For our sample of low-mass halos, the inclusion of tidal effects shifts the distribution of subhalo infall times by Gyr earlier on average (see black dash-dotted line in Figure 2). Our fiducial subhalo population, selected to have and , includes a total of subhalos and is well-matched to the UFD sample of Brown et al. (2014) based on host-centric distance and stellar mass, as shown relative to the greater MW UFD population in Figure 1.
2.3 Methods
We employ a simple statistical method to quantify the probability that environmental mechanisms may be responsible for quenching star formation in a given population of subhalos (i.e. UFDs). From the parent subhalo population, chosen to match a particular observed galaxy sample, we select (with replacement) a sample of random subhalos. If all subhalos are accreted onto their host halo (for the last time) at or before a given redshift, then for that redshift the entire set of subhalos is considered quenched. This process is replicated across 10,000 trials at each , spanning from to at intervals of . The “environmental quenching probability” as a function of cosmic time (or ) is then calculated as the ratio of trails where all systems quench relative to the total number of trials (i.e. 10,000). Throughout the remainder of this work, we explore the dependence of this environmental quenching probability on the sample size (), the adopted infall time (e.g. allowing for pre-processing by lower-mass hosts), and the fraction of the sample required to be quenched at a given redshift.
3 Results
To determine if environmental effects were responsible for quenching the present-day lowest-mass satellites of the Milky Way, we utilize our fiducial Fat ELVIS subhalo population to constrain the likelihood that all galaxies in the Brown et al. (2014) UFD sample were accreted at early cosmic times — such that environmental quenching could reproduce the observed SFHs of these systems. From our fiducial subhalo sample, we randomly draw (with replacement) subhalos and evaluate – as a function of redshift – whether the entire sample of was accreted by a given . Repeating this exercise across 10,000 trials, we compute the likelihood that a sample of randomly-chosen UFDs could be environmentally quenched as a function of cosmic time.
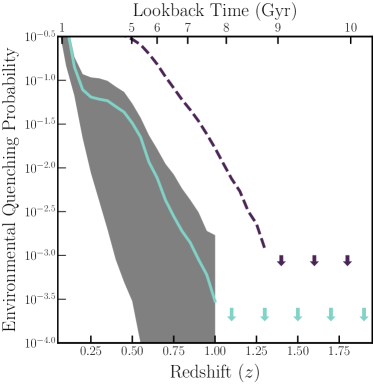
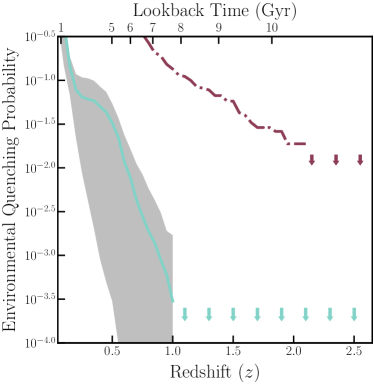
As shown in Figure 3, there is a vanishingly small probability that random subhalos would all be accreted at high redshift (i.e. ) or that the corresponding galaxies would be quenched by environmental process at such early cosmic time. At , after observations suggest that star formation halted in the UFD sample from Brown et al. (2014) including uncertainties of Gyr in the inferred SFHs, there is still an extremely low probability () that all systems could be quenched via environmental effects. Allowing for a satellite to quench following infall (Fillingham et al., 2015), such that all UFDs must be accreted by to quench by , only further decreases the potential impact of environmental quenching (see Fig. 3). While allowing for pre-processing in hosts down to SMC-like scales increases the possible effectiveness of environmental effects (see dashed plum line in Fig. 3), the likelihood that environment quenched the UFDs in the Brown et al. (2014) sample is remarkably low ( for ). Overall, environmental mechanisms are unlikely to be responsible for the universally old stellar populations inferred for the Brown et al. (2014) UFD sample.
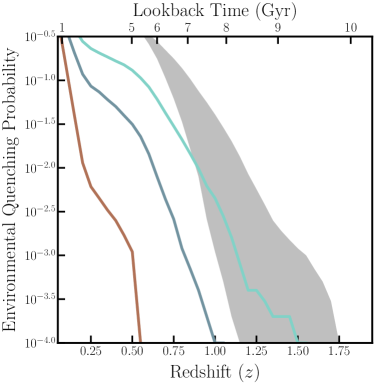
Including both Brown et al. (2014) and Weisz et al. (2014b), there are published SFHs for UFDs, all indicating that star formation halted by . Moreover, spectroscopic and/or photometric observations of (at least) a further systems point to old (or metal-poor) stellar populations (e.g. Drlica-Wagner et al., 2015; Laevens et al., 2015a; Simon et al., 2015, 2017; Li et al., 2018; Torrealba et al., 2018). While these additional UFDs span a broader range of galactocentric distance, with some potentially pre-processed by the Magellanic Clouds (Koposov et al., 2015; Bechtol et al., 2015; Drlica-Wagner et al., 2015; Yozin & Bekki, 2015; Jethwa et al., 2016; Sales et al., 2017), the total sample of UFDs creates a powerful dataset with which to examine the role of environment. As expected, if we expand the sample of UFDs to all of those with well-measured star-formation histories () or yet larger to , it is even more difficult to explain the universally-ancient stellar populations observed in terms of an environmental effect. Figure 4 shows the probability that a sample of (sage line) or (sienna line) UFD satellites were quenched following infall onto the Milky Way halo as a function of cosmic time. We find that there is a probability that samples of this size were entirely accreted by . Even if we allow for late-time star formation in of the UFD population (see grey shaded region in Fig. 4), we find that environmental processes are unlikely to have been the dominant quenching mechanism for the current sample of known UFDs orbiting the Milky Way.
4 Discussion
4.1 Quenching on the Smallest Scales
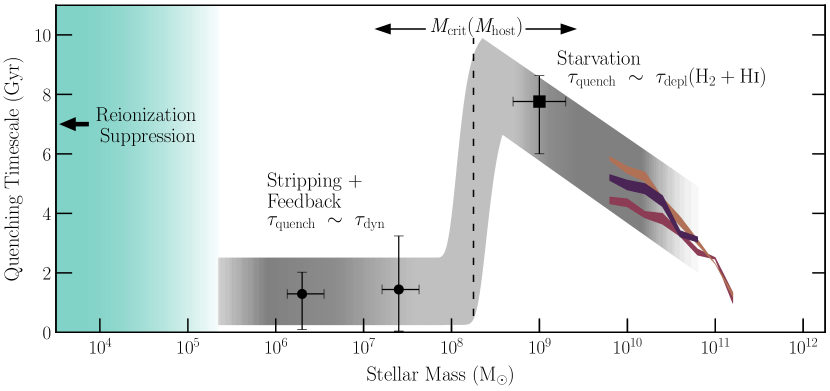
Our analysis shows that the old stellar populations (and lack of significant star formation at ) observed in the Milky Way’s UFD satellites is unlikely to be reproduced via environmental quenching. Instead, the observed star-formation histories of local UFDs are much more likely to have been truncated via reionization. Building upon the analysis of Fillingham et al. (2015, 2016), Figure 5 presents a complete picture of the dominant physical processes driving late-time satellite quenching across more than orders of magnitude in satellite stellar mass. In particular, we plot the current constraints on the satellite quenching timescale (measured relative to infall) as a function of satellite stellar mass; we caution that these measurements span a broad range of host halo masses (from ), but do describe a coherent physical scenario (Wetzel et al. 2013; Wheeler et al. 2014; Fillingham et al. 2015, 2016, 2018, see also De Lucia et al. 2012; Hirschmann et al. 2014; Davies et al. 2016).
As illustrated in Fig. 5, above a host-dependent critical mass scale, satellites are able to largely resist stripping forces, such that they are quenched on longer timescales consistent with starvation (Larson et al., 1980; Fillingham et al., 2015). Below this critical mass scale, which is roughly for Local Group-like hosts (Wheeler et al., 2014; Phillips et al., 2015), stripping is able to remove the fuel supply for star formation from infalling satellites, such that quenching occurs on roughly a dynamical time (Fillingham et al., 2015, 2016; Wetzel et al., 2015b). This critical mass scale increases with host halo mass, such that stripping is efficient at greater satellite masses in more massive host halos (e.g. Kenney & Young, 1989; Solanes et al., 2001; Boselli et al., 2014); meanwhile, there likely exists some limiting host mass (e.g. ) for which stripping is inefficient on all mass scales and local environment is unable to quench satellites (). Finally, at the very lowest masses (), reionization acts to suppress star formation, independent of environment (i.e. for both isolated and satellite systems). We illustrate this regime in Fig. 5 as the aqua shaded region.
Our results are consistent with recent hydrodynamical simulations of galaxy formation, which find that suppression of star formation by reionization is commonplace below a mass scale of (Benítez-Llambay et al., 2015; Fitts et al., 2017; Jeon et al., 2017; Dawoodbhoy et al., 2018; Aubert et al., 2018). While reionization halts the infall of new gas in low-mass halos, residual star formation can be fueled by the galaxy’s existing gas reservoir so as to produce star-formation histories similar to those observed for UFDs (Oñorbe et al., 2015; Wheeler et al., 2015). Additionally, reignition of star formation after initial suppression via reionization may produce short and late periods of star formation (Ledinauskas & Zubovas, 2018; Wright et al., 2018), such as that observed in Carina by Weisz et al. (2014b). Observations in the Local Volume also broadly suggest that the mass scale at which quenching via reionization dominates is approximately (e.g. Tollerud & Peek, 2018). In particular, Leo T has a stellar mass of , with a significant neutral gas reservoir (Ryan-Weber et al., 2008; Adams & Oosterloo, 2018) and a complex star-formation history, including significant activity at (de Jong et al., 2008; Clementini et al., 2012; Weisz et al., 2012). At a distance of from the Milky Way (Irwin et al., 2007), Leo T likely represents the tail of the star-forming field population, having a dark matter halo mass greater than that at which reionization suppresses gas cooling. Studies of stellar and gas kinematics in Leo T suggest a halo mass of (Simon & Geha, 2007; Ryan-Weber et al., 2008). And XVI (Ibata et al., 2007), a satellite of M31 with a stellar mass of and a star formation history that extends to (Weisz et al., 2014a; Monelli et al., 2016), was potentially a similar system prior to being accreted by M31 and quenched via environmental mechanisms. While Leo T and And XVI support a mass scale for quenching via reionization of (), recent observations of additional low-mass satellites of M31 indicate that the relevant mass scale may be yet lower (, Martin et al., 2016b, 2017). It is important to note that there is likely not a clearly defined stellar mass scale at which reionization is effective, given the potentially large scatter in the stellar mass-halo mass relation at low masses (Garrison-Kimmel et al., 2017a).
Taking () as the scale at which reionization suppresses star formation across all environments, we predict a population of UFDs within of the Milky Way and M31, based on counts of halos with in the Fat ELVIS catalogs across all 36 simulations.222On average, the paired host simulations have slightly more halos in the range and a smaller fraction of these being backsplash halos. All of these systems are expected to be dominated by ancient stellar populations. While some will have interacted with the Milky Way and/or M31, a relatively large fraction () of halos at these distances are true “field” systems, having never spent time as a subhalo. Future imaging surveys, such as the Large Synoptic Survey Telescope (Ivezic et al., 2008), are expected to discover much of this population in the coming decade, opening new avenues to study the suppression of star formation on the smallest scales. The total number of field UFDs will not only depend on the mass scale at which reionization suppresses ongoing star formation at high , but also the yet lower scale at which it is able to suppress all star formation (e.g. Bullock et al., 2000; Somerville, 2002).
4.2 The Curious Case of Eri II
If reionization truly quenches all low-mass galaxies, independent of environment, we would expect that isolated UFDs should host ancient stellar populations similar to those observed for known UFD satellites. The recent discovery of Eridanus II at a distance of from the Milky Way (Bechtol et al., 2015; Li et al., 2017) has offered the opportunity to probe the SFH of a “field” UFD in significant detail. At a galactocentric distance of , however, Eri II cannot be considered an isolated system, unaffected by potential environmental effects. A significant fraction of systems at such distances are associated with “backsplash” halos (Teyssier et al., 2012; Garrison-Kimmel et al., 2014; Fillingham et al., 2018), which previously passed within the host’s (i.e. Milky Way’s) virial radius before returning to the field.
While recent observations show no signs of late-time star formation (Li et al. 2017, but see also Koposov et al. 2015; Crnojević et al. 2016), Eri II – as a solitary system with an unknown orbital history – places limited constraints on the dominant mechanism responsible for suppressing star formation on the smallest scales. As shown in Figure 6, the current sample of Milky Way UFD satellites already places a stronger constraint on the role of environment. To test whether Eri II is likely to have been quenched by environment, we select subhalos from our Fat ELVIS catalogs, matching the mass (), host-centric line-of-sight velocity (), and host-centric distance () of Eri II (Li et al., 2017).333The adopted phase-space range was selected to encompass velocity and distance errors, as well as a possibly higher than originally assumed total velocity, following suit based on recently-derived velocities for UFDs from Gaia Data Release 2 (Simon, 2018; Fritz et al., 2018). From the resulting sample of subhalos, we compute the infall distribution as a function of cosmic time (see Fig. 6), which corresponds to the likelihood that environment played a role in quenching star formation in Eri II. We find that there is a chance that Eri II was quenched via an interaction with the Milky Way at . While Eri II is unlikely to have been quenched due to an interaction with the Milky Way at (so as to produce a purely old stellar population), the measured SFHs for the existing sample of UFD satellites orbiting the Milky Way already argue more strongly against environment’s role in suppressing star formation on the smallest scales.
5 Summary
Using the ELVIS suite of Milky Way- and Local Group-like -body simulations to constrain the infall times for subhalos likely to host the ultra-faint satellite population of the Milky Way, we explore the potential role of environment in suppressing star formation on small scales. Our principal results are as follows.
-
•
When incorporating the effects of subhalo tidal disruption due to the inclusion of the host’s baryonic component, we find a shift in the typical infall time of Gyr for subhalos in the mass range of , such that subhalos are preferentially accreted at later cosmic time versus the same subhalos in a pure dark matter-only, -body simulation.
-
•
For the UFDs included in the Brown et al. (2014) sample, we find that there is a probability that the Milky Way environment was solely responsible for quenching their star formation at .
- •
-
•
Given the inability of environmental effects to reproduce the observed star-formation histories of observed UFDs, we conclude that reionization is the most likely mechanism by which star formation is suppressed on the smallest scales.
-
•
Finally, we predict that there is a population of UFDs within of the Milky Way and M31, all with ancient stellar populations. Future imaging surveys, such as LSST, will be able to uncover much of this population.
Combined with results from Fillingham et al. (2015) and Fillingham et al. (2016), our results produce a coherent physical picture describing the dominant quenching mechanism across the entire range of satellite (and host) masses (see Fig. 5). At the very smallest scales, we argue that the suppression of star formation is largely independent of environment and set by the minimum halo mass at which reionization curtails gas accretion.
acknowledgements
We thank Tyler Kelley, Dan Weisz, Josh Simon, Alex Riley, and Mary Jenkins for helpful discussions regarding this project. This work was supported in part by NSF grants AST-1518257, AST-1518291, AST-1517226, and AST-1815475. MBK also acknowledges support from NSF CAREER grant AST-1752913 and NASA grant NNX17AG29G. Additional support for this work was provided by NASA through grants GO-12914, AR-13888, AR-13896, GO-14191, AR-14282, AR-14289, AR-14554, and AR-15006 from the Space Telescope Science Institute, which is operated by the Association of Universities for Research in Astronomy, Inc., under NASA contract NAS 5-26555. MKRW acknowledges support from the National Science Foundation Graduate Research Fellowship. This material is based upon work supported by the National Science Foundation Graduate Research Fellowship Program under Grant No. DGE-1321846.
This research made use of Astropy, a community-developed core Python package for Astronomy (Astropy Collaboration et al., 2013). Additionally, the Python packages NumPy (Walt et al., 2011), iPython (Pérez & Granger, 2007), SciPy (Jones et al., 2001), and matplotlib (Hunter, 2007) were utilized for the majority of our data analysis and presentation.
References
- Adams & Oosterloo (2018) Adams E. A. K., Oosterloo T. A., 2018, A&A, 612, A26
- Astropy Collaboration et al. (2013) Astropy Collaboration et al., 2013, A&A, 558, A33
- Aubert et al. (2018) Aubert D., et al., 2018, ApJ, 856, L22
- Bechtol et al. (2015) Bechtol K., et al., 2015, ApJ, 807, 50
- Belokurov et al. (2007) Belokurov V., et al., 2007, ApJ, 654, 897
- Belokurov et al. (2010) Belokurov V., et al., 2010, ApJ, 712, L103
- Benítez-Llambay et al. (2015) Benítez-Llambay A., Navarro J. F., Abadi M. G., Gottlöber S., Yepes G., Hoffman Y., Steinmetz M., 2015, MNRAS, 450, 4207
- Bettinelli et al. (2018) Bettinelli M., Hidalgo S. L., Cassisi S., Aparicio A., Piotto G., 2018, MNRAS,
- Boselli et al. (2014) Boselli A., Cortese L., Boquien M., Boissier S., Catinella B., Gavazzi G., Lagos C., Saintonge A., 2014, A&A, 564, A67
- Boylan-Kolchin et al. (2016) Boylan-Kolchin M., Weisz D. R., Bullock J. S., Cooper M. C., 2016, MNRAS, 462, L51
- Brooks & Zolotov (2014) Brooks A. M., Zolotov A., 2014, ApJ, 786, 87
- Brooks et al. (2013) Brooks A. M., Kuhlen M., Zolotov A., Hooper D., 2013, ApJ, 765, 22
- Brown et al. (2012) Brown T. M., et al., 2012, ApJ, 753, L21
- Brown et al. (2014) Brown T. M., et al., 2014, ApJ, 796, 91
- Bullock et al. (2000) Bullock J. S., Kravtsov A. V., Weinberg D. H., 2000, ApJ, 539, 517
- Caldwell et al. (2017) Caldwell N., et al., 2017, ApJ, 839
- Clementini et al. (2012) Clementini G., Cignoni M., Contreras Ramos R., Federici L., Ripepi V., Marconi M., Tosi M., Musella I., 2012, ApJ, 756, 108
- Crnojević et al. (2016) Crnojević D., Sand D. J., Zaritsky D., Spekkens K., Willman B., Hargis J. R., 2016, ApJ, 824, L14
- D’Onghia et al. (2010) D’Onghia E., Springel V., Hernquist L., Keres D., 2010, ApJ, 709, 1138
- Davies et al. (2016) Davies L. J. M., et al., 2016, MNRAS, 455, 4013
- Dawoodbhoy et al. (2018) Dawoodbhoy T., et al., 2018, MNRAS, 480, 1740
- De Lucia et al. (2012) De Lucia G., Weinmann S., Poggianti B. M., Aragón-Salamanca A., Zaritsky D., 2012, MNRAS, 423, 1277
- Drlica-Wagner et al. (2015) Drlica-Wagner A., et al., 2015, ApJ, 813, 109
- Efstathiou (1992) Efstathiou G., 1992, MNRAS, 256, 43P
- Fillingham et al. (2015) Fillingham S. P., Cooper M. C., Wheeler C., Garrison-Kimmel S., Boylan-Kolchin M., Bullock J. S., 2015, MNRAS, 454, 2039
- Fillingham et al. (2016) Fillingham S. P., Cooper M. C., Pace A. B., Boylan-Kolchin M., Bullock J. S., Garrison-Kimmel S., Wheeler C., 2016, MNRAS, 463, 1916
- Fillingham et al. (2018) Fillingham S. P., Cooper M. C., Boylan-Kolchin M., Bullock J. S., Garrison-Kimmel S., Wheeler C., 2018, MNRAS, 477, 4491
- Fitts et al. (2017) Fitts A., et al., 2017, MNRAS, 471, 3547
- Frebel et al. (2014) Frebel A., Simon J. D., Kirby E. N., 2014, ApJ, 786, 74
- Fritz et al. (2017) Fritz T. K., Lokken M., Kallivayalil N., Wetzel A., Linden S. T., Zivick P., Tollerud E. J., 2017, preprint, (arXiv:1711.09097)
- Fritz et al. (2018) Fritz T. K., Battaglia G., Pawlowski M. S., Kallivayalil N., van der Marel R., Sohn T. S., Brook C., Besla G., 2018, preprint, p. arXiv:1805.00908 (arXiv:1805.00908)
- Garrison-Kimmel et al. (2014) Garrison-Kimmel S., Boylan-Kolchin M., Bullock J. S., Lee K., 2014, MNRAS, 438, 2578
- Garrison-Kimmel et al. (2017a) Garrison-Kimmel S., Bullock J. S., Boylan-Kolchin M., Bardwell E., 2017a, MNRAS, 464, 3108
- Garrison-Kimmel et al. (2017b) Garrison-Kimmel S., et al., 2017b, MNRAS, 471, 1709
- Hirschmann et al. (2014) Hirschmann M., De Lucia G., Wilman D., Weinmann S., Iovino A., Cucciati O., Zibetti S., Villalobos Á., 2014, MNRAS, 444, 2938
- Hunter (2007) Hunter J. D., 2007, Computing In Science & Engineering, 9, 90
- Ibata et al. (2007) Ibata R., Martin N. F., Irwin M., Chapman S., Ferguson A. M. N., Lewis G. F., McConnachie A. W., 2007, ApJ, 671, 1591
- Irwin et al. (2007) Irwin M. J., et al., 2007, ApJ, 656, L13
- Ivezic et al. (2008) Ivezic Z., et al., 2008, preprint, (arXiv:0805.2366)
- Jeon et al. (2017) Jeon M., Besla G., Bromm V., 2017, preprint, (arXiv:1702.07355)
- Jethwa et al. (2016) Jethwa P., Erkal D., Belokurov V., 2016, MNRAS, 461, 2212
- Jones et al. (2001) Jones E., Oliphant T., Peterson P., et al., 2001, SciPy: Open source scientific tools for Python, http://www.scipy.org/
- Kelley et al. (2018) Kelley T., Bullock J. S., Garrison-Kimmel S., Boylan-Kolchin M., Pawlowski M. S., Graus A. S., 2018, preprint, p. arXiv:1811.12413 (arXiv:1811.12413)
- Kenney & Young (1989) Kenney J. D. P., Young J. S., 1989, ApJ, 344, 171
- Kirby et al. (2013) Kirby E. N., Boylan-Kolchin M., Cohen J. G., Geha M., Bullock J. S., Kaplinghat M., 2013, ApJ, 770, 16
- Kirby et al. (2015a) Kirby E. N., Simon J. D., Cohen J. G., 2015a, ApJ, 810, 56
- Kirby et al. (2015b) Kirby E. N., Cohen J. G., Simon J. D., Guhathakurta P., 2015b, ApJ, 814, L7
- Kirby et al. (2017) Kirby E. N., Cohen J. G., Simon J. D., Guhathakurta P., Thygesen A. O., Duggan G. E., 2017, ApJ, 838, 83
- Komatsu et al. (2011) Komatsu E., et al., 2011, ApJS, 192, 18
- Koposov et al. (2015) Koposov S. E., Belokurov V., Torrealba G., Evans N. W., 2015, ApJ, 805, 130
- Koposov et al. (2018) Koposov S. E., et al., 2018, preprint, (arXiv:1804.06430)
- Laevens et al. (2015a) Laevens B. P. M., et al., 2015a, ApJ, 802, L18
- Laevens et al. (2015b) Laevens B. P. M., et al., 2015b, ApJ, 813
- Larson et al. (1980) Larson R. B., Tinsley B. M., Caldwell C. N., 1980, ApJ, 237, 692
- Larson et al. (2011) Larson D., et al., 2011, ApJS, 192, 16
- Ledinauskas & Zubovas (2018) Ledinauskas E., Zubovas K., 2018, preprint, (arXiv:1803.09477)
- Li et al. (2017) Li T. S., et al., 2017, ApJ, 838, 8
- Li et al. (2018) Li T. S., et al., 2018, ApJ, 857, 145
- Martin et al. (2009) Martin N. F., et al., 2009, ApJ, 705, 758
- Martin et al. (2015) Martin N. F., et al., 2015, ApJ, 804, L5
- Martin et al. (2016a) Martin N. F., et al., 2016a, MNRAS, 458, L59
- Martin et al. (2016b) Martin N. F., et al., 2016b, ApJ, 833, 167
- Martin et al. (2017) Martin N. F., et al., 2017, ApJ, 850, 16
- McConnachie (2012) McConnachie A. W., 2012, AJ, 144, 4
- Monelli et al. (2016) Monelli M., et al., 2016, ApJ, 819, 147
- Oñorbe et al. (2015) Oñorbe J., Boylan-Kolchin M., Bullock J. S., Hopkins P. F., Kereš D., Faucher-Giguère C.-A., Quataert E., Murray N., 2015, MNRAS, 454, 2092
- Okamoto et al. (2008) Okamoto S., Arimoto N., Yamada Y., Onodera M., 2008, A&A, 487, 103
- Okamoto et al. (2012) Okamoto S., Arimoto N., Yamada Y., Onodera M., 2012, ApJ, 744, 96
- Oman et al. (2013) Oman K. A., Hudson M. J., Behroozi P. S., 2013, MNRAS, 431, 2307
- Pérez & Granger (2007) Pérez F., Granger B. E., 2007, Computing in Science and Engineering, 9, 21
- Phillips et al. (2015) Phillips J. I., Wheeler C., Cooper M. C., Boylan-Kolchin M., Bullock J. S., Tollerud E., 2015, MNRAS, 447, 698
- Quinn et al. (1996) Quinn T., Katz N., Efstathiou G., 1996, MNRAS, 278, L49
- Rocha et al. (2012) Rocha M., Peter A. H. G., Bullock J., 2012, MNRAS, 425, 231
- Ryan-Weber et al. (2008) Ryan-Weber E. V., Begum A., Oosterloo T., Pal S., Irwin M. J., Belokurov V., Evans N. W., Zucker D. B., 2008, MNRAS, 384, 535
- Sales et al. (2017) Sales L. V., Navarro J. F., Kallivayalil N., Frenk C. S., 2017, MNRAS, 465, 1879
- Sand et al. (2009) Sand D. J., Olszewski E. W., Willman B., Zaritsky D., Seth A., Harris J., Piatek S., Saha A., 2009, ApJ, 704, 898
- Sand et al. (2010) Sand D. J., Seth A., Olszewski E. W., Willman B., Zaritsky D., Kallivayalil N., 2010, ApJ, 718, 530
- Sand et al. (2012) Sand D. J., Strader J., Willman B., Zaritsky D., McLeod B., Caldwell N., Seth A., Olszewski E., 2012, ApJ, 756, 79
- Sawala et al. (2017) Sawala T., Pihajoki P., Johansson P. H., Frenk C. S., Navarro J. F., Oman K. A., White S. D. M., 2017, MNRAS, 467, 4383
- Simon (2018) Simon J. D., 2018, preprint, (arXiv:1804.10230)
- Simon & Geha (2007) Simon J. D., Geha M., 2007, ApJ, 670, 313
- Simon et al. (2015) Simon J. D., et al., 2015, ApJ, 808, 95
- Simon et al. (2017) Simon J. D., et al., 2017, ApJ, 838, 11
- Skillman et al. (2017) Skillman E. D., et al., 2017, ApJ, 837, 102
- Solanes et al. (2001) Solanes J. M., Manrique A., García-Gómez C., González-Casado G., Giovanelli R., Haynes M. P., 2001, ApJ, 548, 97
- Somerville (2002) Somerville R. S., 2002, ApJ, 572, L23
- Teyssier et al. (2012) Teyssier M., Johnston K. V., Kuhlen M., 2012, MNRAS, 426, 1808
- Thoul & Weinberg (1996) Thoul A. A., Weinberg D. H., 1996, ApJ, 465, 608
- Tollerud & Peek (2018) Tollerud E. J., Peek J. E. G., 2018, ApJ, 857, 45
- Torrealba et al. (2016) Torrealba G., et al., 2016, MNRAS, 463, 712
- Torrealba et al. (2018) Torrealba G., et al., 2018, MNRAS, 475, 5085
- Walker et al. (2016) Walker M. G., et al., 2016, ApJ, 819
- Walt et al. (2011) Walt S. v. d., Colbert S. C., Varoquaux G., 2011, Computing in Science & Engineering, 13, 22
- Webster et al. (2016) Webster D., Frebel A., Bland-Hawthorn J., 2016, ApJ, 818, 80
- Weisz et al. (2012) Weisz D. R., et al., 2012, ApJ, 748, 88
- Weisz et al. (2014a) Weisz D. R., et al., 2014a, ApJ, 789, 24
- Weisz et al. (2014b) Weisz D. R., Dolphin A. E., Skillman E. D., Holtzman J., Gilbert K. M., Dalcanton J. J., Williams B. F., 2014b, ApJ, 789, 147
- Weisz et al. (2015) Weisz D. R., Dolphin A. E., Skillman E. D., Holtzman J., Gilbert K. M., Dalcanton J. J., Williams B. F., 2015, ApJ, 804, 136
- Wetzel et al. (2013) Wetzel A. R., Tinker J. L., Conroy C., van den Bosch F. C., 2013, MNRAS, 432, 336
- Wetzel et al. (2015a) Wetzel A. R., Deason A. J., Garrison-Kimmel S., 2015a, ApJ, 807, 49
- Wetzel et al. (2015b) Wetzel A. R., Tollerud E. J., Weisz D. R., 2015b, ApJ, 808, L27
- Wheeler et al. (2014) Wheeler C., Phillips J. I., Cooper M. C., Boylan-Kolchin M., Bullock J. S., 2014, MNRAS, 442, 1396
- Wheeler et al. (2015) Wheeler C., Oñorbe J., Bullock J. S., Boylan-Kolchin M., Elbert O. D., Garrison-Kimmel S., Hopkins P. F., Kereš D., 2015, MNRAS, 453, 1305
- Willman et al. (2005a) Willman B., et al., 2005a, AJ, 129, 2692
- Willman et al. (2005b) Willman B., et al., 2005b, ApJ, 626, L85
- Wright et al. (2018) Wright A. C., Brooks A. M., Weisz D. R., Christensen C. R., 2018, preprint, (arXiv:1802.03019)
- York et al. (2000) York D. G., et al., 2000, AJ, 120, 1579
- Yozin & Bekki (2015) Yozin C., Bekki K., 2015, MNRAS, 453, 2302
- Zucker et al. (2006a) Zucker D. B., et al., 2006a, ApJ, 643, L103
- Zucker et al. (2006b) Zucker D. B., et al., 2006b, ApJ, 650, L41
- de Jong et al. (2008) de Jong J. T. A., et al., 2008, ApJ, 680, 1112