Detections of massive stars in the cluster MCM2005b77, in the star-forming regions GRS G331.3400.36 (S62) and GRS G337.9200.48 (S36). ††thanks: Based on observations collected at the European Southern Observatory (ESO Programme 089.D-876(A)).
Abstract
Large infrared and millimeter wavelength surveys of the Galactic plane have unveiled more than 600 new bubble Hii regions and more than 3000 candidate star clusters. We present a study of the candidate clusters MCM2005b72, DBS2003-157, DBS2003-172, and MCM2005b77, based on near-infrared spectroscopy taken with SofI on the NTT and infrared photometry from the 2MASS, VVV, and GLIMPSE surveys. We find that (1) MCM2005b72 and DBS2003-157 are subregions of the same star-forming region, Hii GRS G331.3400.36 (bubble S62). MCM2005b72 coincides with the central part of this Hii region, while DBS2003-157 is a bright mid-infrared knot of the S62 shell. We detected two O-type stars at extinction A=1.0-1.3 mag. Their spectrophotometric properties are consistent with the near-kinematic distance to GRS G331.3400.36 of kpc. (2) DBS2003-172 coincides with a bright mid-infrared knot in the S36 shell (GRS G337.9200.48), where we detected a pair of candidate He I stars embedded in a small cometary nebula. (3) The stellar cluster MCM2005b77 is rich in B-type stars, has an average A of 0.91 mag, and is adjacent to the Hii region IRAS 161375025. The average spectrophotometric distance of kpc matches the near-kinematic distance to IRAS 161375025 of kpc.
Subject headings:
ISM: bubbles — Galaxy: stellar content — infrared: stars — stars: massive1. Introduction
Massive stars form continuously in the Galactic disk, chemically enriching the interstellar medium through by losing mass at high rates and by exploding. They are usually detected in groups or clusters of stars and make good tracers of Galactic structure (e.g. Georgelin & Georgelin 1976; Russeil 2003). More than 3000 candidate stellar clusters have been detected in large near-infrared and mid-infrared surveys of the Galactic plane (e.g. Mercer et al. 2005; Dutra et al. 2003; Froebrich et al. 2007; Glushkova et al. 2010; Borissova et al. 2011; Solin et al. 2012; Camargo et al. 2012). The most concentrated and populous candidate clusters are usually studied first – with about 20 young clusters known to be more massive than M⊙– but there is a plethora of sparse groups of stars or extended regions of increased stellar counts in the direction of nebulosities.
In the course of the Galactic Legacy Infrared Mid-plane Survey Extraordinaire (GLIMPSE), marvelous nebulae were detected along the Galactic plane, making it a “bubbling” environment (e.g. Watson et al. 2008, 2009; Churchwell et al. 2009). A typical bubble is marked by a shell of mid-infrared emission from dust and polycyclic aromatic hydrocarbon (PAH) bands (e.g. at 5.8 m and 8.0 m) surrounding a Hii region. Indeed, GLIMPSE bubbles are filled with radio continuum emission (e.g. Watson et al. 2008; Richards et al. 2012; Deharveng et al. 2010). The bubbles are created by winds, explosions, and UV radiation from massive stars (O-type and early B-type stars). To investigate their origin, it is of primary importance to study loose candidate clusters found in the direction of Hii regions, to detect the ionizing stars and to characterize the continuum photons and the associated bubbles. The types of the dominant stars determine the number of Lyman photons () of a system. About 90% of bubbles are expected to contain massive OB stars. Undoubtedly, the Westerlund 2 cluster sustains the RCW49 nebula (e.g. Povich et al. 2008), but, so far, massive stars have remained undetected in most bubbles. For several bubbles associated with HII regions, candidate ionizing stars (photometrically identified) are listed in the works of, for example, Watson et al. (e.g. 2008), Watson et al. (2009), and Sidorin et al. (2014). Interstellar extinction toward bubbles is highly patchy and some candidate clusters may simply be zones of lower interstellar extinction (e.g. Messineo et al. 2015; Dutra & Bica 2001; Gonzalez et al. 2012). Typically, more than 50% of the detected candidate clusters are found to be spurious when followed up with spectroscopic studies of the brightest stars (e.g. Messineo et al. 2014b; Froebrich et al. 2007; Borissova et al. 2005).
In this paper, we report on low-resolution infrared spectroscopy of several stellar overdensities that are projected toward Galactic bubbles. The candidates MCM2005b72 (Mercer et al. 2005) and DBS2003-157 (Dutra et al. 2003) are both located in the direction of GRS G331.3400.36 (S62; Culverhouse et al. 2011; Churchwell et al. 2006; Simpson et al. 2012). The candidate cluster DBS2003-172 (Dutra et al. 2003) is projected onto GRS G337.9200.48 (S36; Culverhouse et al. 2011; Churchwell et al. 2006). The candidate cluster MCM2005b77 (Mercer et al. 2005) is located at near the Hii region (and far-infrared source) IRAS 16137-5025. The spectroscopic observations are described in Section 2 and the data analysis in Section 3. In Sections 4 and 5, we review the properties of the confirmed stellar clusters and massive stars. A summary is provided in Section 6.
| Name | (J2000) | (J2000) | Longitude | Latitude | Diameter | Hii region | Cluster references |
|---|---|---|---|---|---|---|---|
| [hh mm ss] | [ | [∘] | [∘] | [′′] | |||
| DBS2003-157 | 16 12 20 | 51 46 12 | 331.330 | 0.334 | 126 | GRS G331.3400.36a | 1, 2 |
| MCM2005b72 | 16 12 30 | 51 46 59 | 331.340 | 0.361 | 72 | GRS G331.3400.36a | 3 |
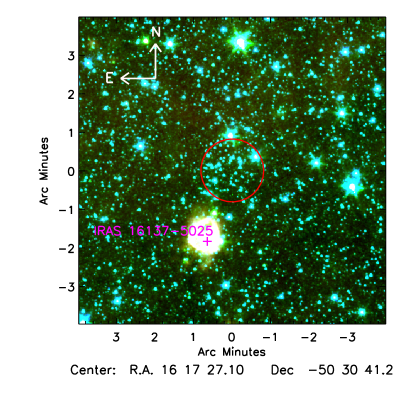
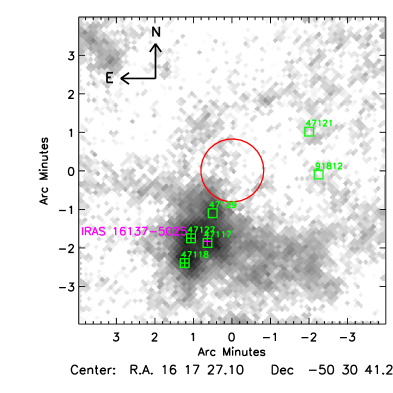
| MCM2005b77b | 16 17 27.1 | 50 30 41 | 332.780 | 0.022 | 98 | IRAS 161375025 | 3 |
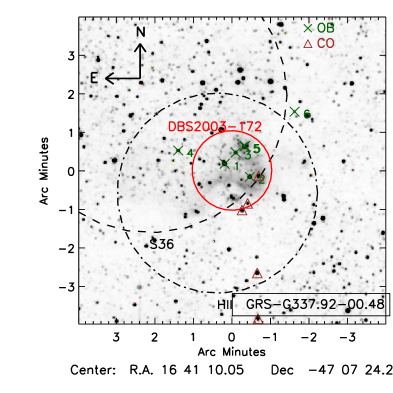
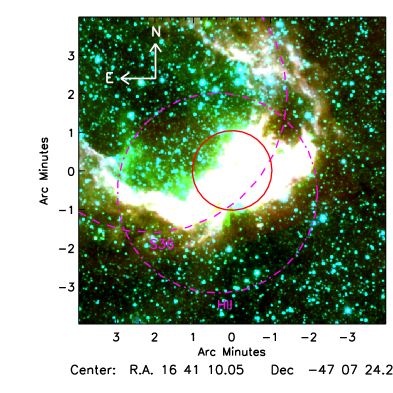
| DBS2003-172b | 16 41 10.1 | 47 07 24 | 337.923 | 0.469 | 125 | GRS G337.9200.48c | 1,4 |
-
Notes. (a) The Hii GRS G331.3400.36 (Culverhouse et al. 2011) includes the GLIMPSE bubble S62 (Churchwell et al. 2006; Simpson et al. 2012). (b) Centers of the clusters DBS2003-172 and MCM2005b77 were determined using centroids of the flux overdensities detected in the Ks images. The diameters are half-light diameters with respect to the peak positions. (c) The Hii GRS G337.9200.48 (Culverhouse et al. 2011) coincides with the brightest part of the GLIMPSE bubble S36 (Churchwell et al. 2006).
2. Observations and data reduction
Targets were selected among candidate clusters identified in GLIMPSE and 2MASS data, with bright near-infrared stars (e.g. Mercer et al. 2005; Dutra et al. 2003), observable with the Son of ISAAC (SofI) spectrograph (see Table 1 and Fig. 1), and possibly located in the direction of bubble HII regions.
Observations were taken with the SofI spectrograph on the ESO NTT/La Silla Telescope, under program 089.D-876(A) (P.I. Messineo), over three nights, from 2012 May 31 to June 2.
The spectroscopic observations were carried out using a slit. Typically, the slit orientation was adjusted to observe two targets per slit. For every target, a spectrum was taken with the high-resolution grism and the Ks filter, at a resolving power . At least four exposures per target were taken in an ABBA cycle, nodding along the slit.
Data reduction was performed with IDL scripts and with the Image Reduction and Analysis Facility (IRAF111IRAF is distributed by the National Optical Astronomy Observatories, which is operated by the Association of Universities.) software. Exposures close in time were subtracted from one another and flat-fielded with spectroscopic lamp flats. Up to five stellar traces were extracted in a single exposure. Atmospheric transmission and instrumental response curves were obtained with spectra of B-type stars observed in the same manner as the science targets, typically within a variation of 0.2 in airmass. Stellar lines (Brγ and He I) were removed from the standard spectra with a linear interpolation and the resulting spectra were multiplied by blackbody curves at the stellar effective temperatures.
Positions and spectral types of stars observed in GRS G331.3400.36 (S62), MCM2005b77, and GRS G337.9200.48 (S36) are listed in Tables 2, 3, and 4. Spectra are shown in Fig. 2 and 11.


3. Analysis
| Cluster | ID | (J2000) | (J2000) | Sp. Type | Alias/Comments | |
|---|---|---|---|---|---|---|
| [hh mm ss] | [ | |||||
| G331.340.36 | 1 | 16 12 33.23 | 51 45 35.6 | OBAF | ||
| G331.340.36 | 2 | 16 12 30.31 | 51 43 53.1 | B0-5 | 25000 6000 | |
| G331.340.36 | 3 | 16 12 20.54 | 51 46 46.0 | O4-6 | 41000 3000 | PAC2012-IRS 298a |
| G331.340.36 | 4 | 16 12 29.12 | 51 46 50.3 | OBAF | PAC2012-IRS 287 | |
| G331.340.36 | 5 | 16 12 20.03 | 51 46 26.2 | O9-B0 | 31000 2000 | PAC2012-IRS 339b |
| G331.340.36 | 6 | 16 12 33.26 | 51 46 16.9 | B0-3 | 25000 6000 | 2MASS J16123324-5146173/ PAC2012-IRS 355c |
| G331.340.36 | 7 | 16 12 42.35 | 51 45 01.6 | OBAF | ||
| G331.340.36 | 8 | 16 12 33.14 | 51 47 41.6 | OBAF | ||
| MCM2005b77 | 1 | 16 17 23.27 | 50 30 19.7 | B0-3 | 22000 6000 | |
| MCM2005b77 | 2 | 16 17 13.39 | 50 30 29.3 | G-F | ||
| MCM2005b77 | 3 | 16 17 41.39 | 50 28 25.6 | B0-5 | 21000 7000 | |
| MCM2005b77 | 4 | 16 17 30.77 | 50 31 16.9 | B0-3 | 22000 6000 | |
| MCM2005b77 | 5 | 16 17 29.97 | 50 30 56.7 | B0-3 | 22000 6000 | |
| MCM2005b77 | 6 | 16 17 23.96 | 50 31 37.5 | B0-5 | 21000 7000 | |
| MCM2005b77 | 7 | 16 17 29.84 | 50 31 24.1 | B0-5 | 21000 7000 | |
| MCM2005b77 | 8 | 16 17 33.83 | 50 34 39.1 | B0-5 | 21000 7000 | |
| MCM2005b77 | 9 | 16 17 25.80 | 50 30 27.5 | B0-5 | 21000 7000 | |
| MCM2005b77 | 10 | 16 17 25.87 | 50 30 36.3 | B0-5 | 21000 7000 | |
| MCM2005b77 | 11 | 16 17 25.81 | 50 31 11.7 | B0-5 | 21000 7000 | |
| MCM2005b77 | 12 | 16 17 17.70 | 50 28 11.5 | OB | ||
| DBS2003-172 | 1 | 16 41 11.20 | 47 07 13.7 | OB | ||
| DBS2003-172 | 2 | 16 41 07.38 | 47 07 33.9 | OB | ||
| DBS2003-172 | 3 | 16 41 09.53 | 47 06 56.2 | OB | ||
| DBS2003-172 | 4 | 16 41 18.30 | 47 06 52.9 | OB | ||
| DBS2003-172 | 5A | 16 41 08.10 | 47 06 46.0 | OB | 2MASS J164108054706466 | |
| DBS2003-172 | 5B | 16 41 08.22 | 47 06 46.5 | OB | 2MASS J164108054706466 | |
| DBS2003-172 | 6 | 16 41 00.55 | 47 05 52.4 | OBAF |
3.1. Spectral classification of early-type stars
Spectral classification was performed by comparing the shapes of detected spectral lines from H, He and other heavier atoms (e.g. C, Na, Mg, and Fe) with those in atlases of known early-type stars (e.g. Hanson et al. 1996, 2005; Morris et al. 1996).
G331.340.36 (S62)
In the direction of the Hii region G331.340.36, we detected two B0-5 stars,
one massive O4-6 star and five other early types with less well determined spectral types.
In Fig. 2, stars #2 and #5 show the
He I line at 2.1126 m and Brγ in absorption, as seen in the spectra of B0-5 stars.
It could be argued that there is a possible He II line
at 2.1891 m is present in the spectrum of star
#5 (O9-B0). The spectrum of the O4-6 star #3 shows
two C IV lines (2.0705 m and 2.0796 m),
N III/C III emission at m,
the Brγ line in absorption, and the He II line at 2.1891 m in absorption.
The spectra of stars #1, #4, #6, #7, and #8 show
only Brγ in absorption; their spectral types may therefore range from O to F types.
For stars #3 (O6V), #5 (O9V), and #6 (B0) spectra in the bands ,, and were acquired and analyzed
by Pinheiro et al. (2012). By having added the detection of CIV lines we confirm that
star #3 is an early O-type star.
The feature at 2.183 m that appears in some spectra is a glitch, at the juncture of the lower and upper quadrants (pixels 510-512) of the SofI array.
MCM2005b77
In the cluster MCM2005b77,
the spectra of stars #1, #3, #4, #5, #6, #7, #8, #9, and #11
are characterized by Brγ lines in absorption, He I at 2.1126
m in absorption, and possible He I at 2.0587 m.
The latter He I line appears in emission in the spectra
of stars #1, #4, and #5, indicating a supergiant luminosity class
(Davies et al. 2012; Hanson et al. 1996).
The spectra of stars #2 and #10 show only Brγ in absorption, which is
compatible with spectral types from B to F.
In Sect. 4.2, we refine their spectral types photometrically,
to a G-F and a B0-5 star, respectively.
The spectrum of star #12 has a strong Brγ line in emission.
DBS2003-172 in GRS G337.9200.48 (S36)
We detected seven early-type stars in the direction of DBS2003-172.
The spectra of stars #1, #2, #4, and #6 display only the Brγ line in absorption. Their spectral types are therefore poorly constrained and
could range from O to F.
The spectrum of star #3 shows a strong Brγ line in emission.
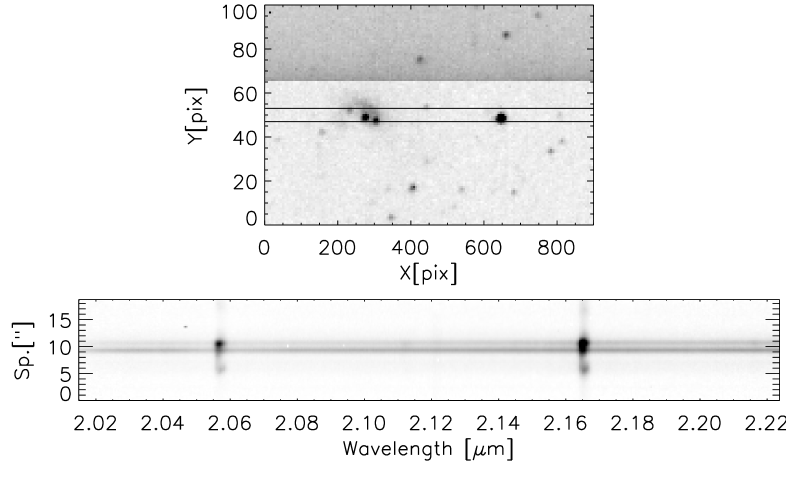
On the spectroscopic exposure, two stellar traces are seen at the location of 2MASS J164108054706466 (stars #5A and #5B). Indeed, in the SofI acquisition image taken with the filter NB_2.248 (0.030 m wide) and shown in Fig. 3, there are two stars, separated by about 14 (5 pixels), which were unresolved in 2MASS images. We extracted two spectra from the rectified traces, using narrow apertures of 2 pixels, centered on the two maxima. Knots of the He I line at 2.058 m and Brγ are clearly seen in the traces of both components, but appear to be stronger in the B component (the source with weaker continuum). Diffuse nebular emission was also detected. For the B component, the ratio between the equivalent width (EW) of the He I line at 2.058 m and that of the Brγ line is found to be equal to (with no extinction correction). For the A component, this ratio is . The B component displays an additional weak He I line at 2.112 m, [FeIII] at 2.2178 m, and possible [FeII] at 2.241 m (see Table 3).
| B component | |||||
| Atom | EW | FWHM | Line Refs. | ||
| [m] | [m] | [] | [] | ||
| He I | 2.05869 | 2.05824 | |||
| He I | 2.11238 | 2.11250 | |||
| C III or | 2.1217 | 2.12165 | Najarro et al. (1997) | ||
| H2 (ISM) | Tanner et al. (2006) | ||||
| Brγ | 2.16613 | 2.16573 | |||
| 2.2184 | 2.21808 | Nahar & Pradhan (1996) | |||
| 2.241 | 2.24167 | Geballe et al. (2000) | |||
| A component | |||||
| He I | 2.05869 | 2.05818 | |||
| Brγ | 2.16613 | 2.16565 |
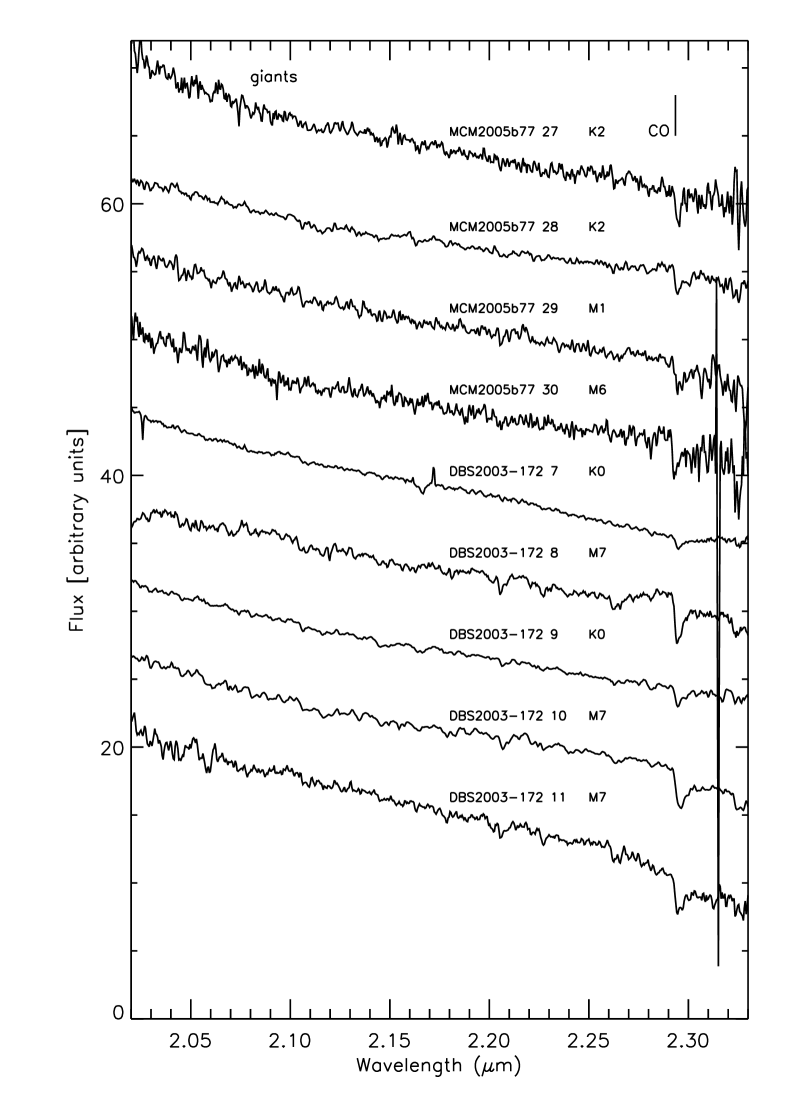
3.2. Spectral classification of late-type stars
-band spectra of late-type stars are easily recognizable by CO absorption bands with a band head at 2.2935 m. The strongest overtone band (, =2-0) was used to estimate stellar effective temperatures (e.g. Blum et al. 2003; Figer et al. 2006; Messineo et al. 2010; Ramírez et al. 2000). The EW of the CO bands, EW(CO), linearly increases with decreasing stellar temperature and increases with increasing luminosity class, so red giants and supergiants follow two different linear relations. We classified the late-type stars by quantitatively comparing the CO bands with those of stars in the atlas by Kleinmann & Hall (1986). The spectra were initially dereddened with an average color of Ks= 1.05 mag and Ks= 0.24 mag. The average color implies an uncertainty in A of 0.1 mag, which has a negligible effect on the EW(CO) measurements. EW(CO)s were measured from 2.290 m to 2.307 m. Uncertainties were estimated by measuring the EW(CO) twice, with two different assumptions about the continuum, i.e. by assuming a constant continuum (from 2.285 m to 2.290 m; Figer et al. 2006; Kleinmann & Hall 1986) and by using a first-order linear fit to several continuum regions (from 2.250 m to 2.257 m, from 2.270 m to 2.277 m, and from 2.285 m to 2.290 m, Ramírez et al. 2000). Average EW(CO)s are listed in Table 4. Due to a loss of instrumental sensitivity longward of 2.3 m, the high-resolution mode of SofI is not optimal for spectral classification of late-type stars. Spectral types were inferred by comparing EW(CO) measurements of Kleinmann & Hall (1986) atlas stars with those of stars observed with both the low-resolution mode, which covers to 2.4 m, and high-resolution mode of SofI, as described in Messineo et al. (2014b, 2017). The resulting spectral types are within subclasses.
| Field | ID | (J2000) | (J2000) | EW(CO) | Sp(RGB) | BCk | ||
|---|---|---|---|---|---|---|---|---|
| [hh mm ss] | [ | Å | [mag] | [mag] | [mag] | |||
| G331.340.36 | 9 | 16 12 34.94 | 51 49 01.5 | 20.54 1.39 | M6 | 5.79 0.02 | 0.67 0.02 | 3.04 |
| G331.340.36 | 10 | 16 12 25.17 | 51 55 56.4 | 15.20 3.18 | M1 | 6.60 0.02 | 0.95 0.01 | 2.73 |
| G331.340.36 | 11 | 16 12 40.06 | 51 45 29.5 | 20.69 1.65 | M6 | 7.21 0.03 | 0.62 0.02 | 3.04 |
| G331.340.36 | 12 | 16 12 36.47 | 51 50 19.3 | 19.76 2.12 | M5 | 7.44 0.03 | 0.83 0.02 | 2.96 |
| G331.340.36 | 13 | 16 12 33.00 | 51 45 19.9 | 22.90 2.17 | M7 | 8.65 0.02 | 2.10 0.02 | 3.13 |
| G331.340.36 | 14 | 16 12 02.22 | 51 49 25.1 | 10.02 1.62 | K1 | 8.91 0.03 | 0.17 0.02 | 2.45 |
| G331.340.36 | 15 | 16 12 42.35 | 51 44 23.6 | 04.82 1.00 | K0 | 9.00 0.02 | 0.14 0.02 | 2.40 |
| G331.340.36 | 16 | 16 12 27.95 | 51 46 35.7 | 13.77 1.36 | K5 | 9.21 0.03 | 0.62 0.02 | 2.64 |
| G331.340.36 | 17 | 16 12 37.14 | 51 47 07.6 | 14.14 0.37 | K5 | 10.00 0.03 | 0.22 0.02 | 2.64 |
| MCM2005b77 | 13 | 16 17 07.51 | 50 31 06.4 | 27.17 0.88 | M7 Mira | 5.32 0.03 | 0.65 0.02 | 3.17 |
| MCM2005b77 | 14 | 16 17 27.40 | 50 29 46.5 | 31.52 1.25 | M7 Mira | 6.61 0.03 | 1.26 0.02 | 3.17 |
| MCM2005b77 | 15 | 16 17 42.12 | 50 30 03.3 | 20.03 1.24 | M5 | 6.79 0.02 | 0.69 0.02 | 2.96 |
| MCM2005b77 | 16 | 16 17 50.70 | 50 27 53.6 | 20.51 1.22 | M6 | 6.96 0.02 | 0.35 0.02 | 3.04 |
| MCM2005b77 | 17 | 16 17 08.65 | 50 27 36.0 | 20.38 1.19 | M6 | 7.04 0.02 | 0.82 0.02 | 3.04 |
| MCM2005b77 | 18(a) | 16 17 06.87 | 50 30 45.6 | 11.06 0.47 | K2 | 7.21 0.03 | 0.18 0.02 | 2.50 |
| MCM2005b77 | 19 | 16 17 28.15 | 50 33 40.4 | 20.31 1.60 | M6 | 7.29 0.02 | 1.12 0.02 | 3.04 |
| MCM2005b77 | 20 | 16 17 03.38 | 50 28 33.4 | 13.22 1.05 | K5 | 7.34 0.02 | 0.26 0.01 | 2.64 |
| MCM2005b77 | 21 | 16 17 19.95 | 50 27 59.2 | 21.32 1.58 | M7 | 7.48 0.02 | 0.83 0.02 | 3.13 |
| MCM2005b77 | 22(b) | 16 17 25.79 | 50 27 20.8 | 16.48 0.37 | M2 Mira | 7.59 0.03 | 3.60 0.05 | 2.80 |
| MCM2005b77 | 23 | 16 17 45.95 | 50 34 05.1 | 19.78 1.41 | M5 | 7.61 0.03 | 0.88 0.02 | 2.96 |
| MCM2005b77 | 24 | 16 17 10.36 | 50 33 59.3 | 21.67 1.53 | M7 | 7.83 0.02 | 1.26 0.02 | 3.13 |
| MCM2005b77 | 25 | 16 17 21.30 | 50 26 43.4 | 16.54 1.43 | M2 | 7.99 0.02 | 1.10 0.02 | 2.80 |
| MCM2005b77 | 26 | 16 17 26.00 | 50 30 23.0 | 09.77 1.03 | K1 | 10.51 0.03 | 0.17 0.04 | 2.45 |
| MCM2005b77 | 27 | 16 17 29.89 | 50 32 41.9 | 10.86 1.87 | K2 | 10.70 0.03 | 0.60 0.02 | 2.50 |
| MCM2005b77 | 28 | 16 17 23.97 | 50 30 47.3 | 10.15 1.03 | K2 | 11.00 0.03 | 0.31 0.02 | 2.50 |
| MCM2005b77 | 29 | 16 17 36.20 | 50 30 34.0 | 15.84 0.27 | M1 | 11.39 0.03 | 1.28 0.03 | 2.73 |
| MCM2005b77 | 30 | 16 17 23.92 | 50 31 26.8 | 20.99 1.13 | M6 | 11.63 0.05 | 1.30 0.05 | 3.04 |
| DBS2003-172 | 7 | 16 41 08.56 | 47 08 25.7 | 04.32 2.36 | K0 | 8.51 0.02 | 0.08 0.02 | 2.40 |
| DBS2003-172 | 8 | 16 41 06.24 | 47 10 03.7 | 21.36 0.50 | M7 | 8.63 0.02 | 2.54 0.02 | 3.13 |
| DBS2003-172 | 9 | 16 41 06.13 | 47 11 14.8 | 07.49 1.18 | K0 | 9.07 0.03 | 0.18 0.02 | 2.40 |
| DBS2003-172 | 10 | 16 41 06.02 | 47 07 32.4 | 21.76 0.20 | M7 | 9.49 0.80 | 2.16 0.44 | 3.13 |
| DBS2003-172 | 11 | 16 41 07.70 | 47 08 15.3 | 23.63 3.99 | M7 | 10.45 0.02 | 3.13 0.04 | 3.13 |
-
Notes.
(a) MCM2005b77-18=CD-50 10319. (b) MCM2005b77-22=IRAS 16136-5020.
3.3. Available photometry
We searched for counterparts in the near-infrared catalogs from the Two Micron all Sky Survey (2MASS, Skrutskie et al. 2006) and the Deep Near-infrared Survey (DENIS, Epchtein et al. 1999), using a search radius of 20. Matches with 2MASS datapoints were visually checked by superimposing 2MASS datapoints on the acquisition charts (astrometrically aligned to 2MASS).
We also searched the mid-infrared catalogs of the Galactic Legacy Infrared Mid-Plane Survey Extraordinaire (GLIMPSE, Benjamin et al. 2003), the Midcourse Space Experiment (MSX, Egan et al. 2003; Price et al. 2001), and the Wide-field Infrared Survey Explorer (WISE, Wright et al. 2010), using search radii of 20, 50, and 20, respectively. We searched for measurements in the Naval Observatory Merged Astrometric Data set (NOMAD) by Zacharias et al. (2005) and for data in the second release (DR2) of the GAIA catalog (Gaia Collaboration 2018).
For all but three detected stars, infrared charts (provided in Appendix) were available from the VISTA Variables in the Via Lactea survey (VVV) (e.g. Soto et al. 2013). VVV Ks-band sources are in the regime of linearity up to 11.5 mag. Detected targets have Ks from 5.57 mag to 11.63 mag, so 2MASS measurements are adopted for most of the targets.
In Tables 5 and 6, we show the collected photometric measurements of the early-type and late-type stars detected in GRS G331.340.36, MCM2005b77, and GRS G337.9200.48.
3.3.1 PSF photometry from VVV images
For fields GRS G331.340.36 (MCM2005b72/DBS2003-157), MCM2005b77, and GRS G337.9200.48 (DBS2003-172), photometric catalogs of fainter stars were extracted from VVV images using the point-spread function (PSF) fitting routines by Stetson (1987). Images (stacks and tile stacks) were retrieved from the VISTA Science Archive (VSA)222http://horus.roe.ac.uk/vsa/index.html and reduced with the the Cambridge Astronomy Survey Unit (CASU) pipeline333http://casu.ast.cam.ac.uk. Stacks are created from two dithered exposures of the same chip. Tile stacks are obtained by combining six offset exposures per observation to yield contiguous coverage. For DBS2003-172, a comparison of measurements extracted from the tile stack and from individual stacks of a field is given in Fig. 4. For the DBS2003-172 field and for the GRS G331.340.36 field (), target measurements were analyzed in four stacks (EXPTIME =10s, 10s, and 4s), but eventually, for the surrounding field, the magnitudes measured on the tile stack were retained. For MCM2005b77, one stack that covered the whole cluster was available (, EXPTIME = 10 s in -band, -band, and in Ks bands).
Catalogs extracted from VVV data were combined with 2MASS datapoints. Absolute calibration was performed with 2MASS datapoints from 12.5 to 15 in mag, from 12.5 to 14.5 in band, and from 11.5 to 13.0 mag in Ks band. 2MASS magnitudes were retained for bright stars that were saturated in the VVV images.
For GRS G331.340.36 Ks photometry of the central taken with a spatial scale of 048 pix-1 is also available from Pinheiro et al. (2012).

3.3.2 Photometry of DBS2003-172 #5A & #5B
Stars #5 A and B are blended in 2MASS. The acquisition image taken with the narrowband filter NB2.248 (2.248 m) on SofI shows two stars, DBS2003-172 #5A and #5B, surrounded by a nebular arc. By measuring their counts, and those of nearby stars, on the acquisition image, using a PSF model and scaling them by the 2MASS magnitudes, we estimated Ks mag for component A and Ks mag for component B. These Ks magnitude estimates are consistent with values from the VVV survey. In VVV images, component A is clearly detected in all bands, but component B is detected only in the Ks band. Ks magnitudes are above the linear regime (within 0.6 mag): we measured Ks)= mag) for component A and Ks)= mag) for component B.
| 2MASS | DENIS | GLIMPSE | MSX | WISE | NOMAD | GAIA | |||||||||||||||||
|---|---|---|---|---|---|---|---|---|---|---|---|---|---|---|---|---|---|---|---|---|---|---|---|
| Field | ID | var | |||||||||||||||||||||
| [mag] | [mag] | [mag] | [mag] | [mag] | [mag] | [mag] | [mag] | [mag] | [mag] | [mag] | [mag] | [mag] | [mag] | [mag] | [mag] | [mas/yr] | [mas/yr] | [mag] | [mas] | ||||
| G331.340.36 | 1 | 10.02 | 9.08 | 8.67 | 12.68 | 10.02 | 8.61 | 8.38 | 8.32 | 8.18 | 8.25 | 8.36 | 8.25 | 16.28 | 4.15 0.16 | 3.84 0.10 | 14.26 | 0.11 0.10 | 0 | ||||
| G331.340.36 | 2 | 9.74 | 9.18 | 8.89 | 11.70 | 9.71 | 8.87 | 8.72 | 8.63 | 8.60 | 8.83 | 8.63 | 8.48 | 15.88 | 14.30 | 12.82 | 3.76 0.61 | 1.39 0.42 | 13.13 | 0.07 0.36 | 0 | ||
| G331.340.36 | 3 | 11.70 | 10.27 | 9.57 | 16.67 | 11.62 | 9.47 | 9.01 | 8.88 | 8.80 | 8.87 | 2.44 0.42 | 2.93 0.28 | 17.87 | 0.15 0.28 | 0 | |||||||
| G331.340.36 | 4 | 11.20 | 10.14 | 9.72 | 14.14 | 11.24 | 9.65 | 9.36 | 9.32 | 9.28 | 9.29 | 9.03 | 15.74 | 15.17 | 3.94 0.19 | 4.45 0.13 | 15.77 | 0.06 0.13 | 0 | ||||
| G331.340.36 | 5+ | 11.78 | 10.60 | 9.99 | 15.84 | 11.75 | 9.98 | 9.53 | 9.48 | 9.48 | 9.35 | 8.91 | 17.53 | 17.35 | 3.98 0.36 | 3.50 0.21 | 17.45 | 0.12 0.21 | 0 | ||||
| G331.340.36 | 6+ | 11.73 | 10.69 | 10.15 | 15.36 | 11.75 | 10.07 | 9.76 | 9.51 | 9.17 | 7.46 | 9.45 | 9.29 | 19.10 | 4.19 0.26 | 3.68 0.16 | 16.84 | 0.08 0.17 | 0 | ||||
| G331.340.36 | 7∗+ | 13.64 | 11.68 | 10.61 | 13.47 | 10.65 | 2.35 | 7.89 | 6.90 | 1.21 4.14 | 4.24 3.75 | 20.90 | 0.44 2.29 | 0 | |||||||||
| G331.340.36 | 8 | 11.61 | 11.26 | 11.08 | 12.62 | 11.59 | 11.05 | 10.96 | 10.79 | 10.57 | 10.93 | 10.57 | 14.34 | 13.72 | 13.83 | 2.88 0.05 | 3.84 0.03 | 13.51 | 0.51 0.03 | 0 | |||
| MCM2005b77 | 1 | 7.99 | 7.03 | 6.49 | 11.39 | 7.91 | 6.46 | 6.74 | 5.96 | 5.93 | 5.86 | 6.20 | 5.92 | 18.63 | 16.22 | 13.14 | 3.08 0.20 | 5.18 0.14 | 12.86 | 1.02 0.15 | 0 | ||
| MCM2005b77 | 2 | 12.89 | 9.51 | 7.80 | 12.83 | 7.78 | 6.82 | 5.91 | 6.04 | 5.92 | 6.69 | 6.07 | 0 | ||||||||||
| MCM2005b77 | 3 | 10.24 | 8.91 | 8.22 | 14.85 | 10.15 | 8.14 | 7.61 | 7.52 | 7.42 | 7.39 | 7.41 | 7.20 | 17.30 | 3.49 0.30 | 4.34 0.20 | 16.30 | 0.84 0.19 | 0 | ||||
| MCM2005b77 | 4 | 9.81 | 8.90 | 8.41 | 13.12 | 9.73 | 8.30 | 8.03 | 7.94 | 7.82 | 7.86 | 8.00 | 7.85 | 3.94 0.19 | 3.95 0.13 | 14.67 | 0.51 0.12 | 0 | |||||
| MCM2005b77 | 5 | 9.99 | 9.09 | 8.59 | 13.19 | 10.01 | 8.55 | 8.17 | 8.03 | 7.89 | 7.96 | 8.11 | 7.94 | 16.20 | 15.78 | 14.92 | 4.25 0.20 | 4.16 0.13 | 14.85 | 0.39 0.13 | 0 | ||
| MCM2005b77 | 6 | 10.40 | 9.26 | 8.71 | 14.49 | 10.40 | 8.70 | 8.33 | 8.13 | 7.99 | 8.05 | 8.24 | 7.98 | 17.71 | 4.47 0.24 | 4.03 0.16 | 15.89 | 0.25 0.16 | 0 | ||||
| MCM2005b77 | 7 | 10.52 | 9.49 | 8.99 | 14.09 | 10.54 | 8.95 | 8.59 | 8.54 | 8.36 | 8.43 | 8.62 | 8.46 | 16.79 | 4.40 0.20 | 4.05 0.13 | 15.57 | 0.40 0.14 | 0 | ||||
| MCM2005b77 | 8 | 10.57 | 9.71 | 9.30 | 13.44 | 10.49 | 9.33 | 8.99 | 8.92 | 8.85 | 8.97 | 9.02 | 8.95 | 18.08 | 17.71 | 15.37 | 4.51 0.16 | 3.76 0.10 | 14.97 | 0.54 0.10 | 0 | ||
| MCM2005b77 | 9 | 10.80 | 9.87 | 9.43 | 13.91 | 10.81 | 9.36 | 9.04 | 8.94 | 8.88 | 8.80 | 8.72 | 8.49 | 16.11 | 15.40 | 4.38 0.20 | 3.89 0.13 | 15.74 | 0.39 0.13 | 0 | |||
| MCM2005b77 | 10 | 11.69 | 10.68 | 10.13 | 15.39 | 11.78 | 10.14 | 9.85 | 9.73 | 9.69 | 9.78 | 17.83 | 16.90 | 7.73 0.54 | 7.14 0.32 | 17.06 | 0.54 0.33 | 0 | |||||
| MCM2005b77 | 11 | 11.94 | 10.82 | 10.28 | 11.96 | 10.22 | 9.89 | 9.74 | 9.66 | 9.80 | 4.53 0.33 | 4.09 0.20 | 17.54 | 0.29 0.21 | 0 | ||||||||
| MCM2005b77 | 12 | 14.34 | 12.31 | 10.97 | 14.36 | 10.94 | 9.41 | 8.93 | 8.48 | 8.27 | 9.56 | 8.83 | 0 | ||||||||||
| DBS2003-172 | 1 | 10.45 | 9.25 | 8.55 | 14.59 | 10.25 | 8.58 | 8.33 | 8.15 | 8.09 | 7.77 | 7.14 | 17.97 | 1.00 0.46 | 2.86 0.34 | 16.40 | 0.13 0.27 | 0 | |||||
| DBS2003-172 | 2 | 10.45 | 9.43 | 8.95 | 13.90 | 10.44 | 8.91 | 8.60 | 8.41 | 16.58 | 1.30 0.21 | 3.59 0.18 | 15.32 | 0.43 0.14 | 0 | ||||||||
| DBS2003-172 | 3 | 11.63 | 10.38 | 9.59 | 15.42 | 11.50 | 9.64 | 8.89 | 8.53 | 8.08 | 19.65 | 1.79 0.34 | 2.97 0.24 | 17.05 | 0.01 0.20 | 0 | |||||||
| DBS2003-172 | 4 | 11.46 | 10.45 | 9.98 | 14.99 | 11.50 | 9.95 | 9.70 | 9.55 | 9.51 | 9.47 | 18.74 | 1.61 0.27 | 3.15 0.21 | 16.45 | 0.36 0.18 | 0 | ||||||
| DBS2003-172 | 5A∗ | 14.26 | 11.75 | 10.78 | 12.99 | 9.42 | 1 | ||||||||||||||||
| DBS2003-172 | 5B∗ | 13.49 | 11.11 | 12.99 | 9.42 | 1 | |||||||||||||||||
| DBS2003-172 | 6 | 11.65 | 11.25 | 11.05 | 12.84 | 11.76 | 11.06 | 10.98 | 10.88 | 10.82 | 14.99 | 13.82 | 13.79 | 3.34 0.05 | 2.40 0.04 | 13.84 | 0.41 0.03 | 0 | |||||
-
Notes.
(+) 2MASS upper limits were replaced with photometric measurements from Pinheiro et al. (2012). (VVV magnitudes were above linearity.) (∗) Magnitudes are estimated from VVV images. The magnitude of 5 A is not in the linear regime (within 0.4 mag). The Ks magnitudes are also above linearity. However, estimates from the SofI acquisition image yielded values within 0.12 mag. (a) Star #6 in GRS G331.340.36 (2MASS J161233245146173) was previously photometrically classified as a young stellar object (Robitaille et al. 2008). The detection of the Brγ line in absorption indicates a later stage (a dwarf).
| 2MASS | DENIS | GLIMPSE | MSX | WISE | NOMAD | GAIA | |||||||||||||||||
|---|---|---|---|---|---|---|---|---|---|---|---|---|---|---|---|---|---|---|---|---|---|---|---|
| Field | ID | var | |||||||||||||||||||||
| [mag] | [mag] | [mag] | [mag] | [mag] | [mag] | [mag] | [mag] | [mag] | [mag] | [mag] | [mag] | [mag] | [mag] | [mag] | [mag] | [mas/yr] | [mas/yr] | [mag] | [mas] | ||||
| G331.340.36 | 9 | 7.82 | 6.39 | 5.79 | 11.49 | 7.12 | 4.92 | 5.51 | 6.13 | 5.34 | 5.37 | 5.41 | 5.36 | 19.56 | 14.72 | 1.38 0.19 | 4.23 0.13 | 12.98 | 0.29 0.13 | 0 | |||
| G331.340.36 | 10 | 8.99 | 7.28 | 6.60 | 13.43 | 9.02 | 6.69 | 6.66 | 6.35 | 6.05 | 6.11 | 6.18 | 6.21 | 3.04 0.21 | 2.69 0.14 | 14.88 | 0.09 0.13 | 0 | |||||
| G331.340.36 | 11 | 9.32 | 7.83 | 7.21 | 13.02 | 9.31 | 7.22 | 6.92 | 7.01 | 6.76 | 6.83 | 6.82 | 6.97 | 14.99 | 3.25 0.21 | 1.80 0.14 | 14.65 | 0.15 0.14 | 0 | ||||
| G331.340.36 | 12 | 9.77 | 8.15 | 7.44 | 14.07 | 9.76 | 7.45 | 7.07 | 7.18 | 6.95 | 6.97 | 7.04 | 7.13 | 18.92 | 4.88 0.23 | 5.33 0.16 | 15.46 | 0.24 0.15 | 0 | ||||
| G331.340.36 | 13 | 13.56 | 10.19 | 8.65 | 13.50 | 8.61 | 7.57 | 7.59 | 7.21 | 7.26 | 7.68 | 7.53 | 0 | ||||||||||
| G331.340.36 | 14 | 9.80 | 9.16 | 8.91 | 10.98 | 9.77 | 8.81 | 8.77 | 8.90 | 8.75 | 8.76 | 8.54 | 8.66 | 13.54 | 12.55 | 11.96 | 6.83 0.06 | 2.96 0.04 | 12.02 | 0.81 0.04 | 0 | ||
| G331.340.36 | 15 | 9.84 | 9.19 | 9.00 | 10.99 | 9.80 | 8.94 | 8.88 | 8.97 | 8.89 | 8.73 | 8.70 | 13.57 | 12.50 | 11.87 | 2.85 0.07 | 5.64 0.05 | 12.02 | 0.70 0.04 | 0 | |||
| G331.340.36 | 16 | 10.98 | 9.72 | 9.21 | 13.98 | 10.95 | 9.19 | 8.98 | 9.02 | 8.75 | 8.74 | 8.72 | 19.91 | 16.21 | 3.16 0.17 | 3.91 0.12 | 15.55 | 0.07 0.12 | 0 | ||||
| G331.340.36 | 17 | 11.02 | 10.27 | 10.00 | 12.52 | 11.07 | 9.98 | 9.88 | 9.94 | 9.79 | 9.74 | 9.94 | 9.94 | 15.53 | 14.11 | 13.54 | 1.27 0.05 | 4.55 0.03 | 13.70 | 0.55 0.03 | 0 | ||
| MCM2005b77 | 13 | 7.60 | 6.17 | 5.32 | 12.80 | 8.09 | 4.63 | 4.07 | 4.02 | 3.32 | 4.46 | 3.52 | 14.97 | 14.99 | 14.56 | 3.68 0.28 | 3.40 0.19 | 14.23 | 0.35 0.19 | 1 | |||
| MCM2005b77 | 14 | 10.15 | 7.83 | 6.61 | 10.18 | 6.65 | 5.82 | 5.17 | 4.96 | 5.17 | 5.95 | 5.18 | 4.93 0.76 | 5.47 0.47 | 19.08 | 0.27 0.50 | 0 | ||||||
| MCM2005b77 | 15 | 8.85 | 7.43 | 6.79 | 12.69 | 8.77 | 6.72 | 6.67 | 6.62 | 6.36 | 6.29 | 6.45 | 6.55 | 16.15 | 1.84 0.22 | 0.19 0.15 | 14.11 | 0.53 0.14 | 0 | ||||
| MCM2005b77 | 16 | 8.39 | 7.38 | 6.96 | 10.77 | 8.39 | 6.94 | 6.87 | 7.02 | 6.76 | 6.71 | 6.60 | 6.83 | 14.87 | 13.85 | 5.50 0.15 | 2.46 0.11 | 12.31 | 0.72 0.10 | 0 | |||
| MCM2005b77 | 17 | 9.37 | 7.76 | 7.05 | 13.66 | 9.26 | 7.14 | 6.90 | 6.93 | 6.64 | 6.57 | 6.02 | 6.74 | 6.85 | 16.33 | 16.82 | 8.96 0.23 | 7.50 0.15 | 14.99 | 0.47 0.15 | 0 | ||
| MCM2005b77 | 18 | 8.13 | 7.44 | 7.21 | 9.49 | 8.03 | 7.21 | 7.18 | 7.24 | 7.13 | 7.12 | 7.12 | 7.28 | 12.99 | 11.22 | 10.34 | 2.75 0.07 | 0.19 0.04 | 10.36 | 1.03 0.04 | 0 | ||
| MCM2005b77 | 19 | 10.16 | 8.13 | 7.29 | 15.63 | 10.13 | 7.35 | 6.69 | 6.95 | 6.62 | 6.64 | 6.72 | 6.80 | 5.22 0.35 | 5.04 0.20 | 16.85 | 0.44 0.21 | 0 | |||||
| MCM2005b77 | 20 | 8.46 | 7.64 | 7.34 | 10.07 | 8.50 | 7.38 | 7.22 | 7.34 | 7.19 | 7.11 | 7.09 | 7.19 | 13.29 | 12.45 | 11.20 | 2.33 0.10 | 1.82 0.07 | 11.18 | 0.39 0.07 | 0 | ||
| MCM2005b77 | 21 | 9.99 | 8.24 | 7.48 | 14.71 | 9.99 | 7.43 | 7.04 | 7.26 | 6.93 | 6.89 | 6.92 | 6.95 | 3.75 0.27 | 3.96 0.17 | 16.01 | 0.61 0.17 | 0 | |||||
| MCM2005b77 | 22 | 14.92 | 10.45 | 7.59 | 12.02 | 5.70 | 4.88 | 2.54 | 5.32 | 3.40 | 1 | ||||||||||||
| MCM2005b77 | 23 | 10.04 | 8.31 | 7.61 | 14.43 | 10.02 | 7.58 | 7.08 | 7.33 | 7.04 | 7.02 | 7.07 | 7.14 | 1.81 0.25 | 3.26 0.16 | 15.90 | 0.52 0.15 | 0 | |||||
| MCM2005b77 | 24 | 11.14 | 8.84 | 7.83 | 10.98 | 7.80 | 7.12 | 7.27 | 7.02 | 6.97 | 7.28 | 7.28 | 4.39 0.69 | 5.30 0.42 | 18.67 | 0.97 0.48 | 0 | ||||||
| MCM2005b77 | 25 | 10.65 | 8.79 | 7.99 | 15.96 | 10.63 | 7.94 | 7.51 | 7.57 | 7.34 | 7.35 | 7.48 | 7.52 | 3.32 0.32 | 3.10 0.21 | 17.16 | 0.45 0.21 | 0 | |||||
| MCM2005b77 | 26 | 11.40 | 10.77 | 10.51 | 12.92 | 11.43 | 10.43 | 10.38 | 10.42 | 10.28 | 10.05 | 14.99 | 14.36 | 13.19 | 1.28 0.04 | 3.14 0.03 | 14.07 | 0.39 0.03 | 0 | ||||
| MCM2005b77 | 27 | 12.40 | 11.19 | 10.70 | 15.73 | 12.45 | 10.67 | 10.29 | 10.31 | 18.21 | 4.40 0.24 | 3.89 0.16 | 17.25 | 0.18 0.16 | 0 | ||||||||
| MCM2005b77 | 28 | 12.16 | 11.29 | 11.00 | 14.00 | 12.15 | 11.01 | 10.82 | 10.86 | 10.88 | 10.93 | 10.68 | 10.59 | 15.61 | 0.45 0.08 | 1.09 0.05 | 15.33 | 0.29 0.05 | 0 | ||||
| MCM2005b77 | 29 | 14.40 | 12.29 | 11.39 | 14.41 | 11.32 | 10.72 | 10.70 | 10.50 | 10.64 | 10.66 | 10.57 | 0 | ||||||||||
| MCM2005b77 | 30 | 15.01 | 12.71 | 11.63 | 15.05 | 11.72 | 10.81 | 10.96 | 10.64 | 0 | |||||||||||||
| DBS2003-172 | 7 | 9.24 | 8.65 | 8.51 | 10.19 | 9.19 | 8.54 | 8.40 | 8.44 | 8.41 | 8.52 | 12.48 | 11.77 | 10.81 | 2.21 0.08 | 1.27 0.07 | 11.09 | 0.97 0.04 | 0 | ||||
| DBS2003-172 | 8 | 14.32 | 10.42 | 8.63 | 14.11 | 8.59 | 7.46 | 7.45 | 7.00 | 7.00 | 7.86 | 7.47 | 0 | ||||||||||
| DBS2003-172 | 9 | 10.00 | 9.36 | 9.07 | 11.42 | 9.91 | 9.09 | 8.94 | 9.04 | 8.95 | 8.82 | 8.81 | 8.84 | 13.91 | 12.84 | 11.99 | 1.20 0.07 | 2.72 0.06 | 12.57 | 0.33 0.04 | 0 | ||
| DBS2003-172 | 10 | 14.47 | 11.10 | 9.49 | 14.18 | 9.54 | 0 | ||||||||||||||||
| DBS2003-172 | 11∗ | 17.36 | 12.76 | 10.45 | 10.42 | 8.86 | 8.66 | 7.94 | 8.69 | 7.54 | 0 | ||||||||||||
-
(a) For the observed late-type stars a few alias names are found in the SIMBAD database. MCM2005b77-18 coincides with CD-5010319 and MCM2005b77-22 with IRAS 161365020. MCM2005b77-22 is listed as a possible carbon star by Skiff (2014). (∗∗) Proper motions values are from GAIA DR2.
3.4. Estimates of extinction
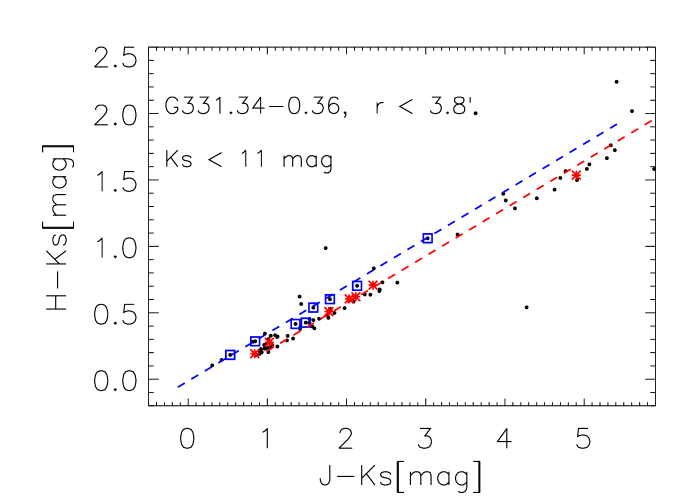
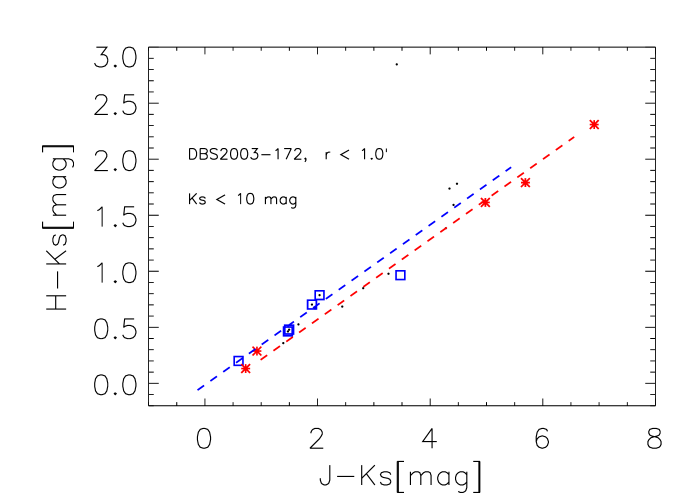
For early-type stars, estimates of reddenings (color excess) are obtained by assuming intrinsic colors per spectral type, as listed in Messineo et al. (2011). For late-type stars, intrinsic colors are taken from Koornneef (1983). Reddenings in Ks, Ks, and are converted into A values using the coefficients provided by Messineo et al. (2005) for an index . This index is consistent with the recent determination by Wang & Jiang (2014), which is based on spectroscopic observations of K-type giants. Tables 4 and 7 list our estimates of A. The sample mainly consists of “naked” early-type stars, as inferred by the consistent A values from multicolors and from the small values of and (Messineo et al. 2012). Star MCM2005b77 12 (Brγ in emission) has an 8 m excess. Stars DBS2003-172 5A and 5B are embedded in a nebula.
| Field | ID | Sp. Type | A (JH) | A (JKs) | A (HKs) | Comment | ||||
|---|---|---|---|---|---|---|---|---|---|---|
| G331.340.36 | 1 | OBAF | 0.060 | 0.010 | 0.829 | 0.760 | 0.637 | 0.191 0.199 | 0.226 0.037 | |
| G331.340.36 | 2 | B0-5 | 0.130 | 0.030 | 0.554 | 0.524 | 0.471 | 0.048 0.083 | 0.695 0.060 | FGa |
| G331.340.36 | 3 | O4-6 | 0.180 | 0.040 | 1.315 | 1.242 | 1.112 | 0.165 0.080 | 0.253 0.041 | |
| G331.340.36 | 4 | OBAF | 0.060 | 0.010 | 0.929 | 0.830 | 0.652 | 0.292 0.084 | ||
| G331.340.36 | 5 | O9-B0 | 0.160 | 0.040 | 1.096 | 1.047 | 0.960 | 0.104 0.085 | ||
| G331.340.36 | 6 | B0-3 | 0.130 | 0.030 | 0.956 | 0.918 | 0.851 | 0.071 0.124 | 5.661 0.008 | |
| G331.340.36 | 7 | OBAF | 0.060 | 0.010 | 1.686 | 1.656 | 1.602 | 0.053 0.927 | ||
| G331.340.36 | 8 | OBAF | 0.060 | 0.010 | 0.333 | 0.317 | 0.289 | 0.019 0.080 | FGa | |
| MCM2005b77 | 1 | B0-3 | 0.080 | 0.040 | 0.838 | 0.851 | 0.875 | 0.021 0.099 | 0.020 0.005 | Memberb |
| MCM2005b77 | 2 | OBAF | 0.050 | 0.040 | 2.843 | 2.763 | 2.621 | 0.302 0.080 | 0.367 0.006 | BGc |
| MCM2005b77 | 3 | B0-5 | 0.050 | 0.020 | 1.144 | 1.114 | 1.059 | 0.098 0.091 | 0.206 0.010 | BGc |
| MCM2005b77 | 4 | B0-3 | 0.080 | 0.040 | 0.789 | 0.793 | 0.800 | 0.011 0.083 | 0.083 0.011 | Member |
| MCM2005b77 | 5 | B0-3 | 0.080 | 0.040 | 0.787 | 0.794 | 0.806 | 0.002 0.084 | 0.312 0.004 | Member |
| MCM2005b77 | 6 | B0-5 | 0.050 | 0.020 | 0.980 | 0.933 | 0.850 | 0.154 0.080 | 0.082 0.010 | Member |
| MCM2005b77 | 7 | B0-5 | 0.050 | 0.020 | 0.890 | 0.851 | 0.782 | 0.127 0.078 | 0.037 0.014 | Member |
| MCM2005b77 | 8 | B0-5 | 0.050 | 0.020 | 0.746 | 0.709 | 0.645 | 0.120 0.085 | 0.386 0.009 | |
| MCM2005b77 | 9 | B0-5 | 0.050 | 0.020 | 0.798 | 0.760 | 0.691 | 0.127 0.139 | 0.330 0.005 | Member |
| MCM2005b77 | 10 | B0-5 | 0.050 | 0.020 | 0.874 | 0.867 | 0.854 | 0.021 0.095 | 0.631 0.014 | |
| MCM2005b77 | 11 | B0-5 | 0.050 | 0.020 | 0.959 | 0.917 | 0.841 | 0.139 0.800 | Member | |
| MCM2005b77 | 12 | OB | 0.050 | 0.020 | 1.726 | 1.837 | 2.035 | 0.381 0.084 | 3.887 0.012 | |
| DBS2003-172 | 1 | OBAF | 0.060 | 0.010 | 1.045 | 1.053 | 1.067 | 0.067 0.148 | ||
| DBS2003-172 | 2 | OBAF | 0.060 | 0.010 | 0.894 | 0.836 | 0.732 | 0.155 0.081 | ||
| DBS2003-172 | 3 | OB | 0.060 | 0.010 | 1.088 | 1.126 | 1.192 | 0.168 0.094 | ||
| DBS2003-172 | 4 | OBAF | 0.060 | 0.010 | 0.889 | 0.824 | 0.708 | 0.178 0.088 | 0.099 0.008 | |
| DBS2003-172 | 5A | OB | 0.060 | 0.010 | 2.142 | 1.897 | 1.459 | 0.770 1.122 | ||
| DBS2003-172 | 5B | OB | 0.060 | 0.010 | 3.575 | |||||
| DBS2003-172 | 6 | OBAF | 0.060 | 0.010 | 0.375 | 0.353 | 0.314 | 0.038 0.074 | FGa |
-
(a) FG= object in the background of the Hii region. (b) Member= cluster member on the basis of the radial distance and extinction; (c) BG= object in the background of the Hii region.
4. Massive members of clusters or star forming regions
We have detected several massive stars in the direction of each of the candidate clusters MCM2005b72/DBS2003-157 (GRS G331.340.36), MCM2005b77, and DBS2003-172 (GRS G337.920.48). In this section, we analyze the infrared properties of those stars, such as extinction and bolometric magnitudes, Mbol. We also estimate their spectrophotometric distances, in order to investigate their association with the nearby Hii regions.
Detected late-type stars are not discussed further, because they appear to be giants that are unrelated to the star forming regions analyzed. As shown in Table 4, for the assumed distances to the star forming regions, the Mbol for all but two of the detected late-type stars are mag, i.e. typical of giants. The two bright stars are asymptotic giant branch stars (AGBs) with strong water absorption in their spectra (see also Messineo et al. 2014a, b).
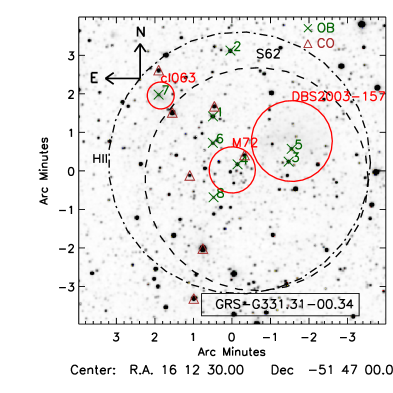
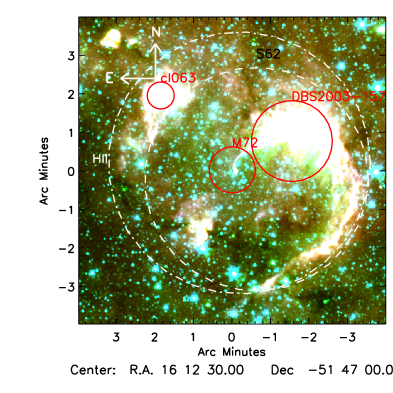
4.1. S62/GRS G331.3400.36
The candidate clusters MCM2005b72 (Mercer et al. 2005), DBS2003-157 (Dutra et al. 2003), and Cl063 (Borissova et al. 2011) are projected onto the Hii region GRS G331.3400.36. The Hii emission extends over an area of , as measured by Culverhouse et al. (2011) at 100 and 150 GHz. At this location, a bubble (S62) is seen at mid-infrared wavelengths (Churchwell et al. 2006; Simpson et al. 2012); dust emission shapes and defines several subregions. The candidate cluster DBS2003-157 overlaps with a large portion of GRS G331.3400.36; it was detected on 2MASS images as a region associated with nebular emission (Dutra et al. 2003). The candidate cluster MCM2005b72 was detected as an overdensity of stellar datapoints at 3.6 m (Mercer et al. 2005) and is adjacent to DBS2003-157. The candidate cluster Cl063 corresponds to a bright clump of dust emission on the northeastern side of GRS G331.3400.36 associated with IRAS 160895137, it was detected with VVV data (Borissova et al. 2011). These three candidate clusters are most probably subsets of the same young population associated with GRS G331.3400.36.
The Hii region indicates the presence of massive stars. We assume a thermal emission from an optically thin plasma at a temperature of about 10,000 K and neglect dust contribution to the flux. Using the formula of Martín-Hernández et al. (2003a), which is equivalent to that of Rubin (1968) when the recombination rate coefficients are taken from Storey & Hummer (1995), and using the Hii radio fluxes at 4.85 GHz (19.169 Jy), 100 GHz ( Jy), and 150 GHz ( Jy) listed in Kuchar & Clark (1997) and Culverhouse et al. (2011), we obtain log10(Nlyc[photons s-1])= 49.25, 48.8, and 49.0, respectively. These values are consistent with that inferred from the flux at 22 GHz by Pinheiro et al. (2012). This amount can be generated by a single O4-6 star.
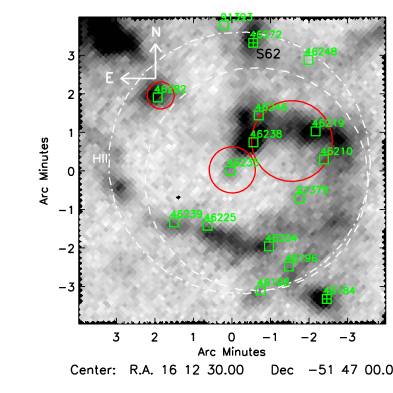
The region is still an active site of star formation. Several molecular clumps appear in the 870 m ATLASGAL map of S62 (Schuller et al. 2009), which is shown in Fig. 1. Sixteen compact molecular clumps, that is, 12 protostellar and four prestellar cores were identified in the direction of S62 by Elia et al. (2017). Highly reliable radial velocities are available for 9 clumps (Vlsr from to km s-1, Urquhart et al. 2018). Details are provided in the Appendix. In summary, all clumps are likely at the close distance of about 4 kpc, with the exception of Hi-GAL #46272 (Vlsr=-97.3 km s-1, 5.8 kpc; Urquhart et al. 2018) and #46184 (10.6 kpc, Elia et al. 2017), which are external to S62, as seen in the GLIMPSE 8 m map. The blackbody temperatures of the clumps range from 11.9 to 30.2 K and, for a common distance of 3.9 kpc, individual masses are from 30 to 600 M⊙, by having excluded Hi-GAL #46272 and #46184. Thirteen of these 14 clumps, equivalent to 3700 M⊙, are above their critical mass threshold for virial equilibrium (König et al. 2017; Bertoldi & McKee 1992).
4.1.1 Properties of the massive stars detected in S62/GRS G331.3400.36
We detected one O4-6 star (#3) and one O9-B0 star (#5) in the direction of GRS G331.3400.36 (S62). Pinheiro et al. (2012) identified the same two stars (#3 and #5) as the main ionizing sources. The O4-6 star has interstellar extinction A() = 1.3 mag, A(Ks)=1.2 mag, A(Ks) = 1.1 mag, with an average value of mag and mag. Assuming a dwarf class, as inferred in Pinheiro et al. (2012), and the MK listed by Martins & Plez (2006), we derive a distance modulus, DM, of mag. If a giant class would be assumed, then DM= mag. The Hii region GRS G331.3400.36 has a velocity of Vlsr km s-1 (Bronfman et al. 1996). Using this Vlsr and the Galactic rotation curve from Reid et al. (2009), we estimate a near-kinematic distance of kpc, DM= mag. We thus conclude that star #3 is associated with S62. The Mbol values derived using the near-kinematic distance are listed in Table 9.
Star #5 is 20′′ away from star #3 and has A= mag. Similar estimates of extinction suggest that star #5 is physically associated with the bubble. In the color-magnitude diagram (CMD) in Fig. 5, these two massive stars appear among the brightest stars. Assuming an O9-9.5 type for star #5, we obtain a DM between mag (dwarf) and mag (giant).
Star #2 (B0-5) is located on the northeastern side of the region, outside the bubble, at a significantly lower extinction of A=0.5 mag. A star that is foreground to the Hii region GRS G331.3400.36 cannot be ruled out. Assuming a dwarf, we derived DM= mag (1.4 kpc), assuming a giant, we obtained DM= mag. Unfortunately, the spectra of stars #1, #4, #6, #7, and #8 have poor signal-to-noise ratio and we can only conclude that they are not late-type stars. Star #8 (A0.3 mag) is likely to be foreground to the complex. From Fig. 5, stars #4 (A0.8 mag) and #7 (A 1.6 mag) are plausibly late-O stars related to S62. For star #6 (A 0.9 mag) Pinheiro et al. (2012) report an early B type, which yields a DM= mag for a giant or mag for a dwarf.
By assuming that the stars are at the nebular distance of 3.9 kpc, star #3 (O4-6V) is able to produce log10(Nlyc) from 49.0 to 49.5 photons s-1, star #5 (O9-9.5V) from 47.6 to 47.9 photons s-1, and star #6 (B0-B3V) from 43.9 to 47.6 (Martins et al. 2005; Panagia 1973). The O4-6 star is the main source of ionizing flux, as it accounts for the observed radio flux from this HII bubble (see above).
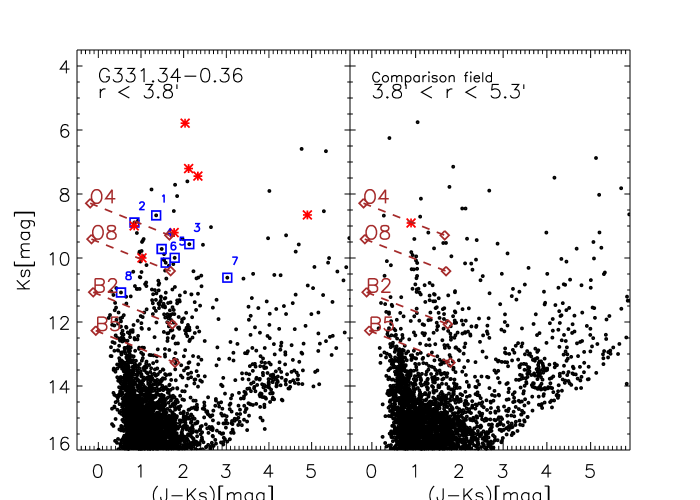
By inspecting the Ks versus Ks colors of stars brighter than Ks=11 mag, we find that a few other faint ionizing sources remain unobserved (Ks mag, see Fig. 5).
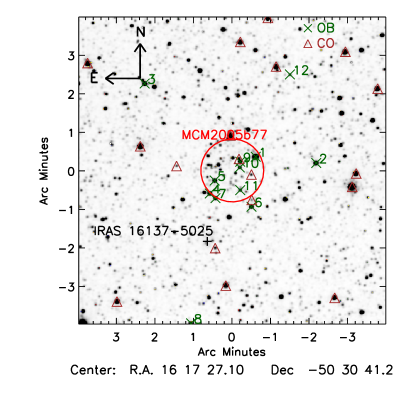
4.2. MCM2005b77
MCM2005b77 was detected by Mercer et al. (2005), with GLIMPSE and 2MASS data. This stellar cluster shows a well-peaked surface density in the 2MASS Ks image, with a half-light diameter of 98′′, and is rich in early-type stars. Our spectroscopic study revealed 12 early-type stars in the direction of this candidate cluster.
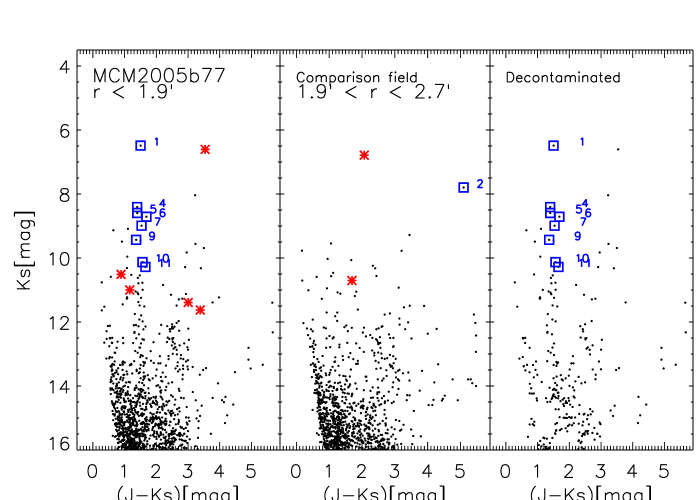
4.2.1 The color-magnitude diagram of MCM2005b77
A Ks versus Ks diagram of 2MASS datapoints in the direction of MCM2005b77 is shown in Fig. 6. The diagram shows a dwarf foreground sequence at Ks mag, a red clump sequence (not well defined) that crosses the CMD from Ks mag and Ks mag to Ks mag and Ks mag, and a tail of redder giants with Ks mag. The cluster sequence, consisting of B-type stars, appears above the red clump sequence at Ks mag and Ks mag. On the CMD, it is difficult to identify this at lower magnitudes because of the high number of field clump stars. Late-type and early-type stars separate out in the Ks and Ks diagram shown in Fig. 6. In the inner 1.9′, we count a total of 16 photometric early-type stars with (Ks mag), which include the 8 spectroscopically confirmed early types (#1, #4, #5, #6, #7, #9, #10, and #11). Average proper motions in the right ascension and declination directions are and , respectively, for all but star #10: mas/yr and mas/yr. Star #10 is more than 3 off, with mas/yr and mas/yr. It could be unrelated to the cluster; however, star #10 (OBAF) is similar in colors and magnitudes to the star #11 (B0-5), which, together with its location, indicates that it could be another B0-5 star with anomalous velocity. The average A and standard deviation of the eight spectroscopic early-type stars are 0.91 mag and 0.08 mag, respectively. The small dispersion of A values confirms that these stars are physically at the same distance and are members of the stellar cluster MCM2005b77 (see Table 7). Parallaxes from GAIA DR2 range from to mas, and the average is mas.
There are four other spectroscopic early-type stars detected outside the cluster radius. Stars #2 (OBAF) and #3 (B0-5), with A values of 2.9 mag and 1.2 mag, are probably unrelated background stars. Red Ks and Ks colors indicate that star #2 (OBAF) is a G-F star (see Fig. 6). Star #12 (Brγ in emission) is still enshrouded in dust (A= 1.8 mag). Star #8 (B0-5, Kso=8.55 mag) has an A similar to that of the cluster (0.8 mag) and derived magnitudes consistent with those of cluster members, but it resides a few arcminutes away from the cluster (see Fig. 1).
4.2.2 Spectrophotometric distance of MCM2005b77
The Hii region G332.769-0.007 (Bronfman et al. 1996) coincides with IRAS 161375025 (MSX G332.767300.0069) and is ′ away from the cluster center. With Vlsr km s-1 (CS observations with a beam width of 50′′, Bronfman et al. 1996), this Hii region is at a near-kinematic distance of kpc (DM= mag, Reid et al. 2009); a far-kinematic distance would yield 9.7 kpc. 13CO observations confirm the main component at km s-1, and a weaker components at km s-1 (Urquhart et al. 2007).
Along the line of sight to MCM2005b77, the model of Galactic dust distribution by Drimmel et al. (2003) predicts an A value of 0.8-0.9 mag (i.e., the extinction of MCM2005b77) for a heliocentric distance of 5.2 kpc. We thus conclude that the cluster MCM2005b77 (A=0.91 mag) is most probably at the same distance as the nearby IRAS 161375025.
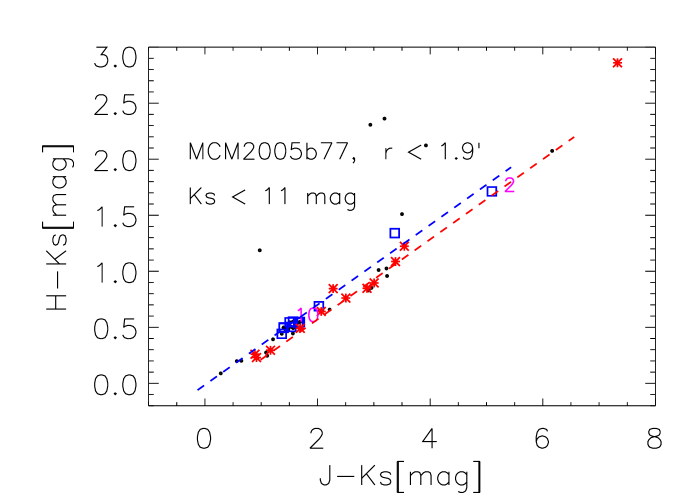
To estimate a spectrophotometric distance to the cluster, we analyze the seven B-type members within the cluster radius, using the intrinsic colors and absolute magnitudes per spectral type tabulated in Messineo et al. (2011). The spectra of stars #1, #4, and #5 have the He I line at 2.058 m in emission, which is common among early-B supergiants (e.g. Davies et al. 2012). Their dereddened Ks values, , range from 5.65 mag to 7.81 mag. Star #6 (B0-5), with mag, is also assumed to be a supergiant. These four stars yield an average DM of mag (see Table 8), which is compatible with the gaseous near-kinematic distance of the nearby source IRAS 161375025.
Assuming a kinematic distance of kpc, the Mbol values of all detected cluster members range from to mag (see Table 9; these values are typical of evolved B-type stars, class I and III, Martins & Plez 2006).
| CLUSTER-ID | Sp. group | DM | Phot. type | DM(phot)∗∗ | |||
|---|---|---|---|---|---|---|---|
| [mag] | [mag] | [mag] | [mag] | [mag] | |||
| MCM2005b77 1 | B0-3 | 5.65 | 6.27 | 11.92 0.92 | B3/B4 | 6.70 | 12.35 |
| MCM2005b77 4 | B0-3 | 7.62 | 6.27 | 13.89 0.92 | B0 | 5.85 | 13.47 |
| MCM2005b77 5 | B0-3 | 7.81 | 6.27 | 14.08 0.92 | B0 | 5.85 | 13.66 |
| MCM2005b77 6 | B0-5 | 7.73 | 6.49 | 14.22 1.14 | B0 | 5.85 | 13.58 |
| Average | 13.531.08 |
-
Notes.
(∗)= s are average values for supergiants with types from B0 to B3 (or B5). (∗∗)= and DM(Phot) are for photometrically inferred types (Phot. type) (Bibby et al. 2008).
4.2.3 Discussion of MCM2005b77
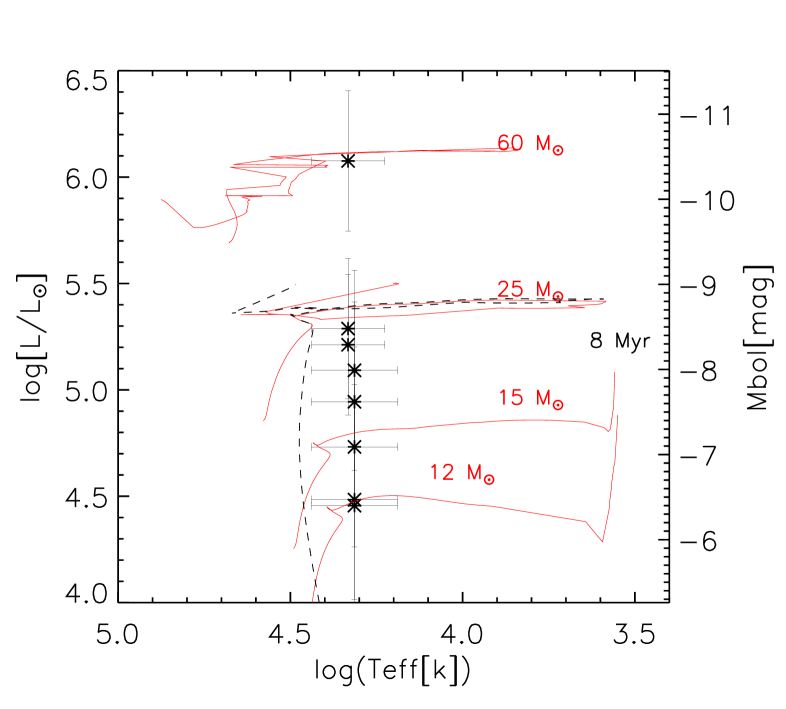
We found a concentration of eight early-type stars at the location of MCM2005b77. These have similar interstellar extinctions and appear along the same cluster sequence in the CMD. Assuming a distance of 5.2 kpc, the Mbol values of the members range from mag to mag and the new rotating stellar models from the Geneva group yield stellar masses from 12 to 60 M⊙ (Ekström et al. 2012). Within errors, all detected members except star #1 are consistent with a coeval population of about 8 Myr (Ekström et al. 2012). The maximum initial unexploded stellar mass in such a population has a mass of M⊙, while masses of 18 M⊙ are already evolving after the main sequence.
We counted a number of 16 photometric early-type stars, down to Ks=11 mag, which is the limit at which completeness can be assumed. Assuming a Salpeter mass function, a minimum mass of M⊙ is derived and by extrapolating to 1 M⊙ we infer a cluster mass of about M⊙.
Star #1 has an A consistent with those of fainter members and infrared colors and spectral features consistent with a normal B star. It is exceptionally bright ( mag, Mbol=10.45 mag) for an 8 Myr old population. The second brightest star has mag and a companion could brighten it by only mag. Assuming a single star, a mass of 60 M⊙ is derived.
For a distance of 5.2 kpc, in the MCM2005b77 cluster, we counted four probable blue supergiants, one giant, and six dwarfs ( M⊙) (Martins et al. 2005). Assuming B0 types, we estimate log10(Nlyc) = 49.2 photons s-1, assuming B1 stars, 47.4 photons s-1, and assuming B2 stars, 46.83 photons s-1 (Panagia 1973). The cluster may be contributing ionizing photons for the nearby Hii region IRAS 161375025 (MSX G332.767300.0069). The Hii region has a flux density of Jy at 150 GHz and log10(Nlyc) 48.52 photons s-1 are sufficient to power it. In the direction of IRAS 161375025, some molecular clumps are currently collapsing. The ATLASGAL clumps have integrated fluxes from 8.19 to 12.79 Jy (Urquhart et al. 2014; Wienen et al. 2015). Four compact clumps are detected with Hi-GAL data (numbers 47117,47118,47127, and 17129; Elia et al. 2017) and classified as proto-stellar clumps (with mid-infrared detections). Estimated dust temperatures range from 12.09 to 20.39 K and, for an assumed distance of 5.2 kpc, masses from 500 to 1500 M⊙, make up a total mass of about 3800 M⊙ enclosed within a circle of 2 pc radius (see the Appendix). For Hi-GAL 47118 (AGAL332.767-00.019) and 47127 (AGAL332.774-00.009), similarly high masses of 1340 and 1982 M⊙, respectively, are estimated by Heyer et al. (2016). Radial velocities confirm near-kinematic distances and association with IRAS 161375025 for the four Hi-GAL/ATLASGAL sources (from to km s-1; Urquhart et al. 2018).
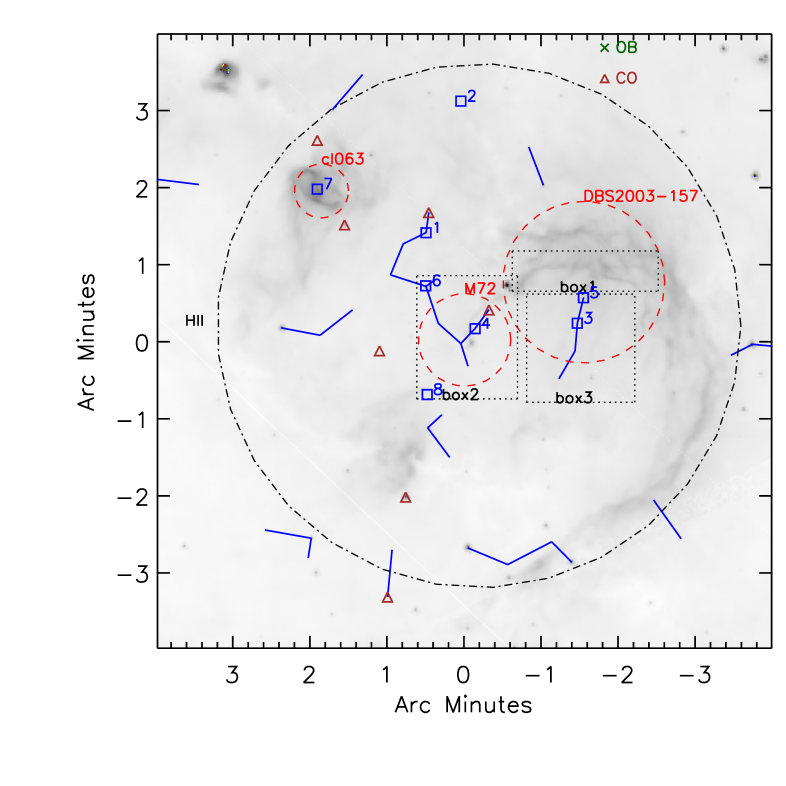
4.3. DBS2003-172
DBS2003-172 is reported as an infrared candidate stellar cluster by Dutra et al. (2003). Deeper infrared photometry confirmed a rich population of young stars in a star-forming region (Borissova et al. 2006).
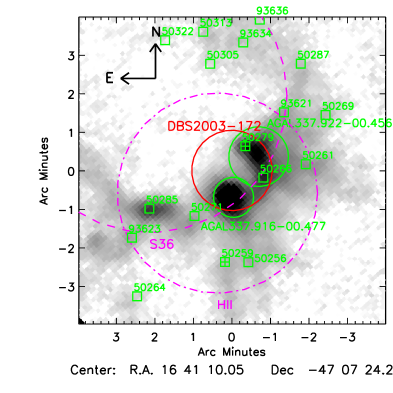
DBS2003-172 appears to be the probable source of ionizing radiation for GRS G337.9200.48, a Hii region of (Culverhouse et al. 2011), as shown in Fig. 1. This Hii region coincides with the bulk of 8 m emission from the bubble S36 (Churchwell et al. 2006). In the direction of this Hii region, Huang et al. (1999) measured three CO clouds at Vlsr ,, and km s-1, respectively, which yield near-kinematic distances of 3.9, 3.0, 2.7 kpc (or far-kinematic distances of 11.7, 12.5, and 12.9 kpc; Reid et al. 2009). The km s-1 cloud is far stronger than the other two clouds. Walsh et al. (1998) detected a site of active star formation with three methanol masers, whose velocities ( Vlsr= , , and km s-1) indicate an association with the CO cloud at km s-1. We thus assume a Vlsr= km s-1 and a kinematic distance of 3.0 kpc (near), or 12.5 kpc (far), for DBS2003-172. We assume the near distance.
Considering the whole Hii region, the radio flux densities measured at 100 GHz and at 150 GHz of GRS G337.92-00.48 (Culverhouse et al. 2011) are Jy and Jy, and Caswell & Haynes (1987) report Jy at 5 GHz. Assuming thermal emission and a temperature of 10,000 K (5600 K) and using the formula by Martín-Hernández et al. (2003a), we computed log10(Nlyc)=48.74 (48.85), 48.93 (49.05), and 49.05 (49.17) photons s-1 with the 5 GHz, 100 GHz, and 150 GHz flux densities respectively. This is equivalent to the log10(Nlyc) emitted by a single O9-B0 supergiant, or by a dozen B0 dwarfs (Panagia 1973).
The submillimeter emission detected by ATLASGAL nicely follows the mid-infrared bubble. Seven prestellar and 10 protostellar compact ( pc) clumps identified with Hi-GAL by Elia et al. (2017) are in the direction of this bubble. Their 870 m fluxes range from 0.0 to 8.21 Jy (Elia et al. 2017). Temperatures were estimated by fitting a grey blackbody and range from 10.96 to 31.13 K. Assuming a common distance of 3.0 kpc, rescaled masses range from 50 to 3500 M⊙, with two clumps above 1000 M⊙.
Elia et al. provide distances of about 3 kpc for 12 out of 17 clumps (see the Appendix). The just-released catalog of highly reliable velocities of ATLASGAL clumps (Urquhart et al. 2018) proposes close kinematic distances for seven Hi-GAL clumps (Vlsr from 37.6 to 40.0 km s-1) and only the clumps 50264, 50313, and 50322 remain at the far distance. However, by looking at the bubble morphology and filaments, it appears possible to us that they are all associated with bubble S36.
In the ATLASGAL map, the candidate stellar cluster DBS2003-172 lies between two extended ATLASGAL clumps (AGAL 337.91600.477 and AGAL 337.92200.456) of 74.83 and 86.41 Jy, respectively (Urquhart et al. 2014). For a distance of 3.0 kpc, their angular sizes ( and ) correspond to and pc2. AGAL 337.91600.477 is one of the mid-IR bright sources studied by König et al. (2017), a high-mass protostar with a temperature of K and a mass of 1100 M⊙ (for 3.0 kpc). With a velocity of km s-1, AGAL is associated with GRS G337.9200.48 (S36) (Giannetti et al. 2014; Urquhart et al. 2018). The other extended clump AGAL337.92200.456 breaks into two different Hi-GAL sources listed by Elia et al. (#50279 and #50266). AGAL337.92200.456 is given at the far distance by Urquhart et al. (Vlsr= km s-1, 2014, 2018), but at the close distance by Kim et al. (2017); Vlsr= km s-1. The stellar cluster location and symmetry of the molecular structure around it suggest close distance.
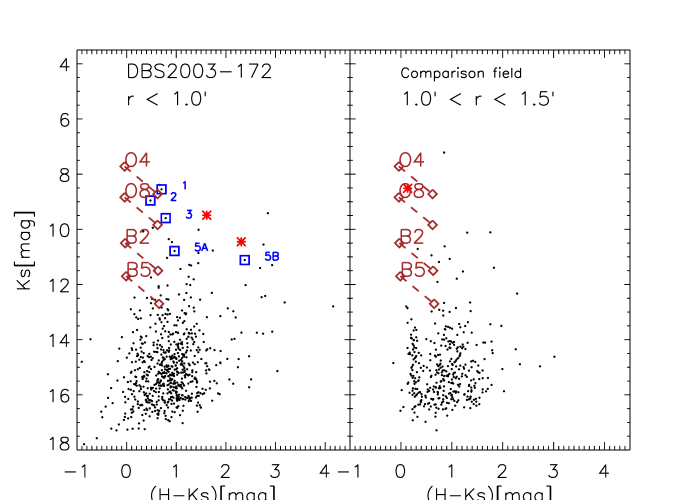
4.3.1 Massive stars in DBS2003-172
Six stars were spectroscopically detected as probable early types. Five spectra present only Brγ in absorption, which does not allow for a precise classification. Their parameters, which combine Ks and Ks colors, are consistent with those of early-type stars (see Table 9, and Messineo et al. 2012). Indeed, in the Ks versus Ks diagram in Fig. 7, a small overdensity of stars is found in the range 8 mag Ks 11 mag. Stars #1, #2, #3, and #4 yield an average A=1.0 mag with mag and are likely to be members of the star forming region. Spectral types have not been assigned, since the spectra have poor signal-to-noise ratio and only Brγ is detected. With Ks from 8.55 to 9.98 mag and with detected Brγ in absorption, which is the strongest absorption line in the spectrum of O-type stars, stars #1, #2, and #4 have photometry consistent with those of O-type stars. Star #3 (A=1.1 mag) has a strong Brγ line in emission and Ks colors consistent with those reddened by interstellar extinction. Assuming a young dwarf, we estimate an O7-O8 type, which would be enough to make star #3 alone the main contributor to the total Nlyc necessary to excite this Hii region (see previous subsection). Star # 6 is foreground to the star-forming complex (A=0.37 mag). Four other possible O-type stars remain unobserved (as shown in the color-color plot of Fig. 7).
Stars #5A and #5B are part of the star forming complex DBS2003-172, as deduced by their colors and morphological interaction with the ISM. In VVV Ks images, a comet-shaped nebula is seen to surround them. With A of 1.9 and 3.6 mag, stars #5A and #5B are likely embedded in the nebula. The infrared nebula coincides with an ultracompact Hii region at RA=16h41m08.0s and Dec=47d06m46s, detected by Walsh et al. (1998). The spectra of DBS2003-172-5 (A and B) display stellar and circumstellar He I and Brγ (see Fig. 3). Owing to the presence of strong He I and Brγ lines, they resemble typical spectra of ultracompact (UC) Hii regions (e.g. Doherty et al. 1994) and of Hii regions associated with evolved massive stars: in particular, IRS13, the remains of a stellar cluster close to the Galactic center, and the M1-78 nebula, which also have [FeIII] at 2.2178 m (Blum et al. 1995; Eckart et al. 2013; Martín-Hernández et al. 2008). Detections of [FeIII] emission lines at 2.2178 m have also been reported in the direction of planetary nebulae, but together with several H 2 lines (Likkel et al. 2004). The ratio of the flux densities of the He I and Brγ lines indicates stars hotter than an O7 star (e.g. Doherty et al. 1994). When this ratio is above unity and the star is a supergiant, it is typically a transitional object (e.g., Ofpe/WN9 stars and LBVs) or a WR star (e.g. Blum et al. 1995; Najarro et al. 1997; Messineo et al. 2009; Morris et al. 1996). The IRS13 E2 component (the brightest IR component of the IRS13 cluster) is a WN8 (Martins et al. 2007). The M1-78 nebula is most probably a combination of a Hii region and the ejecta from a central massive evolved star (O+WR) (Martín-Hernández et al. 2008). The UC radio source (IRAS 163744701) detected at the location of stars #5A and #5B by Walsh et al. (1998) has flux densities of 452 mJy and 396 mJy at 8.64 GHz and 6.67 GHz (VIZIER), respectively. For a optically thin thermal nebula at 10,000 K and 3 kpc distant, we estimated log10(Nlyc)=47.3 photons s-1, using the formula in Martín-Hernández et al. (2003b). A star of O7 type or earlier produces log10(N photons s-1 for a dwarf class and photons s-1 for a supergiant class. On the other hand, if we could use the same formula for ten known WR stars with available radio continuum measurements (Leitherer et al. 1997), we would obtain an average log10(N photons s-1. Assuming a distance of 3.0 kpc and a BCK of mag (typical of O7-O8 stars, hotter stars have a larger correction), with the A values listed in Tables 7 and 9, we inferred luminosities of 5.03 and 5.57 log(). These values are consistent with those of evolved supergiants (see, for example, Hamann et al. 2006; Martins et al. 2007).
5. Bubbles and exciting stars
We emphasize that our main goal is to put at the disposal of the astronomical community ionizing stars detected in the studied Hii regions. These spectroscopically observed stars are precious benchmarks for stellar population studies. In this section we comment on the relation of the identified stars with their surrounding bubbles.
Bubbles are prototype laboratories of current triggers and sequential star formation. Given a molecular cloud and the first massive star forming within it, a Hii region forms and expands, creating a layer of compressed matter at its border, where molecular clumps condense, collapse, and interact. Bubbles are very common: about have already been identified, covering approximately 10% of the inner Galactic plane (Simpson et al. 2012). There is ionized gas in about 90% of the bubbles studied by Churchwell et al. (2009) and Deharveng et al. (2010), but only 13% of them have been associated with stellar clusters. In the larger sample (1814) analyzed by Bufano et al. (2018), 60% of bubbles are associated with Hii regions excited by young O, B stars, 2% by blue supergiants, and about 38% are still of unknown origin. The underlying problem with classifying bubbles is the difficulty of detecting isolated massive stars and even stellar clusters. A cluster is defined as an overdensity of stars that are likely to be physically close and of similar age; see, for example, MCM2005b77 (see Sect. 4.2). For details on detection algorithms and associated problematics, we remind the reader of the summary by Schmeja (2011). However, lists of candidate clusters from different surveys provide several clusters with different sizes and centroids for the same bubble. These candidate clusters must be discussed in the context of the bubble morphology and extinction pattern, with reference to benchmark stars.
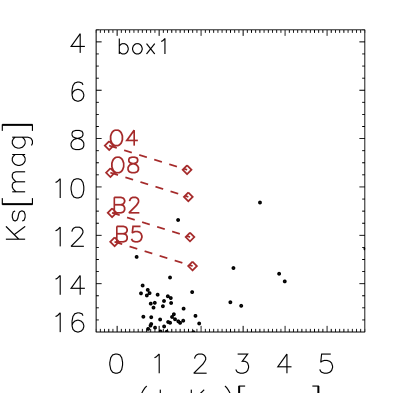
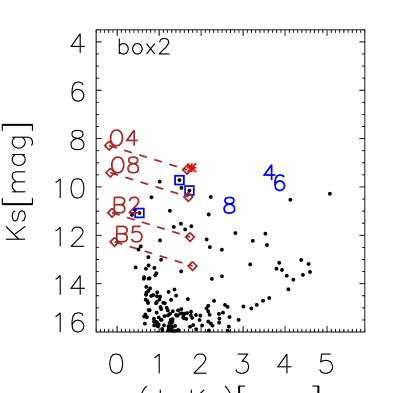
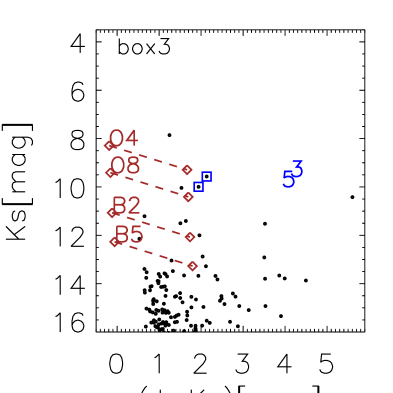
The bubbles S36 and S62 were selected because they are Hii regions with candidate stellar clusters where the brightest stars have Ks from 6 to 11 mag, suitable for a 4 m class telescope. The case of S62 is an exemplary one: S62 hosts several candidate clusters, which were identified with different datasets and methods (see Sect. 4.1). The bubble has a diameter of about 8 pc at 3.9 kpc. MCM2005b72 is a clump of bright stars (e.g., stars #4, #6, and #8) at mid- and near-infrared wavelengths, with a diameter of 72′′ (1.3 pc at 3.9 kpc), detected with an automated algorithm. DBS2003-172 has a diameter of 126′′ (2.3 pc at 3.9 kpc) and was visually detected and centered on an arc of a bright 8 m knot of S62. Cl063 is a bright 8 m nebula located on the border of the bubble S62 and it coincides with the ATLASGAL clump AGALG331.38730.360 (Hi-GAL 46282). We tried to redetect groups of bright GLIMPSE stars in S62 with the minimum spanning tree (MST) algorithm. The resulting maps depend on the chosen cutoff distance and on the sample stars analyzed, but have the advantage of being independent of centroids (e.g., Wright et al. 2014). When considering stars bright in Ks ( mag) and [3.6] mag, i.e. OB stars at 3.9 kpc, one can nicely reproduce the detection of MCM2005b72 with a cutoff distance from 20′′ to 40′′ (0.4-0.8 pc at 3.9 kpc). A tree also appears at the location of the massive stars #3 and #5 (see Fig. 8). CMDs of stars detected by 2MASS and GLIMPSE in selected areas of Fig. 8 are shown in Fig. 9. MCM2005b72 (box2) is located in the center of the bubble, so it may contain massive stars from the first generation of star formation, such as stars #4 and #6 (late-O-type dwarfs, A=0.8 and 0.9 mag, MK=4.2 and 3.9 mag). In box3, star #5 has similar properties – an O9-B type (A=1.1, MK=4.1 mag). Star #3 is the main ionizing star since it is a massive O4-6 (A=1.3 mag), of about 40 M⊙ and an age of 5-7 Myr (Ekström et al. 2012).
In conclusion, naked OB stars are not concentrated, as one would expect for a mass-segregated population, but are detected inside the bubble in two groups; while condensing molecular clumps are currently located on the shell surrounding the bubble. In the direction of Cl63 (AGALG331.38730.360), which is on the shell, we detected another early-type, star #7, which is likely to be contributing to the heating of the protostar AGALG331.38730.360. These findings are in line with the current literature. Indeed, bound stellar clusters are a rarity and in more than 90% of the cases (infant mortality and cluster dissolution), we expect associations of massive stars. For example, the massive association Cygnus OB2 (about 7 pc in diameter) is at least 5-7 Myrs old, is not associated with gas, and is made of discrete clumps of stars (1-2 pc in size, Wright et al. 2014, 2016). The authors conclude that Cygnus OB2 originated with discrete clumps, and there is no trace of dynamical evolution (e.g. mass segregation). Similar evidence is provided for the younger W33 complex by Messineo et al. (2015), 5 pc in diameter, which is made up of several condensing molecular clumps and has sparsely distributed exciting stars (2-4 Myr).
| ID | Sp | Mbol | log() | ||||||
|---|---|---|---|---|---|---|---|---|---|
| [mag] | [mag] | [mag] | [mag] | [mag] | [mag] | [] | |||
| G331.340.36 2 | B05 | 0.55 0.03 | 8.34 0.04 | 4.64 0.31 | 3.12 0.66 | 12.98 0.31 | 7.76 0.73 | 5.00 | |
| G331.340.36 3 | O46 | 1.32 0.03 | 8.25 0.04 | 4.72 0.31 | 4.55 0.15 | 12.98 0.31 | 9.27 0.35 | 5.61 | |
| G331.340.36 5 | O9B0 | 1.10 0.02 | 8.90 0.04 | 4.08 0.31 | 3.85 0.13 | 12.98 0.31 | 7.93 0.34 | 5.07 | |
| G331.340.36 6 | B03 | 0.96 0.04 | 9.19 0.05 | 3.79 0.31 | 3.12 0.66 | 12.98 0.31 | 6.91 0.73 | 4.66 | |
| MCM2005b77 1 | B03 | 0.84 0.03 | 5.65 0.04 | 7.95 0.17 | 2.50 0.80 | 13.60 0.17 | 10.45 0.82 | 6.08 | |
| MCM2005b77 3 | B05 | 1.14 0.03 | 7.08 0.04 | 6.52 0.17 | 2.12 1.17 | 13.60 0.17 | 8.64 1.18 | 5.35 | |
| MCM2005b77 4 | B03 | 0.79 0.03 | 7.62 0.04 | 5.98 0.17 | 2.50 0.80 | 13.60 0.17 | 8.48 0.82 | 5.29 | |
| MCM2005b77 5 | B03 | 0.79 0.03 | 7.81 0.04 | 5.79 0.17 | 2.50 0.80 | 13.60 0.17 | 8.29 0.82 | 5.21 | |
| MCM2005b77 6 | B05 | 0.98 0.03 | 7.73 0.04 | 5.87 0.17 | 2.12 1.17 | 13.60 0.17 | 7.99 1.18 | 5.09 | |
| MCM2005b77 7 | B05 | 0.89 0.03 | 8.10 0.03 | 5.50 0.17 | 2.12 1.17 | 13.60 0.17 | 7.62 1.18 | 4.94 | |
| MCM2005b77 8 | B05 | 0.75 0.03 | 8.55 0.04 | 5.05 0.17 | 2.12 1.17 | 13.60 0.17 | 7.17 1.18 | 4.76 | |
| MCM2005b77 9 | B05 | 0.80 0.04 | 8.63 0.06 | 4.97 0.18 | 2.12 1.17 | 13.60 0.17 | 7.09 1.18 | 4.73 | |
| MCM2005b77 10 | B05 | 0.87 0.03 | 9.26 0.04 | 4.35 0.17 | 2.12 1.17 | 13.60 0.17 | 6.47 1.18 | 4.48 | |
| MCM2005b77 11 | B05 | 0.96 0.05 | 9.32 0.80 | 4.28 0.82 | 2.12 1.17 | 13.60 0.17 | 6.40 1.43 | 4.46 | |
| MCM2005b77 12 | OB | 1.70 0.03 | 9.26 0.04 | 4.34 0.17 | 2.87 1.21 | 13.60 0.17 | 7.21 1.22 | 4.78 | |
| DBS2003-172 3 | OB | 1.05 0.03 | 8.55 0.04 | 3.87 0.50 | 3.27 0.86 | 12.41 0.50 | 7.14 1.00 | 4.75 | |
| DBS2003-172 5A | OB | 1.90 0.02 | 8.89 0.04 | 3.53 0.50 | 4.30 1.00 | 12.41 0.50 | 7.83 1.12 | 5.03 | |
| DBS2003-172 5B | OB | 3.58 0.28 | 7.54 0.31 | 4.87 0.59 | 4.30 1.00 | 12.41 0.50 | 9.17 1.16 | 5.57 |
6. Summary
We performed a spectroscopic survey of bright infrared stars in the direction of GRS G331.3400.36 (S62), GRS G337.9200.48 (S36), and MCM2005b77, and for the first time we detected massive members in these regions.
-
a
A total number of 27 early-type and 32 late-type stars were detected.
-
b
We confirm one O4-6 star and one B0-5 star as the main sources of ionizing radiation of GRS G331.3400.36 (S62), at a kinematic distance of kpc. The stars have A of 1.3 mag and 1.0 mag. With Nlyc=49 photons s-1, the massive O4-6 star can alone account for most of the energy needed to maintain this Hii region.
-
c
In GRS G337.92-00.48 (S36), at the distance of about 3.0 kpc, we detected four photometric O-type stars at A=1.0 mag and two massive emission line stars surrounded by a nebula. The newly discovered massive stars can account for the bulk of radio continuum emitted by this Hii region.
-
d
We detected a cluster of B-type stars at the location of MCM2005b77. The cluster has an average A= mag and a spectrophotometric distance modulus of mag that agrees with the kinematic distance of the adjacent Hii IRAS 161375025. We inferred an age of 8 Myr and a mass of about 3000 M⊙.
-
e
Star formation is currently ongoing in these bubbles, with new condensations detected by ATLASGAL with masses from 30 to 3500 M⊙.
Appendix A Charts of the targets
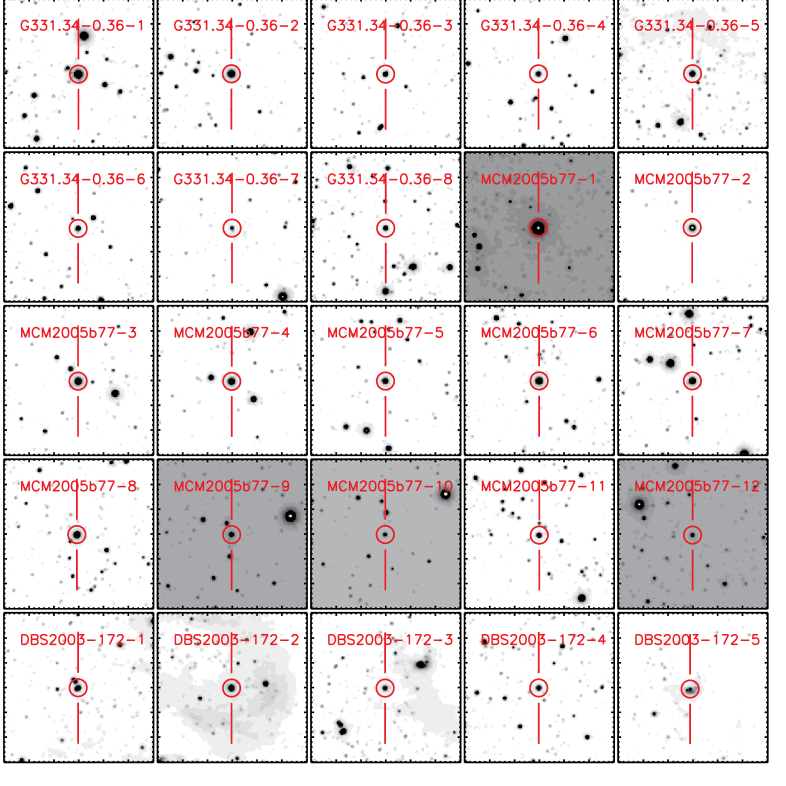
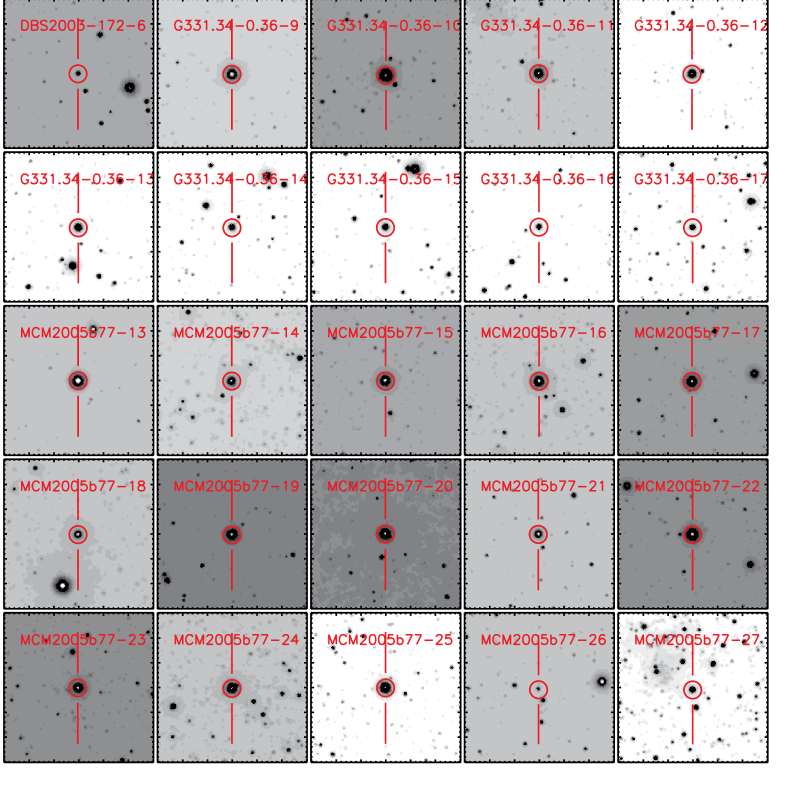
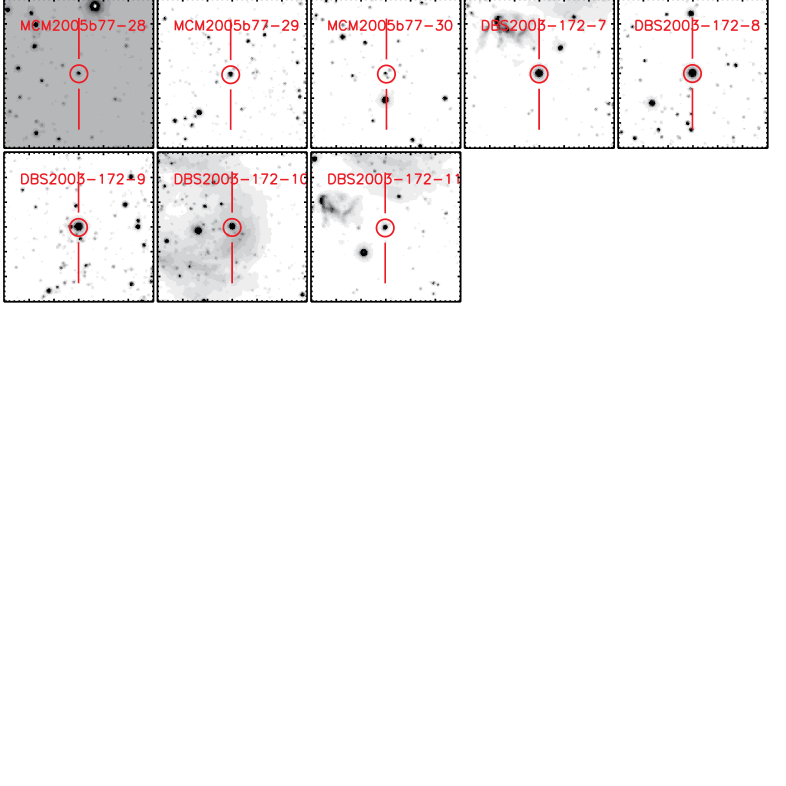
In Figure 10, Ks charts from the VVV survey are shown for the detected stars. Charts are aligned with the Celestial axis: north is up, and east is to the left. Each chart has a field of view of ′′.


Appendix B List of molecular clumps associated with the studied Hii regions
In Table 10 we list the parameters of Hi-GAL clumps in the direction of the studied Hii regions. Mid-infrared sources detected with the Hershel satellite were matched with the ATLASGAL point sources to identify protostar and prestellar objects by Elia et al. (2017). Elia et al. (2017) estimate distances with available 12CO and 13CO observations and the Galactic rotation curve.
Highly reliable radial velocities of ATLASGAL clumps are now available from line observations of C18O(2-1), C17O(3-2), NH3, and CS (Urquhart et al. 2018). Distances have been revised with the catalog of radial velocities by Urquhart et al. (2018), and masses rescaled to the adopted distances.
| Hii | ID | Tempa | EVb | CONDc | Massa | Distd | Vlsre | sepf | af | D(Urq)d | D(Elia)d |
|---|---|---|---|---|---|---|---|---|---|---|---|
| [K] | [M⊙] | [kpc] | [km s-1] | [′′] | [′′] | [kpc] | [kpc] | ||||
| S62 | 46184 | 11.20 | 1 | 1 | 9592 | 10.64 | 10.64 | ||||
| S62 | 46196 | 20.03 | 2 | 1 | 105 | 3.94 | 65.50 | 13.53 | 16.00 | 4.00 | 10.64 |
| S62 | 46198 | 23.26 | 2 | 1 | 76 | 3.94 | 65.30 | 8.79 | 11.00 | 4.00 | 10.64 |
| S62 | 46204 | 11.86 | 2 | 1 | 668 | 3.94 | 66.40 | 11.04 | 16.00 | 4.00 | 10.64 |
| S62 | 46210 | 28.58 | 2 | 1 | 30 | 3.94 | 4.22 | ||||
| S62 | 46219 | 15.83 | 2 | 1 | 569 | 3.94 | 66.00 | 9.19 | 39.00 | 4.00 | 4.22 |
| S62 | 46225 | 16.42 | 2 | 1 | 350 | 3.94 | 65.90 | 25.77 | 32.00 | 4.00 | 10.64 |
| S62 | 46235 | 16.65 | 2 | 1 | 146 | 3.94 | 4.22 | ||||
| S62 | 46238 | 22.89 | 2 | 1 | 529 | 3.94 | 65.50 | 0.45 | 30.00 | 4.00 | 4.22 |
| S62 | 46239 | 15.59 | 1 | 1 | 272 | 3.94 | 65.00 | 11.79 | 21.00 | 3.90 | 10.64 |
| S62 | 46246 | 27.87 | 2 | 0 | 76 | 3.94 | 4.22 | ||||
| S62 | 46248 | 13.34 | 2 | 1 | 376 | 3.94 | 4.22 | ||||
| S62 | 46272 | 10.84 | 2 | 1 | 2342 | 5.80 | 97.30 | 12.12 | 22.00 | 5.80 | 4.22 |
| S62 | 46282 | 30.19 | 2 | 1 | 158 | 3.94 | 65.60 | 7.63 | 16.00 | 4.00 | 4.22 |
| S62 | 91379 | 13.69 | 1 | 1 | 176 | 3.94 | 4.22 | ||||
| S62 | 91393 | 15.83 | 1 | 1 | 201 | 3.94 | 4.22 | ||||
| IRAS 161375025 | 47117 | 20.39 | 2 | 1 | 582 | 5.20 | 95.60 | 4.15 | 21.00 | 5.60 | 10.96 |
| IRAS 161375025 | 47118 | 12.09 | 2 | 1 | 1167 | 5.20 | 95.30 | 9.87 | 18.00 | 5.60 | 3.84 |
| IRAS 161375025 | 47127 | 15.11 | 2 | 1 | 1488 | 5.20 | 95.00 | 8.85 | 16.00 | 5.60 | 3.84 |
| IRAS 161375025 | 47129 | 14.05 | 2 | 1 | 520 | 5.20 | 94.80 | 6.29 | 20.00 | 5.60 | 3.84 |
| S36 | 50256 | 14.52 | 1 | 1 | 309 | 3.04 | 40.00 | 6.25 | 38.00 | 3.00 | 3.30 |
| S36 | 50259 | 10.96 | 2 | 1 | 3553 | 3.04 | 40.00 | 32.84 | 38.00 | 3.00 | 3.30 |
| S36 | 50261 | 30.90 | 2 | 1 | 73 | 3.04 | 3.13 | ||||
| S36 | 50264 | 11.31 | 1 | 1 | 5925 | 12.68 | 12.68 | ||||
| S36 | 50266∗ | 31.13 | 2 | 1 | 3394 | 12.60? | 38.70 | 33.56 | 45.00 | 12.60 | 3.13 |
| S36 | 50269 | 13.63 | 1 | 1 | 327 | 3.04 | 39.50 | 53.48 | 93.00 | 2.90 | 3.57 |
| S36 | 50271 | 18.91 | 2 | 1 | 350 | 3.04 | 3.13 | ||||
| S36 | 50279∗ | 23.83 | 2 | 1 | 19733 | 12.60? | 38.70 | 26.32 | 45.00 | 12.60 | 3.13 |
| S36 | 50285 | 17.25 | 2 | 1 | 846 | 3.04 | 38.00 | 2.91 | 39.00 | 2.80 | 12.68 |
| S36 | 50287 | 15.83 | 2 | 0 | 122 | 3.04 | 39.50 | 71.62 | 93.00 | 2.90 | 3.57 |
| S36 | 50305 | 17.43 | 2 | 1 | 50 | 3.04 | 3.13 | ||||
| S36 | 50313 | 15.88 | 2 | 1 | 3087 | 12.93 | 12.93 | ||||
| S36 | 50322 | 13.16 | 2 | 1 | 3930 | 12.93 | 12.93 | ||||
| S36 | 93621 | 18.26 | 1 | 1 | 84 | 3.04 | 39.50 | 13.31 | 93.00 | 2.90 | 3.13 |
| S36 | 93623 | 18.20 | 1 | 1 | 137 | 3.04 | 37.60 | 6.72 | 12.00 | 2.80 | 12.68 |
| S36 | 93634 | 17.96 | 1 | 1 | 61 | 3.04 | 3.57 | ||||
| S36 | 93636 | 13.58 | 1 | 1 | 106 | 3.04 | 3.57 |
-
Notes: Temperatures (Temp) and masses (Mass) are taken from Elia et al. (2017); masses are rescaled to the assumed distances.
EV=1 (prestellar) and EV=2 (protostellar), as in Elia et al. (2017).
COND=1 if(mass ). The clump is likely collapsing (König et al. 2017).
Dist= assumed distance ; D(Urq)= distance assumed in the work of Urquhart et al. (2018); D(Elia)=distances from the work of Elia et al. (2017).
Vlsr data are taken from Urquhart et al. (2018).
Distance (sep) to the ATLASGAL clump centroid by Urquhart et al. (2018); the clump has a semi major axis = a.
Kim et al. (2017) argue for a close distance based on the radio-recombination line, Vlsr= km s-1.
References
- Benjamin et al. (2003) Benjamin, R. A., Churchwell, E., Babler, B. L., et al. 2003, PASP, 115, 953
- Bertoldi & McKee (1992) Bertoldi, F. & McKee, C. F. 1992, ApJ, 395, 140
- Bibby et al. (2008) Bibby, J. L., Crowther, P. A., Furness, J. P., & Clark, J. S. 2008, MNRAS, 386, L23
- Blum et al. (1995) Blum, R. D., Depoy, D. L., & Sellgren, K. 1995, ApJ, 441, 603
- Blum et al. (2003) Blum, R. D., Ramírez, S. V., Sellgren, K., & Olsen, K. 2003, ApJ, 597, 323
- Borissova et al. (2011) Borissova, J., Bonatto, C., Kurtev, R., et al. 2011, A&A, 532, A131
- Borissova et al. (2006) Borissova, J., Ivanov, V. D., Minniti, D., & Geisler, D. 2006, A&A, 455, 923
- Borissova et al. (2005) Borissova, J., Ivanov, V. D., Minniti, D., Geisler, D., & Stephens, A. W. 2005, A&A, 435, 95
- Bronfman et al. (1996) Bronfman, L., Nyman, L.-A., & May, J. 1996, A&AS, 115, 81
- Bufano et al. (2018) Bufano, F., Leto, P., Carey, D., et al. 2018, MNRAS, 473, 3671
- Camargo et al. (2012) Camargo, D., Bonatto, C., & Bica, E. 2012, MNRAS, 423, 1940
- Caswell & Haynes (1987) Caswell, J. L. & Haynes, R. F. 1987, A&A, 171, 261
- Churchwell et al. (2009) Churchwell, E., Babler, B. L., Meade, M. R., et al. 2009, PASP, 121, 213
- Churchwell et al. (2006) Churchwell, E., Povich, M. S., Allen, D., et al. 2006, ApJ, 649, 759
- Culverhouse et al. (2011) Culverhouse, T., Ade, P., Bock, J., et al. 2011, ApJS, 195, 8
- Davies et al. (2012) Davies, B., Clark, J. S., Trombley, C., et al. 2012, MNRAS, 419, 1871
- Deharveng et al. (2010) Deharveng, L., Schuller, F., Anderson, L. D., et al. 2010, A&A, 523, A6
- Doherty et al. (1994) Doherty, R. M., Puxley, P., Doyon, R., & Brand, P. W. J. L. 1994, MNRAS, 266, 497
- Drimmel et al. (2003) Drimmel, R., Cabrera-Lavers, A., & López-Corredoira, M. 2003, A&A, 409, 205
- Dutra & Bica (2001) Dutra, C. M. & Bica, E. 2001, A&A, 376, 434
- Dutra et al. (2003) Dutra, C. M., Bica, E., Soares, J., & Barbuy, B. 2003, A&A, 400, 533
- Eckart et al. (2013) Eckart, A., Mužić, K., Yazici, S., et al. 2013, A&A, 551, A18
- Egan et al. (2003) Egan, M. P., Price, S. D., & Kraemer, K. E. 2003, in Bulletin of the American Astronomical Society, Vol. 35, American Astronomical Society Meeting Abstracts, 1301
- Ekström et al. (2012) Ekström, S., Georgy, C., Eggenberger, P., et al. 2012, A&A, 537, A146
- Elia et al. (2017) Elia, D., Molinari, S., Schisano, E., et al. 2017, MNRAS, 471, 100
- Epchtein et al. (1999) Epchtein, N., Deul, E., Derriere, S., et al. 1999, A&A, 349, 236
- Figer et al. (2006) Figer, D. F., MacKenty, J. W., Robberto, M., et al. 2006, ApJ, 643, 1166
- Froebrich et al. (2007) Froebrich, D., Scholz, A., & Raftery, C. L. 2007, MNRAS, 374, 399
- Gaia Collaboration (2018) Gaia Collaboration. 2018, A&A, 1804.09365
- Geballe et al. (2000) Geballe, T. R., Najarro, F., & Figer, D. F. 2000, ApJ, 530, L97
- Georgelin & Georgelin (1976) Georgelin, Y. M. & Georgelin, Y. P. 1976, A&A, 49, 57
- Giannetti et al. (2014) Giannetti, A., Wyrowski, F., Brand, J., et al. 2014, A&A, 570, A65
- Glushkova et al. (2010) Glushkova, E. V., Koposov, S. E., Zolotukhin, I. Y., et al. 2010, Astronomy Letters, 36, 75
- Gonzalez et al. (2012) Gonzalez, O. A., Rejkuba, M., Zoccali, M., et al. 2012, A&A, 543, A13
- Hamann et al. (2006) Hamann, W.-R., Gräfener, G., & Liermann, A. 2006, A&A, 457, 1015
- Hanson et al. (1996) Hanson, M. M., Conti, P. S., & Rieke, M. J. 1996, ApJS, 107, 281
- Hanson et al. (2005) Hanson, M. M., Kudritzki, R.-P., Kenworthy, M. A., Puls, J., & Tokunaga, A. T. 2005, ApJS, 161, 154
- Heyer et al. (2016) Heyer, M., Gutermuth, R., Urquhart, J. S., et al. 2016, A&A, 588, A29
- Huang et al. (1999) Huang, M., Bania, T. M., Bolatto, A., et al. 1999, ApJ, 517, 282
- Kim et al. (2017) Kim, W.-J., Wyrowski, F., Urquhart, J. S., Menten, K. M., & Csengeri, T. 2017, A&A, 602, A37
- Kleinmann & Hall (1986) Kleinmann, S. G. & Hall, D. N. B. 1986, ApJS, 62, 501
- König et al. (2017) König, C., Urquhart, J. S., Csengeri, T., et al. 2017, A&A, 599, A139
- Koornneef (1983) Koornneef, J. 1983, A&A, 128, 84
- Kuchar & Clark (1997) Kuchar, T. A. & Clark, F. O. 1997, ApJ, 488, 224
- Leitherer et al. (1997) Leitherer, C., Chapman, J. M., & Koribalski, B. 1997, ApJ, 481, 898
- Likkel et al. (2004) Likkel, L., Dinerstein, H. L., Lester, D., Bruch, J., & Bartig, K. 2004, in Astronomical Society of the Pacific Conference Series, Vol. 313, Asymmetrical Planetary Nebulae III: Winds, Structure and the Thunderbird, ed. M. Meixner, J. H. Kastner, B. Balick, & N. Soker, 351
- Martín-Hernández et al. (2008) Martín-Hernández, N. L., Esteban, C., Mesa-Delgado, A., Bik, A., & Puga, E. 2008, A&A, 482, 215
- Martín-Hernández et al. (2003a) Martín-Hernández, N. L., van der Hulst, J. M., & Tielens, A. G. G. M. 2003a, A&A, 407, 957
- Martín-Hernández et al. (2003b) Martín-Hernández, N. L., van der Hulst, J. M., & Tielens, A. G. G. M. 2003b, A&A, 407, 957
- Martins et al. (2007) Martins, F., Genzel, R., Hillier, D. J., et al. 2007, A&A, 468, 233
- Martins & Plez (2006) Martins, F. & Plez, B. 2006, A&A, 457, 637
- Martins et al. (2005) Martins, F., Schaerer, D., & Hillier, D. J. 2005, A&A, 436, 1049
- Mercer et al. (2005) Mercer, E. P., Clemens, D. P., Meade, M. R., et al. 2005, ApJ, 635, 560
- Messineo et al. (2015) Messineo, M., Clark, J. S., Figer, D. F., et al. 2015, ApJ, 805, 110
- Messineo et al. (2011) Messineo, M., Davies, B., Figer, D. F., et al. 2011, ApJ, 733, 41
- Messineo et al. (2009) Messineo, M., Davies, B., Ivanov, V. D., et al. 2009, ApJ, 697, 701
- Messineo et al. (2010) Messineo, M., Figer, D. F., Davies, B., et al. 2010, ApJ, 708, 1241
- Messineo et al. (2005) Messineo, M., Habing, H. J., Menten, K. M., et al. 2005, A&A, 435, 575
- Messineo et al. (2012) Messineo, M., Menten, K. M., Churchwell, E., & Habing, H. 2012, A&A, 537, A10
- Messineo et al. (2014a) Messineo, M., Menten, K. M., Figer, D. F., et al. 2014a, A&A, 569, A20
- Messineo et al. (2014b) Messineo, M., Zhu, Q., Ivanov, V. D., et al. 2014b, A&A, 571, A43
- Messineo et al. (2017) Messineo, M., Zhu, Q., Menten, K. M., et al. 2017, ApJ, 836, 65
- Morris et al. (1996) Morris, P. W., Eenens, P. R. J., Hanson, M. M., Conti, P. S., & Blum, R. D. 1996, ApJ, 470, 597
- Nahar & Pradhan (1996) Nahar, S. N. & Pradhan, A. K. 1996, A&AS, 119, 509
- Najarro et al. (1997) Najarro, F., Krabbe, A., Genzel, R., et al. 1997, A&A, 325, 700
- Panagia (1973) Panagia, N. 1973, AJ, 78, 929
- Pinheiro et al. (2012) Pinheiro, M. C., Abraham, Z., Copetti, M. V. F., et al. 2012, MNRAS, 423, 2425
- Povich et al. (2008) Povich, M. S., Benjamin, R. A., Whitney, B. A., et al. 2008, ApJ, 689, 242
- Price et al. (2001) Price, S. D., Egan, M. P., Carey, S. J., Mizuno, D. R., & Kuchar, T. A. 2001, AJ, 121, 2819
- Ramírez et al. (2000) Ramírez, S. V., Stephens, A. W., Frogel, J. A., & DePoy, D. L. 2000, AJ, 120, 833
- Reid et al. (2009) Reid, M. J., Menten, K. M., Zheng, X. W., et al. 2009, ApJ, 700, 137
- Richards et al. (2012) Richards, E. E., Lang, C. C., Trombley, C., & Figer, D. F. 2012, AJ, 144, 89
- Robitaille et al. (2008) Robitaille, T. P., Meade, M. R., Babler, B. L., et al. 2008, AJ, 136, 2413
- Rubin (1968) Rubin, R. H. 1968, ApJ, 154, 391
- Russeil (2003) Russeil, D. 2003, A&A, 397, 133
- Schmeja (2011) Schmeja, S. 2011, Astronomische Nachrichten, 332, 172
- Schuller et al. (2009) Schuller, F., Menten, K. M., Contreras, Y., et al. 2009, A&A, 504, 415
- Sidorin et al. (2014) Sidorin, V., Douglas, K. A., Palouš, J., Wünsch, R., & Ehlerová, S. 2014, A&A, 565, A6
- Simpson et al. (2012) Simpson, R. J., Povich, M. S., Kendrew, S., et al. 2012, MNRAS, 424, 2442
- Skiff (2014) Skiff, B. A. 2014, VizieR Online Data Catalog, 1, 2023
- Skrutskie et al. (2006) Skrutskie, M. F., Cutri, R. M., Stiening, R., et al. 2006, AJ, 131, 1163
- Solin et al. (2012) Solin, O., Ukkonen, E., & Haikala, L. 2012, A&A, 542, A3
- Soto et al. (2013) Soto, M., Barbá, R., Gunthardt, G., et al. 2013, A&A, 552, A101
- Stetson (1987) Stetson, P. B. 1987, PASP, 99, 191
- Storey & Hummer (1995) Storey, P. J. & Hummer, D. G. 1995, MNRAS, 272, 41
- Tanner et al. (2006) Tanner, A., Figer, D. F., Najarro, F., et al. 2006, ApJ, 641, 891
- Urquhart et al. (2007) Urquhart, J. S., Busfield, A. L., Hoare, M. G., et al. 2007, A&A, 474, 891
- Urquhart et al. (2018) Urquhart, J. S., König, C., Giannetti, A., et al. 2018, MNRAS, 473, 1059
- Urquhart et al. (2014) Urquhart, J. S., Moore, T. J. T., Csengeri, T., et al. 2014, MNRAS, 443, 1555
- Walsh et al. (1998) Walsh, A. J., Burton, M. G., Hyland, A. R., & Robinson, G. 1998, MNRAS, 301, 640
- Wang & Jiang (2014) Wang, S. & Jiang, B. W. 2014, ApJ, 788, 12
- Watson et al. (2008) Watson, C., Povich, M. S., Churchwell, E. B., et al. 2008, ApJ, 681, 1341
- Watson et al. (2009) Watson, M. G., Schröder, A. C., Fyfe, D., et al. 2009, A&A, 493, 339
- Wienen et al. (2015) Wienen, M., Wyrowski, F., Menten, K. M., et al. 2015, A&A, 579, A91
- Wright et al. (2010) Wright, E. L., Eisenhardt, P. R. M., Mainzer, A. K., et al. 2010, AJ, 140, 1868
- Wright et al. (2016) Wright, N. J., Bouy, H., Drew, J. E., et al. 2016, MNRAS, 460, 2593
- Wright et al. (2014) Wright, N. J., Parker, R. J., Goodwin, S. P., & Drake, J. J. 2014, MNRAS, 438, 639
- Zacharias et al. (2005) Zacharias, N., Monet, D. G., Levine, S. E., et al. 2005, VizieR Online Data Catalog, 1297