Now at ]University of Science and Technology of China, Hefei, Anhui 230026, China Now at ]University of California, San Diego, CA 92093, USA
Three-dimensional particle-in-cell modeling of parametric instabilities near the quarter-critical density in plasmas
Abstract
The nonlinear regime of laser-plasma interaction including both two-plasmon–decay (TPD) and stimulated Raman scattering (SRS) instabilities has been studied in three-dimensional (3-D) particle-in-cell simulations with parameters relevant to the inertial confinement fusion (ICF) experiments. SRS and TPD develop in the same region in plasmas, and the generation of fast electrons can be described accurately with only the full model including both SRS and TPD. The growth of instabilities in the linear stage is found to be in good agreement with analytical theories. In the saturation stage the enhanced low-frequency density perturbations driven by the daughter waves of the SRS sidescattering can saturate the TPD and consequently inhibit the fast-electron generation. The fast-electron flux in 3-D modeling is up to an order of magnitude smaller than previously reported in 2-D TPD simulations, bringing it close to the results of ICF experiments.
pacs:
Since the 1960s, the pursuit of inertial confinement fusion (ICF) driven by lasers has led to large-scale research on laser interaction with the plasmas of ICF targets Craxton et al. (2015). Decades of laser–plasma interaction (LPI) research Myatt et al. (2014) have concentrated on several processes in laser-produced plasmas that can grow as parametric instabilities at high-enough laser intensities, namely stimulated Raman scattering (SRS), stimulated Brillouin scattering (SBS), and two-plasmon decay (TPD).
Laser light can propagate in a plasma up to the critical density () determined by the laser frequency. The region near quarter-critical density ( ) is a possible place for the interplay between SRS, SBS, and TPD as all three instabilities can develop at that region. plasmons produced by SRS and TPD generate fast electrons that can preheat the fusion fuel and degrade the performance of the ICF targets Craxton et al. (2015), making LPI a concern in ICF experiments. Several mechanisms of fast–electron acceleration have been studied before, namely staged acceleration Yan et al. (2009, 2012), Langmuir cavitation Vu et al. (2012a, b), and wave breaking Coffey (1971).
In this Letter, LPI is studied using particle-in-cell (PIC) modeling Dawson et al. (1983), which can describe the interplay between different instabilities and the particle distributions including fast-electron generation. Usually, few hot electrons are found in the simulations at the linear stage of the TPD and SRS instabilities. The electron acceleration becomes effective after the instabilities saturate Yan et al. (2012).
The TPD-related waves are mostly localized in the plane of polarization Simon et al. (1983), which is defined by the incident laser wave vector (in the direction) and the laser electric field vector (in the direction). The SRS sidescattering develops mostly outside of the polarization plane, and its scattered-light wave vector is almost perpendicular to the incident laser wave vector Liu et al. (1974); Afeyan and Williams (1997a). Scattered light waves can also propagate in the direction parallel or anti-parallel to the laser wave vector (forward- and backscattering, respectively) Drake and Lee (1973). A 2-D simulation in the polarization plane (–) or in the perpendicular plane (–) will be referred to as polarized (PP) or polarized (SP), respectively. Two-dimensional simulations can model only the interaction where either (in PP simulations) TPD or (in SP simulations) SRS dominates except for the high-frequency hybrid instability (HFHI) Afeyan and Williams (1997b) case when the SRS scattered light propagates in the backward direction and the SRS-related and TPD-related waves are in the same (–) plane. The 3-D simulations are required to study the interaction including both TPD and SRS. In this Letter, the results of several 3-D simulations for different plasma parameters and incident laser profiles are presented and compared with the respective 2-D simulations to illustrate that both TPD and SRS strongly influence the LPI near . In the 3-D modeling including both TPD and SRS the fast-electron flux is reduced by up to an order of magnitude compared to 2-D TPD simulation results published before Yan et al. (2012).
Here we describe in detail a 3-D simulation for the parameters relevant to ICF experiments Seka et al. (2009); Michel et al. (2013). A CH plasma is initialized with the electron temperature keV, and the temperatures for both ion species keV. The incident laser beam with intensity propagates in the direction of density inhomogeneity (). A linear density profile with the scale length is assumed at the initial time. The size of the simulation box is modeling the density range from 0.21 to 0.26 .
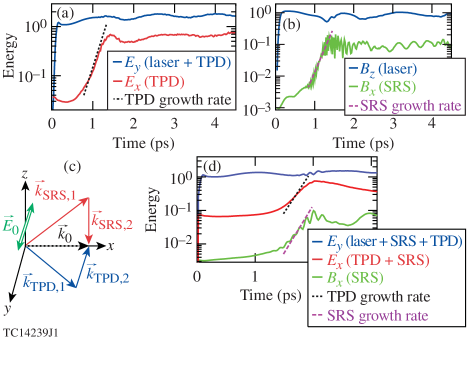
Two 2-D simulations (PP and SP) with the same physical parameters were also performed. The TPD threshold parameter Simon et al. (1983) is 1.9 ( at threshold), and the SRS backscattering threshold parameter Drake and Lee (1973) is 0.5 ( at SRS threshold) for these simulations. The SRS sidescattering threshold Liu et al. (1974); Afeyan and Williams (1997a) is close to the backscattering threshold for these parameters, and both absolute TPD and absolute SRS instabilities are expected to grow. The threshold of the convective SRS Liu et al. (1974) is not exceeded for the parameters described above. The time evolution of the energy of the field components in the simulation region is shown in Fig. 1. The field energy is defined as the square of the electric- or magnetic-field amplitudes integrated over the simulation region normalized to the respective laser field energy at early time (when there are no instabilities). In the 2-D PP simulation [Fig. 1(a)], the field contains most of the energy of the TPD plasmons with a larger wave vector. One can see that the field energy associated with the TPD instability stays at about the same level (close to 70% of the energy of the incident laser electric field) after 2.5 ps, when one can assume that the saturation stage is reached. In the 2-D SP simulation, the energy of the field [Fig. 1(b)] is used as an indicator for the level of SRS instability. The energy of the scattered light saturates at a level of about 8% of the energy of the incident laser magnetic field.
In the 3-D simulation, the diagram for TPD and SRS is shown in Fig. 1(c), where the incident light () decays into a plasmon () and a light wave () in the case of SRS and into two plasmons ( and ) in the case of TPD. The field energy [red line in Fig. 1(d)] now includes the energy of the TPD plasmons and the SRS plasmons. The red line is overlaid with the dotted black line that represents the maximum TPD growth rate Simon et al. (1983) () minus the damping rate of plasma waves () measured in the 3-D simulation. The field saturates at a level of about 40% of the laser field energy, which is much lower than the saturation level in the 2-D PP simulation. The green line in Fig. 1(d) corresponds to the energy of the scattered light wave (propagating in the direction) from the SRS and is overlaid with the dashed purple line representing the maximum growth rate of the SRS Liu et al. (1974)() minus the damping rate of the plasma waves. One can see from Fig. 1(d) that the growth of the field energy in time is in reasonable agreement with the theoretical result Liu et al. (1974). The field energy is under 10% of the incident laser field energy after reaching its peak value, which is consistent with the 2-D SP simulation result.
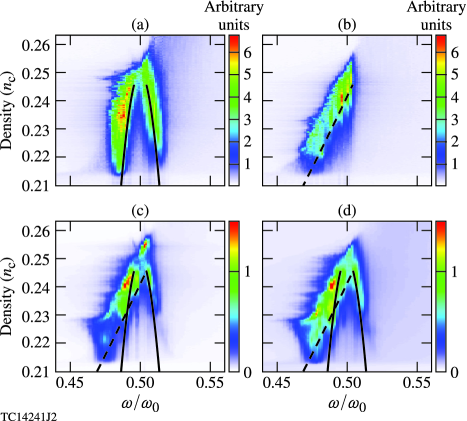
The spectra of plasma waves () obtained at a time interval between 0.3 ps and 1.0 ps in the 2-D PP and SP simulations are plotted in Figs. 2(a) and 2(b), respectively. From the 3-D simulation, the spectra of plasma waves at a time interval between 1.3 ps and 2.0 ps are plotted in Fig. 2(c) (close to plane, where TPD dominates) and in Fig. 2(d) (far away from plane, where SRS dominates). One can see from Figs. 2(c) and 2(d) that TPD and SRS co-exist near . The spectra of the unstable modes for TPD and SRS are close to the linear theory results (see overlaid lines in Fig. 2).

As the instability evolves from the linear stage to the saturation stage, the frequency spectra shown in Fig. 2 evolve into the spectra shown in Fig. 3. One can see that the spectra in all these simulations are broader in the saturation stage compared to the linear stage. The density in Fig. 3 is calculated using the initial density profile. Compared to the 2-D PP simulation [Fig. 3(a)], the TPD is much weaker at densities lower than 0.23 in the 3-D simulation [Fig. 3(c)]. The weakening of the TPD modes at these densities is also illustrated in Fig. 4(a) [and Fig. 4(b)], where the spectrum of plasma waves at densities below 0.23 in the saturation stage is integrated over (and ). There are no prominent modes along the TPD hyperbola Meyer and Zhu (1993) [black solid line in Fig. 4(a)] at , which corresponds to the TPD daughter waves with larger wave vectors. Two types of low-frequency density fluctuations are identified in our simulations [see Fig. 4(c)]. One type are the ion acoustic waves driven by the Langmuir-decay instability (LDI) DuBois and Goldman (1967); DuBois et al. (1996) and the other type are driven with the beating of the same-frequency daughter waves of SRS and TPD. The LDI modes form a broad feature at (about the laser wave vector in plasma) in the spectrum of the ion density fluctuations shown in Fig. 4(c). The beating of the SRS plasmons with wave vector creates density perturbations with wave vector . The coupling between SRS plasmons and density perturbations generates higher-order modes in the field at , [, as shown in Fig. 4(b)] and in the density perturbation at [see Fig. 4(c)].
Although SRS and TPD grow independently in the linear stage, in the nonlinear stage they interact through low-frequency density perturbations. TPD growth starts from the region near and spreads to lower densities Yan et al. (2012) before being saturated by ion density perturbations. Compared to TPD saturation in 2-D (without SRS) ion density perturbations are much larger in 3-D (with both SRS and TPD), especially near the plasma region where the frequencies of TPD and SRS plasmons are close. In this region where the dispersion lines for TPD and SRS plasmons intersect [near 0.23 in our simulations, see Fig. 3(c) and 3(d)] multiple pairs of SRS and TPD daughter waves have close frequencies and can drive ion density perturbations through the ponderomotive force to much higher levels compared to other density regions [see the black line in Fig. 4(d)]. The growth of TPD plasmons at densities below 0.23 is disrupted by these enhanced ion density perturbations, as illustrated by a decrease in the level of TPD-driven plasmons below 0.23 in Fig. 3(c).
The correlation between the local plasmon intensity and the density fluctuations is captured using the caviton correlator Vu et al. (2012a) . As shown in the lower panel of Fig. 4(d), the plasma waves and the density fluctuations are weakly correlated between 0.255 and 0.235 : in spite of a significant level of plasmons in this density range. At densities close to 0.23 , lower panel of Fig. 4(d) shows the increase not only in the plasmon intensity and density fluctuations, but also in the correlation between them with reaching up to 0.6. The large caviton correlator indicates that the plasma waves are strongest in areas where density is depleted. The ponderomotive force of multiple pairs of SRS and TPD daughter waves with close frequencies is responsible for driving the enhanced density perturbations. The nonlinear coupling of TPD and SRS through ion perturbations leads to a lower TPD saturation level in the 3-D simulation compared to the 2-D PP simulation, which is illustrated in the upper panel of Fig. 4(d).
The fast-electron flux is defined as the energy flux carried by electrons with kinetic energy above 55 keV leaving the simulation box minus the energy flux carried by the thermal electrons injected into the simulation region from the thermal boundaries (in the direction). Information about the hot electrons is collected during the saturation stage in each simulation for 0.5 ps. In the 3-D simulation, the fast-electron flux associated with the forward- and backward-going hot electrons was found to be 1.7% and 0.8%, respectively. The plasma-wave spectrum in the 3-D simulation corresponds to a smaller -space domain than the spectrum in the 2-D PP simulation, which makes the staged acceleration mechanism less efficient in 3-D than in 2-D and explains a smaller number of hot electrons in the 3-D simulation compared to the 2-D PP simulation (6.6% and 3.4% in the forward and backward direction, respectively). The influence of wave-breaking on the fast-electron generation is small as the maximal electric field amplitude (0.04 ) is below the wave-break limit(0.1 ) Coffey (1971).

The nonlinear regime including both TPD and SRS is also observed in simulations with the speckled laser beam Kato et al. (1984); Skupsky et al. (1989) and electron–ion collision effects included. The speckled laser beam is modeled by a single speckle in the simulation region that mirrors itself in the transverse direction because of the periodic boundary conditions. A series of simulations has been performed to study how the speckles affect the generation of hot electrons. All parameters are the same as the simulations described previously except for the temperatures of electrons and ions being 1.5 times higher. The peak intensities in the laser speckles are (twice of the average intensities). A collision package (CP) is available for the PIC code OSIRIS Fonseca et al. (2002). The main physics processes are observed to be the same in simulations with plane-wave beams and speckled beams.
The fast-electron flux values in simulations are listed in Table 1 for different incident laser beams as well as with CP turned on and off. By comparing the left and right columns of Table 1, one can see that adding collisions can reduce the fast-electron flux by about 50% and in the case of plane-wave 2-D PP simulation by almost 70%. Also note that the reduction of the fast-electron flux caused by collisions affects both the forward-going electrons and backward-going electrons since the collisional damping rate affects all the plasma waves. The fast-electron flux generated in the 2-D SP simulations is much smaller than the fast-electron flux generated in the 2-D PP simulations, which indicates that the plasma waves driven by TPD are the main source of the electron acceleration.
The hot electron fraction observed in the ICF experiments on the OMEGA laser system does not exceed few percent Michel et al. (2013). At the same time, in the previous PIC simulations of TPD in 2-D the hot electron fraction was close to an order of magnitude larger than in the experiments. The 3-D PIC simulations presented in this Letter for the first time produce the results for the hot electron fraction that are close to the experimental levels.
| Fast-electron flux | Forward/Backward | |
|---|---|---|
| Collision package | On | Off |
| Plane wave 2-D PP | ||
| Plane wave 2-D SP | ||
| Speckle 2-D PP | ||
| Speckle 2-D SP | ||
| Speckle 3-D | ||
laser–plasma interaction near determines the generation of fast electrons that are crucial for the performance of ICF targets. The fast-electron flux in simulations is found to be closely related to the plasma-wave spectra. The TPD-driven plasma waves with large wave vectors are very important for accelerating electrons. At the same time, the SRS-driven plasma waves are less effective in accelerating electrons. Therefore the modeling including the nonlinear coupling of TPD and SRS in 3-D is the only way to correctly describe the generation of fast electrons in laser-driven ICF.
Our 3-D PIC simulations have shown the large decrease (up to an order of magnitude) in the fast-electron flux compared to 2-D TPD modeling. The reason is the nonlinear coupling between SRS and TPD which is especially pronounced at densities lower and around 0.23 . In this region plasma waves and growing density perturbations are localized in same areas as illustrated by the caviton correlator. Enhanced density perturbations detune and weaken the TPD-driven plasmons effective in the fast electron generation. In addition to the TPD suppresion, the plasma wave spectra in 3-D simulations are much more narrow compared to the spectra in 2-D TPD modeling. To conclude, 3-D PIC simulations presented in this Letter fully model the laser-plasma interaction near including SRS and TPD, and obtain the fast electron fraction level close to experimental results, resolving the large discrepancy between ICF experiments and PIC simulations that existed for many years before.
Acknowledgements.
This work was supported by the Department of Energy National Nuclear Security Administration under Award Number DE-NA0001944, the University of Rochester, and the New York State Energy Research and Development Authority. We also acknowledge the support by the DOE under grant No. DE-SC0012316, and by the NSF under grant No. PHY-1314734. This report was prepared as an account of work sponsored by an agency of the U.S. Government. Neither the U.S. Government nor any agency thereof, nor any of their employees, makes any warranty, express or implied, or assumes any legal liability or responsibility for the accuracy, completeness, or usefulness of any information, apparatus, product, or process disclosed, or represents that its use would not infringe privately owned rights. Reference herein to any specific commercial product, process, or service by trade name, trademark, manufacturer, or otherwise does not necessarily constitute or imply its endorsement, recommendation, or favoring by the U.S. Government or any agency thereof. The views and opinions of authors expressed herein do not necessarily state or reflect those of the U.S. Government or any agency thereof.References
- Craxton et al. (2015) R. S. Craxton, K. S. Anderson, T. R. Boehly, V. N. Goncharov, D. R. Harding, J. P. Knauer, R. L. McCrory, P. W. McKenty, D. D. Meyerhofer, J. F. Myatt et al. , Phys. Plasmas 22, 110501 (2015).
- Myatt et al. (2014) J. F. Myatt, J. Zhang, R. W. Short, A. V. Maximov, W. Seka, D. H. Froula, D. H. Edgell, D. T. Michel, I. V. Igumenshchev, D. E. Hinkel, et al., Phys. Plasmas 21, 055501 (2014).
- Yan et al. (2009) R. Yan, A. V. Maximov, C. Ren, and F. S. Tsung, Phys. Rev. Lett. 103, 175002 (2009).
- Yan et al. (2012) R. Yan, C. Ren, J. Li, A. V. Maximov, W. B. Mori, Z.-M. Sheng, and F. S. Tsung, Phys. Rev. Lett. 108, 175002 (2012).
- Vu et al. (2012a) H. X. Vu, D. F. DuBois, D. A. Russell, and J. F. Myatt, Phys. Plasmas 19, 102708 (2012a).
- Vu et al. (2012b) H. X. Vu, D. F. DuBois, J. F. Myatt, and D. A. Russell, Phys. Plasmas 19, 102703 (2012b).
- Coffey (1971) T. P. Coffey, Phys. Fluids 14, 1402 (1971).
- Dawson et al. (1983) J. M. Dawson, Rev. Mod. Phys. 55, 403 (1983).
- Simon et al. (1983) A. Simon, R. W. Short, E. A. Williams, and T. Dewandre, Phys. Fluids 26, 3107 (1983).
- Liu et al. (1974) C. S. Liu, M. N. Rosenbluth, and R. B. White, Phys. Fluids 17, 1211 (1974).
- Afeyan and Williams (1997a) B. B. Afeyan and E. A. Williams, Phys. Plasmas 4, 3803 (1997a).
- Drake and Lee (1973) J. F. Drake and Y. C. Lee, Phys. Rev. Lett. 31, 1197 (1973).
- Afeyan and Williams (1997b) B. B. Afeyan and E. A. Williams, Phys. Plasmas 4, 3845 (1997b).
- Seka et al. (2009) W. Seka, D. H. Edgell, J. F. Myatt, A. V. Maximov, R. W. Short, V. N. Goncharov, and H. A. Baldis, Phys. Plasmas 16, 052701 (2009).
- Meyer and Zhu (1993) J. Meyer and Y. Zhu, Phys. Rev. Lett. 71, 2915 (1993).
- DuBois and Goldman (1967) D. F. DuBois and M. V. Goldman, Phys. Rev. 164, 207 (1967).
- DuBois et al. (1996) D. F. DuBois, H. A. Rose, and D. A. Russell, Phys. Scr. T63, 16 (1996).
- Kato et al. (1984) Y. Kato, K. Mima, N. Miyanaga, S. Arinaga, Y. Kitagawa, M. Nakatsuka, and C. Yamanaka, Phys. Rev. Lett. 53, 1057 (1984).
- Skupsky et al. (1989) S. Skupsky, R. W. Short, T. Kessler, R. S. Craxton, S. Letzring, and J. M. Soures, J. Appl. Phys. 66, 3456 (1989).
- Fonseca et al. (2002) R. A. Fonseca, L. O. Silva, F. S. Tsung, V. K. Decyk, W. Lu, C. Ren, W. B. Mori, S. Deng, S. Lee, T. Katsouleas et al., in Computational Science – ICCS 2002, edited by P. M. A. Sloot, C. J. K. Tan, J. J. Dongarra, and A. G. Goekstra, Lecture Notes in Computer Science, Vol. 2331 (Springer, Berlin, 2002) p. 342..
- Michel et al. (2013) D. T. Michel, A. V. Maximov, R. W. Short, J. A. Delettrez, D. Edgell, S. X. Hu, I. V. Igumenshchev, J. F. Myatt, A. A. Solodov, C. Stoeckl, et al. Phys. Plasmas 20, 055703 (2013).