The Impact of Competition Between Cancer Cells and Healthy Cells on Optimal Drug Delivery
Abstract
Cell competition is recognized to be instrumental to the dynamics and structure of the tumor-host interface in invasive cancers. In mild competition scenarios, the healthy tissue and cancer cells can coexist. When the competition is aggressive, competitive cells, the so called super-competitors, expand by killing other cells. Novel cytotoxic drugs and molecularly targeted drugs are commonly administered as part of cancer therapy. Both types of drugs are susceptible to various mechanisms of drug resistance, obstructing or preventing a successful outcome. In this paper, we develop a cancer growth model that accounts for the competition between cancer cells and healthy cells. The model incorporates resistance to both cytotoxic and targeted drugs. In both cases, the level of drug resistance is assumed to be a continuous variable ranging from fully-sensitive to fully-resistant. Using our model we demonstrate that when the competition is moderate, therapies using both drugs are more effective compared with single drug therapies. However, when cancer cells are highly competitive, targeted drugs become more effective. In this case, therapies that are initiated with a targeted drug and are exposed to it for a sufficiently long time are shown to have better outcomes. The results of the study stress the importance of adjusting the therapy to the pre-treatment resistance levels. We conclude with a study of the spatiotemporal propagation of drug resistance in a competitive setting, verifying that the same conclusions hold in the spatially heterogeneous case.
keywords:
Tumor growth , Cell competition , Drug resistance , Chemotherapy , Targeted drugs1 Introduction
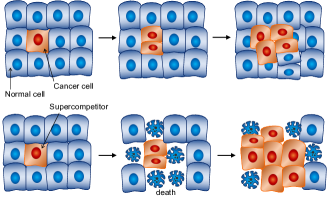
Intra-tumor heterogeneity that results from both genetic and non-genetic mechanisms has been receiving increased attention in recent years (Marusyk et al., 2012; Maley et al., 2017; Hanahan and Weinberg, 2011; Merlo et al., 2006; Gatenby and Gillies, 2008). Due to phenotypic and mutagenic diversity, cancer can be thought of as an ecosystem formed by coexisting populations expressing abnormal features and different cell types that are embedded in a heterogeneous habitat of normal tissue (Hillen and Lewis, 2014). Accordingly, competition between tumor cells and healthy cells in the host tissue may play a key role in cancer growth (Moreno, 2008; Gil and Rodriguez, 2016). Although the mechanisms are complex and are not fully understood, it is known that cells can discriminate their types via short-range interactions that quantify the relative expression levels of particular proteins. Accordingly, cell competition occurs in the process of identifying and eliminating the less fit cells. The fitness-induced process generally eliminates the defective cells, such as Minute gene mutated cells in D. melanogaster (Simpson, 1979; Moreno et al., 2002). However, certain types of cancer cells can signal the death of their surrounding tissue in a way that promotes their neoplastic transformation. After the “loser” cells disappear from the tissue, the “winner” cells not only survive but also proliferate to fill out the void created by the dying cells (Moreno, 2008). Figure 1 illustrates cancer growth in two distinct competition scenarios.
To eliminate cancer cells and suppress their malignant growth, various treatments are available, including surgery, chemotherapy, immunotherapy, and radiotherapy. In particular, cytotoxic chemotherapy and molecular targeted approaches represent two modes of cancer treatment (Masui et al., 2013). Whereas chemotherapy uses highly potent chemicals to target dividing cells, targeted drugs act on specific molecular targets that are associated with cancer. Novel therapies and drug substances are constantly being developed (Ribeiro et al., 2012).
For both chemotherapy and targeted therapy drug resistance is the predominant factor limiting clinical success (Masui et al., 2013; Gillet and Gottesman, 2010; Teicher, 2006; Housman et al., 2014). For instance, resistance to chemotherapy includes extrinsic mechanisms that prevent the drug from reaching its target in an active form due to short serum half-life or rapid clearance by the kidneys and liver (Slingerland et al., 2012; Burris et al., 2011). Intrinsic cellular mechanisms involve increased efflux or decreased uptake, enzymatic modification and inactivation of the drug, and alteration of drug targets within the cell (Gottesman, 2002; Gottesman et al., 2002; Fodal et al., 2011). Resistance to targeted drugs also relies on various mechanisms including cellular responses that maintain the signaling despite the effective targeting or signaling through alteration of downstream effectors, and cell survival pathways by disabling apoptosis (Byers et al., 2013; Zhang et al., 2012). Drug resistance involves genetic and epigenetic alternations that either exist prior to the treatment or acquired, often induced by the drugs (Gillet and Gottesman, 2010; Teicher, 2006). Clinical trials of combinations of cytotoxic and targeted drugs suggest that the complementing mechanisms can be used for developing effective therapies (Dorris et al., 2017; Ribeiro et al., 2012).
Due to the complexity of the underlying mechanisms and the multifactorial pathways of tumor growth and drug resistance, various mathematical models have been developed to describe and investigate the emergence of cancer and its evolution. Modeling approaches include deterministic models using differential equations (Birkhead et al., 1987; Trédan et al., 2007; Anderson and Chaplain, 1998) and stochastic models including branching process and multiple mutations for studying multi-drug resistance and optimal control of drug scheduling (Komarova, 2006; Michor et al., 2006; Kimmel et al., 1998). These modeling approaches have provided a framework for improving early detection, for quantifying intrinsic and acquired resistance cells, and for designing therapeutic protocols (Lavi et al., 2012; Michor et al., 2006; Foo and Michor, 2014; Roose et al., 2007; Swierniak et al., 2009).
On top of that, various mathematical models incorporate tumor heterogeneity and competition between distinct cell types (Bacevic et al., 2017; Piretto et al., 2018; Lorz et al., 2013; Yoon et al., 2018). Recent models using ordinary differentiation equations (ODEs) focus on competition between distinct types of cancer cells that are either resistant or sensitive to a single drug (Piretto et al. (2018); Carrère (2017); Yoon et al. (2018)). While ODEs can model the overall size of the population, partial differential equations can model spatial heterogeneity in either the physical space or in the phenotypic space. Competition models using reaction-diffusion equations date back to Gatenby and Gawlinski (1996) that describe the spatial distribution and temporal evolution of an invasive tumor, accounting for the density of the normal tissue and the neoplastic cancerous tissue. Considering phenotypic heterogeneity, Lorz et al. (2013) developed a model for the competition between healthy cells and tumor cells that depends on a continuous phenotypic variable of cytotoxic drug resistance level. All aforementioned models consider drug resistance to a single drug.
To study the impact of cell competition and the heterogeneity in drug resistance, we develop a phenotypic structured model extending the model proposed in Lorz et al. (2013). Our model consists of healthy cells and tumor cells depending on a continuous variable that represents the level of drug resistance. The model is aimed at designing effective combination therapies (see also Perthame et al. (2014); Cho and Levy (2018b)). We study two scenarios: (i) a mild competition that allows coexistence of distinct cells; and (ii) an aggressive competition that results with the elimination of one population (see Figure 1). We examine the tumor response under a combination therapy of cytotoxic and targeted drugs, assuming a continuous level of drug resistance to each drug. This distinguishes our work from most other competition models that only consider resistance to a single drug (Carrère, 2017; Lorz et al., 2013; Bacevic et al., 2017). Our study implies that the optimal order between the drugs as well as the duration of therapy, depend on the competition parameter and on the ratio of preexisting resistant cells to each drug.
The paper is organized as follows. In section 2, we introduce the competition model between cancer cell and healthy cells with a multi-dimensional resistance trait. We estimate the range of the competition rate that corresponds to the super-competitive scenario, where only one population can survive. In section 3, we numerically study our model, focusing on cancer growth and on the emergence of resistance under different combination therapies. Therapies in which one drug is switched for a second drug are compared to single-drug therapies in section 3.1, particularly when the competition rate is low. In section 3.2, we study the effect of different continuum models in the resistance space and numerically compute the optimal switching time that minimizes the overall number of cancer cells in a given time interval. Alternating therapies and combination on-off therapies are compared in section 3.3. The model is extended to space and the proposed therapies are studied in section 4. Concluding remarks are provided in section 5.
2 A Mathematical Model for the Competition Between Healthy Cells and Cancer Cells
To model the competition between healthy cells and cancer cells and the emergence of resistance, we consider two populations: healthy cells and cancer cells . Both populations describe the number of cells at time that have a resistance phenotype . The variable describes the level of drug resistance to cytotoxic drugs () and to targeted drugs (). The value 0 corresponds to full sensitivity to the drug, and the value 1 corresponds to complete resistance. For example, the level of resistance to cytotoxic agents can be related to the expression level of a gene or a gene cluster that is linked to the cellular level of drug resistance and proliferation potential, such as MDR1, ALDH1, CD44 (Hanahan and Weinberg, 2011; Amir et al., 2013; Medema, 2013). We model the competition of and as a reaction-diffusion system,
| (1) | ||||
| (2) |
The reaction terms involve proliferation, apoptosis, and drug effect. The first reaction terms with model the consumption of the resources depending on the resistance level. We assume that the proliferation rates satisfy and , corresponding to the assumption that resistant cells devote their resources to developing and maintaining the drug resistance mechanisms (see the experimental evidence in Misale et al. (2015); Mumenthaler et al. (2015); Wosikowski et al. (2000)).
The death terms involve the rate of apoptosis, and . We consider a logistic growth model with and being the total numbers of normal cells and cancer cells, computed as
and . The carrying capacity of normal cells with phenotype , is given by . Key to the model are the competition terms: apoptosis due to competition occurs with rates and with respect to the size of the other cell population. This resembles the competitive Lotka–Volterra model, (e.g., Gatenby and Gawlinski (1996); Murray (2002)), and has been referred to as competition rate in competition models (Piretto et al., 2018).
The drug effects that represent the death of cancer cells due to the action of cytotoxic and targeted drugs are also included in the growth term. The time-dependent dosages are denoted by for the cytotoxic drug and for the targeted drug. The healthy cells are affected only by the cytotoxic drug with a drug uptake function . Cancer cells respond to both the cytotoxic drug and to the targeted drug with uptake functions , and , respectively. As the resistance level increases, the cells become more resilient to the drugs. This translates to the modeling assumption , , and (Lorz et al., 2015; Mumenthaler et al., 2015).
Chemotherapy uses highly potent chemicals that kill rapidly dividing cells, thus we take and , and assume that the therapy is more effective with sensitive cells. On the other hand, targeted therapies selectively target these cancer-related genetic lesions. Hence, we let , and assume that targeted drugs do not affect healthy cells.
The Laplacian operator describes the instability in the resistance phenotypic space with rates and . In addition to genetic mutations, epimutations contribute to phenotypic instability: heritable changes in gene expression that do not alter the DNA (Brock et al., 2009; Glasspool et al., 2006; Gupta et al., 2011). Recent experiments demonstrated that such non-genetic instability and phenotypic variability allow cancer cells to reversibly transit between different phenotypic states (Chang et al., 2006; Pisco et al., 2013; Sharma et al., 2010).
2.1 Studying the competition parameter
Recent studies suggest that cell competition is often critical in shaping cancer development (Vivarelli et al., 2012; Wagstaff et al., 2013). In particular, the fitness-sensing process during competition that usually eliminates defective cells, has a distinctive behavior in pre-cancerous lesions (Moreno, 2008). By acquiring a ”super-fit” status, these super-competitors mutated cells can sense the surrounding wild-type cells as ”less fit” and signal the death of surrounding tissue that in turn promotes their neoplastic transformation (Gil and Rodriguez, 2016). In our model, the competition parameters and describe the aggressiveness of the cells towards cells from the other populations.
To characterize competition scenarios, we simplify Eqs. (1)–(2) by excluding the diffusion terms, and consider parameters as follows. We will revisit the diffusion terms in a later section. The proliferation rate and death rate are assumed to be constant. Cancer cells proliferate times faster than healthy cells, that is, and with . The apoptosis rates are taken as . The cross-competition parameter is taken as and . We provide analytical results assuming that the model has a single trait , so that and . This is of value since phenotype-structured models are known to asymptotically converge to a Dirac-delta distribution at few dominating resistance traits (Lorz et al., 2011; Perthame and Barles, 2008). We consider the following scenarios:
No treatment. When no drug is applied (), a nontrivial equilibrium of and exists if and . This reduces to a condition that the two populations can coexist when the competition rate satisfies . Otherwise, when the competition rate is , one of the cell populations must become extinct, either , or , . We consider this case as the super-competitive scenario. Since represents the ratio of over-proliferation of cancer cells compared to normal cells, for larger values of , it is likely to be super-competitive for a larger range of the competition rate .
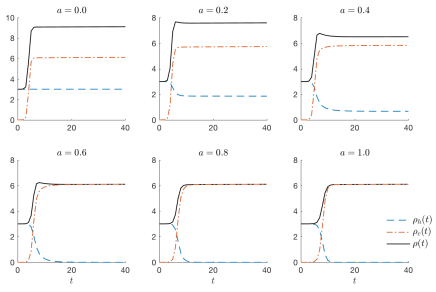
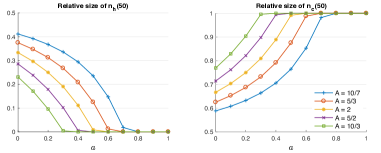
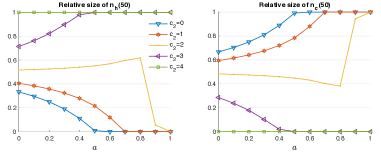
Figure 2 shows healthy cells, cancer cells, and combined counts, up to , for . We consider and , which corresponds to the relative proliferation Healthy cells and cancer cells coexist when , but when , the cancer cells overtakes the population and the healthy cells are eliminated. This condition is demonstrated again in Figure 3(a). The relative numbers of cells and at are plotted for different values of and . The coexistence threshold is apparent in the results.
(a) No drug
(b) Cytotoxic
(c) Targeted
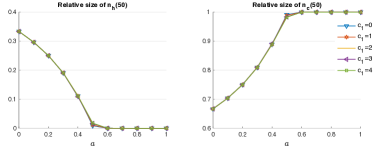
Weak treatment. The condition for coexistence changes when the drug is applied with small dosages. For the cytotoxic drug, if , then coexistence amounts to . We note that the condition is identical to the no treatment case if the drug uptake rate of healthy cells versus cancer cells is proportional to the proliferation rate, that is, if . However, under weak targeted therapy, , coexistence bois down to so that the cells are likely to coexist for larger values of .
Strong treatment. We assume that the drug dosages are sufficiently high such that only the most resistant cells can survive, corresponding to , where . With such a dosage , the coexistence condition is identical to the no treatment case as .
The results shown in Figure 3(b,c) are computed with and agree with the theoretical thresholds. While the cytotoxic drug does not change the range of that corresponds to coexistence, the targeted drug increases the range of coexistence for weak dosages. The threshold of the competition parameter is summarized in Table 1.
| No drug, | Weak drug | |
|---|---|---|
| Strong drug | Cytotoxic drug | Targeted drug |
2.2 Effectiveness of targeted drugs in the highly competitive case
Let us estimate the drug dosage based on the dominating trait . The instantaneous growth rate at time is
This rate is reduced by and when a drug is administered. We provide an estimation for the case of and assuming that an increased level of resistance implies lower levels of proliferation and drug effect. For instance, when the sensitive cells are dominant such that , the growth rate without the treatment becomes . This growth term for the dominant cells is negative when the initial dosage of cytotoxic drug satisfies
As increases, resistant cells arise. The cytotoxic drug dosage that is necessary to lower the number of cancer cells increases and it may reach the maximum tolerated dose. Eventually, when , the drug effect term, , becomes negligible even with high dosages. In this case, reducing the growth rate using the competition term involving the healthy cells becomes more effective. Thus, when
targeted therapy is preferable since it can still suppress the cancer cells using the competition term , preserving the normal cells despite the reduced drug effect due to resistance. The effect of this term becomes more critical for larger values of the competition parameter . We verify the effectiveness of targeted drugs in the highly competitive case in our simulations.
2.3 Switching drugs as a function of the resistance ratio
The choice of drug can be determined by considering the ratio of resistance. For simplicity we classify the sensitive and resistant cancer cells into four groups as , , , and , where and represent being sensitive and resistant to one of the drugs. The first index corresponds to the cytotoxic drug and the second index corresponds to the targeted drug. The treatment type can be determined by comparing and , where the drug type with less resistant cells should be administered first. For instance, if the resistant population to the second drug is larger, , it is more effective to use the first drug, assuming that the effective decay rates due to each drug, and , are identical. Since , we have
where the left- and right-hand sides represent the number of cancer cells after treated for time with the first and the second drug, respectively. This result differs from the one obtained in Piretto et al. (2018), in which a combination therapy of cytotoxic chemotherapy and immunotherapy assuming resistance to only cytotoxic drugs was considered. When cells that are resistant to cytotoxic drugs are present, it was suggested to first apply the cytotoxic drug (Piretto et al., 2018).
3 Combining cytotoxic and targeted drugs
We study the effect of different combination therapies with cytotoxic and targeted drugs. The resistance trait becomes , where and represents resistance to cytotoxic and targeted drug, respectively. In particular, we consider the model functions as in Lorz et al. (2013),
| (3) | ||||
where and are the maximum proliferation rates of healthy and cancer cells, respectively, and is the apoptosis rate. The drug uptake functions are taken as
| (4) |
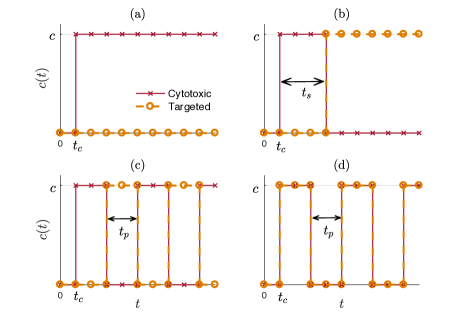
All model functions satisfy the positivity and slope assumptions from section 2. The drug schedules we consider are shown in Figure 4. We consider four different therapies: (i) a single cytotoxic drug therapy initiated at (a), that is, ; (ii) a switching therapy such that the drug is switched once after (b), and ; (iii) an alternating therapy with period (c), and ; and (iv) combination on-off therapy with period (d), and .
The initial cell populations are set as
| (5) |
Here, the mean resistance phenotype is centered at and at for the cytotoxic drug and the targeted drug, respectively. In addition, represents the initial proportion of the cancer cells in the tissue, and controls the variance of the preexisting resistance. is a normalizing constant chosen so that .
3.1 Single drug and drug switching therapy using cytotoxic and targeted drugs
Cytotoxic
Targeted
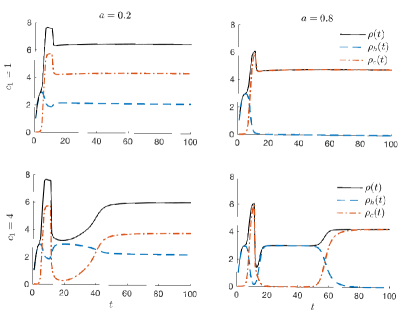
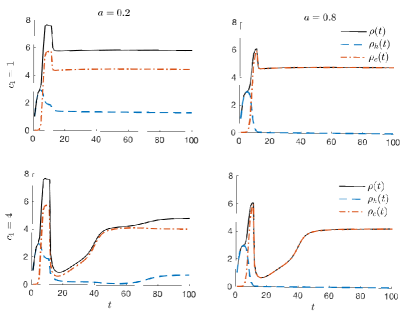
We first examine the outcome of a single drug therapy for different values of the competition parameter , using either a cytotoxic or a targeted drug. We simulate the model without the diffusion term (). For the initial condition, we set , , and . The results shown in Figure 5 confirm that the competition parameter determines the outcome: either coexistence or aggressive competition. This is the case with a low dosage as well as with a higher dosage . When , healthy cells and cancer cells are both present throughout the treatment, but not when . In particular, under a high dosage of the cytotoxic drug, , the relapsed cancer cells overtake the population. In the case of a targeted drug, the healthy cells suppress the cancer cells for some time, so that the relapse is delayed. This does not prevent an eventual relapse. The results are consistent with the observations of Suijkerbuijk et al. (2016) that showed that when the APC mutant clones in Drosophila midgut reach a certain size, they induce the apoptotic death of the surrounding wild-type cells. From this simulation, we observe that the targeted drug is partially effective in the competitive scenario, .
Figures 6–7 show the effect of increasing the dosages in the range for the single drug therapy case, comparing cytotoxic and targeted drugs. Here, we assume less preexisting resistance by setting . In Figure 6, acute relapse is observed under cytotoxic drug with high dosages , where the number of cancer cells rapidly increases at later times (), compared with moderate dosages (). This is the case for both competitive scenarios and . However, under targeted drugs, the relapse is worse when , but not when the cells are highly competitive (). The targeted drugs eliminate only the cancer cells which helps the healthy tissue maintain its dominance and suppress the growth of cancer. In contrast, the cytotoxic drug, provides an advantage to the highly proliferative cancer cells, allowing them to fill in the void.

We compare the results when the rate of apoptosis due to the cytotoxic drug is larger than the rate induced by the targeted drug, hoping that this will provides insights about improved drug scheduling. Figure 7 shows the results where the uptake function of the cytotoxic drug amplifies by up to 1.66 times the uptake function of the targeted drugs. The cytotoxic drug with a stronger uptake function is more efficient in killing the cancer cells, until a certain time point where the resistant cells cause a relapse. However, when , stronger apoptosis of the cytotoxic drug holds for a very short period of time, so that the targeted drug has a significant advantage over the cytotoxic drug. This suggests that there may exist a drug scheduling that maximizes the drug effect, particularly when the competition is less aggressive ().
To demonstrate the effectiveness of combination therapies, we compare the number of cells and using a single drug therapy, to a combination therapy switching either from a cytotoxic drug to a targeted drug or the other way around. We comment that often the first-line therapy is replaced by other drugs once it becomes ineffective (Biswas et al., 2016; Mok et al., 2009; Kalemkerian et al., 2012). Figure 8 presents the results where the first drug is applied at , and switched to the second drug at . We set the values of the cytotoxic drug dosage, , and the targeted drug dosage, , to either or . We observe that switching the drug delays the relapse until the final simulation time , in particular with the higher drug dosage, . While a single drug therapy eventually results in a relapse due to the resistant population, we verify that switching the drug helps in delaying the relapse. This conclusion depends on the level of competition. With a moderate dosage , switching from a cytotoxic drug to a targeted drug is effective when , but not when , where targeted drugs are advantageous.
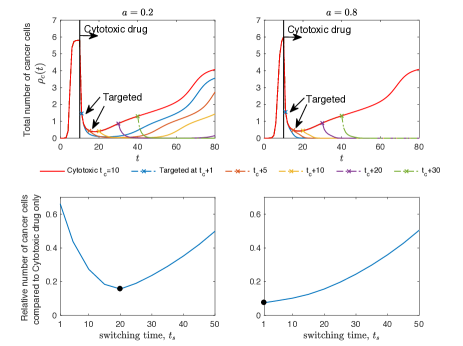
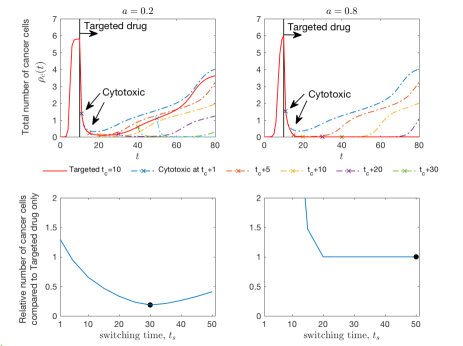
We further aim to compute the optimal switching time. Figures 9 and 10 show the total number of cancer cells, , for the low-competition () and the highly competitive () cases. The drug is switched at different times after the initial drug is applied at . We fix the dosage as . The case when the therapy is initiated with a cytotoxic drug is shown in Figure 9. We observe that the cancer cell population remains low when the targeted drug is applied after the cytotoxic drug has eliminated sufficiently many cells that were resistant to the targeted drug. The second row shows the relative size of the total cancer cell population compared to a single drug therapy, that is, , where is the number of cancer cells subject ot a cytotoxic drug treatment only. We observe that when , there exists an optimal switching time. The relative cancer size is minimized to 20% when the therapy is switched at . Figure 10 shows the opposite case where the drug is switched from targeted to cytotoxic. Similarly, one can benefit from switching the drug when . In this case, the optimal switching time is approximately . When , a therapy using only the targeted drug with a dosage of is more effective than an alternating therapy. As a result, rapidly switching the drug from targeted to cytotoxic yields significantly worse results, while for the switching from cytotoxic to targeted drug – the sooner the better.
3.2 Continuous phenotypic levels of drug resistance
In this section, we study the implications of considering a continuous resistant space on the treatment scheduling. Generally, we will observe variations in the mean resistant level as a function of the drug dosage. In a previous work we demonstrated that different continuum models of proliferation and uptake functions yield distinctive dynamics in the drug resistance space, Cho and Levy (2018a). The dynamics of continuum-resistance models can be similar to the dynamics of models that are based on discrete levels of resistance. It can also be significantly different. In linear models of proliferation and drug uptake , the typical outcome is that cells end up concentrating either in the most sensitive or in the most resistant trait. Such dynamics is essentially similar to considering a model with two resistance states: fully resistant and fully sensitive. Differences between the continuum and discrete models are observed with non-linear proliferation and drug uptake functions. Here, we study how our model depends on the choice of continuum models by considering two functions: (i) a quadratic model that allows intermediate resistance level,
and (ii) a linear model for which the outcome is similar to a discrete two-states model,
The parameters are taken to be comparable with Eqs. (3)–(4). The death terms are assumed to be constant, , and the epimutation rates are set as .
Cytotoxic
Targeted
Cytotoxic
Targeted
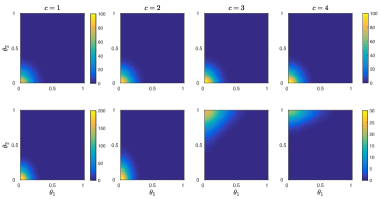
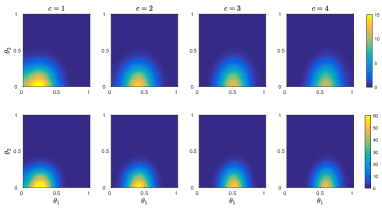
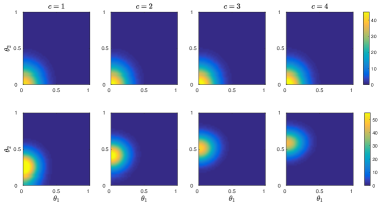
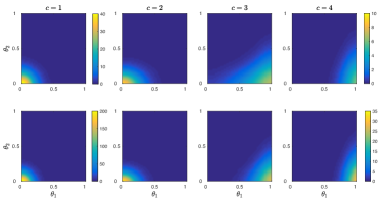
Figures 11 and 12 show the distribution of both healthy cells, , and cancer cells, , in the resistance space. These results are computed with the quadratic and linear models, while increasing the drug dosage, . The distributions are shown for the case when the competition allows cells to coexist ( at time ). Figure 11 confirms that the quadratic model allows for intermediate resistance levels that gradually increase with increased drug dosage. As the dosages of the cytotoxic and targeted drugs increase, the mean resistance level of cancer cells increases in the corresponding direction of and . The resistance levels of healthy cells is affected only by the cytotoxic drug. In contrast to the smooth transition in the resistance level observed in the quadratic model, the outcome of the linear model is closer to binary as shown in Figure 12. With the dosage threshold of , the dominating resistance trait instantly changes from fully-sensitive () to fully-resistant (). We note that in the highly competitive case, , the distributions are similar to the results shown in Figures 11 and 12, only that the concentration of healthy cells is relatively low, .
model 1
model 2
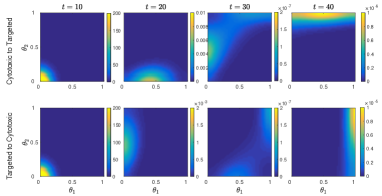
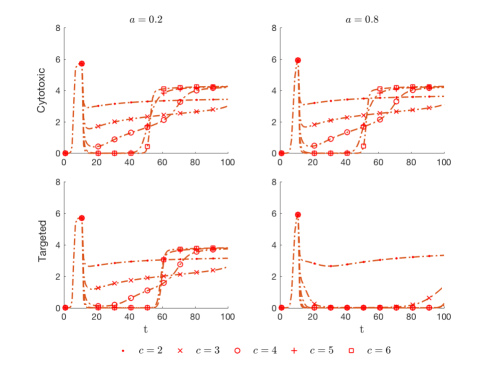
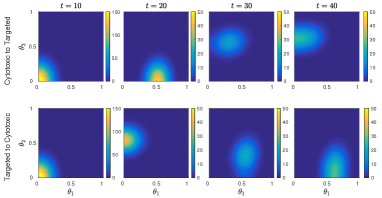
We proceed to studying the evolution of the distribution in the resistance space under drug switching therapy. The results are shown in Figure 13. Here, the initial drug is applied at and is then switched to the second drug at . Prior to the treatment, the most sensitive cells dominate the population. However, after treatment is initiated, the resistant cells emerge, depending on the drug type. For instance, when the therapy is switched from a cytotoxic drug to a targeted drug, the distribution shifts from and to . Compared with the outcome of a single drug therapy, the population of cancer cells that are resistant to one drug and sensitive to the other drug declines. Cells that are resistant to both drugs, and , are likely to survive.
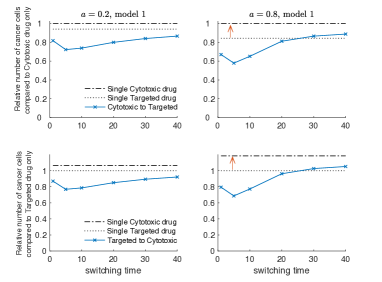
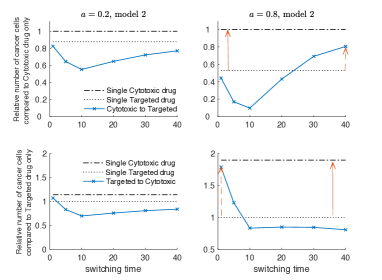
Figure 14 compares the effect of switching therapy to a single drug therapy for the two continuum models. The relative size of the total cancer cell population compared with a single (cytotoxic) drug therapy, is , where is the number of cancer cells under a cytotoxic drug treatment. Once again, the results confirm that a single targeted drug therapy is particularly effective when the cells are highly competitive, . This is more significant in the linear model, where the relative size of the cancer cell population reduces approximately to 50%, compared with 80% with the quadratic model. When , the switching therapy in any order is more effective than the single drug therapies regardless of the continuum model (). We note that the outcome of linear model strongly depends on the switching time , and particularly becomes worse than the single targeted drug therapy when , if the tumor is not exposed to the targeted drug for a sufficiently long period.
3.3 Alternating therapies and on-off combination therapies
In the previous sections we studied the emerging dynamics when switching cytotoxic and targeted drugs. The study was performed assuming competition between healthy cells and cancer cells, and a continuum resistance trait. In this section, we assume that the drug can be changed within a short period of time, and study the periodically alternating therapy and the on-off combination schedules depicted in Figure 4(c,d). The results for these studies are shown in Figures 15–16. In both figures, the drug therapies start at . We test for different dosages: (i) a moderate dosage aiming at maintaining the cancer cell population at low levels; and (ii) a high dosage, , aiming at completely eliminating the cancer cells. We also test for different competition rates and . As a reference, we plot the results obtained with single drug therapy.
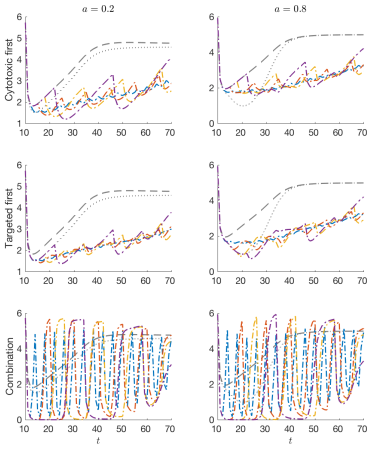

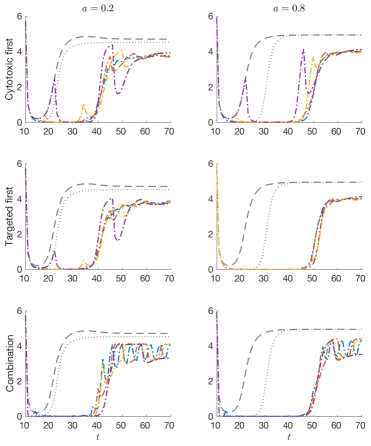

Figure 15 shows the dynamics of the cancer cells under the moderate dosage. We observe that the alternating therapy is more effective than the other therapies, as it reduces the overall number of cancer cells compared to single drug therapies. In particular, alternating the drug with a short period () suppresses the cancer growth without oscillations. Initiating the alternating therapy in any order ends with similar results for both competition rates since the preexisting resistant populations to both drugs are identical. On the other hand, the on-off combination therapy yields a highly oscillatory behavior that results in larger numbers of cancer cells during the off period compared with the single drug therapy. Since the dosage of chemotherapy is restricted due to its toxic nature (Dorris et al., 2017; Ribeiro et al., 2012), the on-off combination therapy may not be effective in such situations.
In the case of a higher dosage, , we observe that the number of cancer cells reduces to less than an order of magnitude for a certain time period before a relapse occurs. As shown in Figure 16, both of the alternating and combination schedules significantly delay the relapse compared to the single drug therapies. As before, alternating the drug with shorter periods () keeps the cancer population below a certain threshold, in contrast to longer periods that may result in small peaks throughout the treatment. However, when , we observe that initiating the therapy with the targeted drug is more effective in the sense that it overcomes the drawback of longer drug periods. We also observe that the on-off combination therapy with a high dosage effectively reduces the cancer cells population and delays the relapse, similarly to the alternating schedule with short periods. However, after the relapse, the cancer cell population fluctuates more than with the alternating schedule.
The results obtained so far assume equal sizes of preexisting populations that are resistant to the cytotoxic and to the targeted drugs. However, since the preexisting resistance is one of the critical factor in relapse, we further study the more realistic scenario in which different fractions of the pre-treatment population are resistant to both drugs. We denote the number of cells that are resistant to the cytotoxic drug and to the targeted drug as
respectively. We remark that the previous results correspond to the case . We consider the initial condition as in Eq. (5), but with different variances or for each direction, or . The ratio then either becomes or .
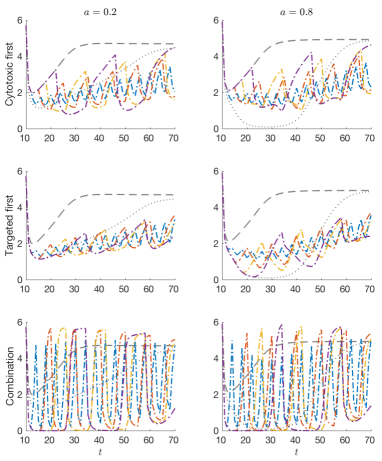
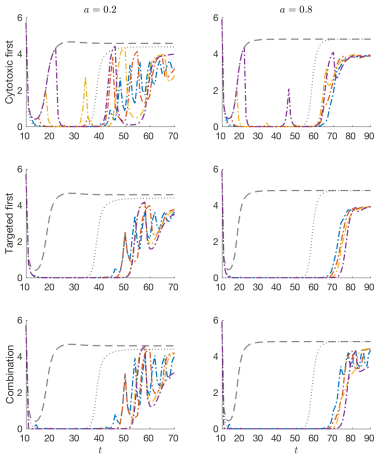

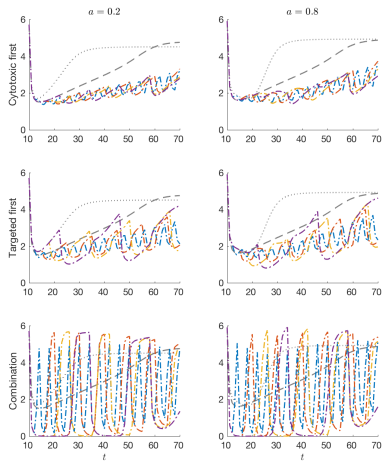
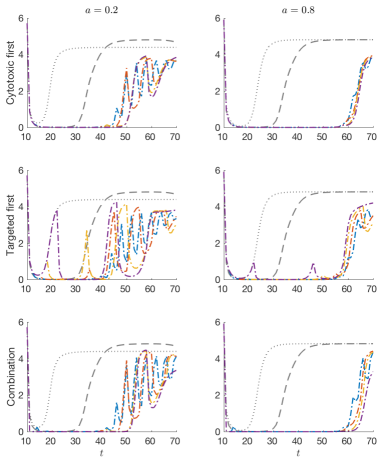

Figure 17 presents the results for the case when the cytotoxic resistant cells have a higher ratio, that is, . Figure 18 shows the opposite case. We test the same therapies as before including the single drug, alternating therapies, and combination therapies. We consider the moderate dosage and the high dosage . The competition rates are set as and . Similar conclusions hold as in the symmetric pre-treatment case. With a relatively low dosage, the alternating schedule with a small period works remarkably better than the combination therapy, while with a relatively high dosage, the combination therapy can also suppress the tumor growth for a certain period of time. However, in the asymmetric pre-treatment case, the order of drugs becomes more important to the therapy outcome. First, the outcome of single drug therapy is correlated with the size of the preexisting resistance: In Figure 17, the cytotoxic drug produces a worse outcome due to a larger pre-treatment resistance population, while the targeted drug yields the early relapse portrayed in Figure 18. In addition, when , initiating an alternating schedule with a targeted drug is more effective than initiating it with the cytotoxic drug, particularly for higher dosages. Clearly, this is the outcome because the targeted drug reduces the population of cells that are resistant to the cytotoxic drug. In addition, for the highly competitive case, , we observe that a single targeted drug therapy with dosage yields the minimal number of cancer cells up to with a relatively low dosage. This provides us with an opportunity to design an effective adaptive therapy.
On the other hand, when , it is better to initiate the treatment with the cytotoxic drug. As expected, the results suggest that the pretreatment drug resistance can be a critical factor in determining the coure of therapy and its outcome.
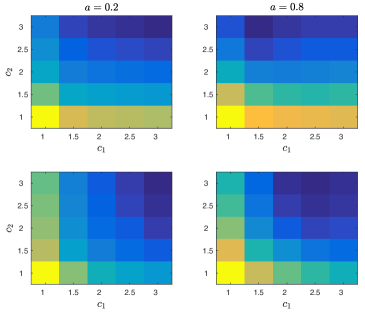
In addition to drug scheduling, we also study the effect of dosages with respect to asymmetric preexisting resistance. In Figure 19, we present the number of cancer cells at using a combination therapy with a cytotoxic drug dosage and a targeted drug dosage . When , we observe that a higher dosage of the targeted drug is more effective than increasing the dosage of the cytotoxic drug. For instance, the dosage results in a smaller tumor than . In the opposite case, , the result is reversed: is a more effective treatment. When the competition is mild, , increasing the dosages of both drugs constantly improves the outcome. However in the highly competitive case, , there exists an optimal dosage of the cytotoxic drug. For instance, when , results with the minimum number of cancer cells. The optimal dosage changes to , with a slightly larger cytotoxic drug dosage when .
4 Tumor growth model with cell competition
We extend the competition model by including a physical space variable . The concentrations of healthy cells, , and cancer cells, , are governed by the following system,
| (6) | ||||
Here, and , are the cell pressures for the healthy cells and the cancer cells, respectively. The normalizing constants are taken as the maximum cell capacity and . The growth terms, and , are taken as in Eqs. (1) and (2), and and are constants describing cell motility. The spatial competition model follows the tumor growth model developed in Cho and Levy (2018b), and the cell motility parameters are taken as , , and (Bray, 2000).
We consider three spatially heterogeneous drug distributions to examine the therapies and :
-
i.
A constant dosage,
- ii.
-
iii.
A highly heterogeneous case (Peng et al., 2016),
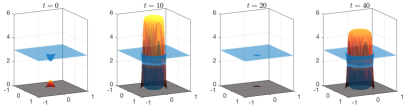
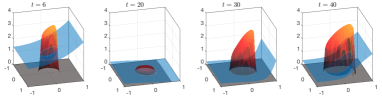
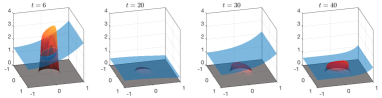
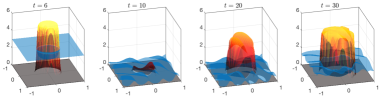
We assume a similar dependence of the resources on the space variable, and , with all three cases considered. We choose the initial condition as a small concentration of cancer cells embedded in the center of a healthy tissue (see Figure 20, ). The following results are presented by plotting the total number of healthy cells, , and cancer cells, .
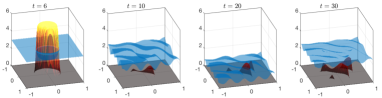
Figure 20 corresponds to the case of a constant dosage. The initial tumor is located at the center of the domain. The first row shows the mildly competitive case, , and treatment with the cytotoxic drug. The second row shows the highly competitive case, , and treatment with the targeted drug. The treatments are initiated at and , respectively, with dosages . We observe that the cytotoxic therapy eliminates the healthy tissue in addition to the cancer cells, unlike the targeted drug. In addition, when , the cancer cells grow on top of the healthy tissue, while in the highly competitive case, , the cancer cells replace the healthy tissue while expanding. In both cases, a tumor treated with a single drug therapy quickly relapses due to the preexisting resistant cells. The spatial simulations with constant dosages are consistent with the results of the non-spatial model in the previous sections.
Cytotoxic
Targeted
Cytotoxic
Alt.
Targeted
Alt.
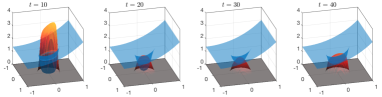
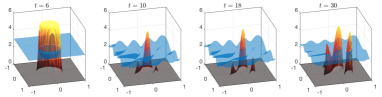
We now test combination therapies when the drug distribution is spatially heterogeneous. Figure 21 compares single drug therapies and alternating therapies with period , when the resource and drugs are diffused from the right boundary, . The treatment dosages are taken as and . We remark that prior to the treatment, the tumor grows faster closer to the right boundary where the concentration of resources is high. Using a single drug therapy, the tumor relapses before , particularly when using the cytotoxic drug. When , we verify the effectiveness of the targeted drug, for which we observe that the size of the tumor at is smaller compared with the tumor at the same time using the cytotoxic drug, despite the lower drug dosage. The alternating therapies are more effective compared with the single-drug therapies in all competition environments, although the difference is smaller in the highly competitive case , since the single targeted drug therapy is effective as well.
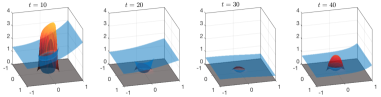
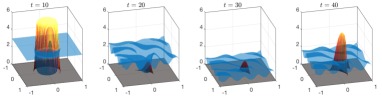
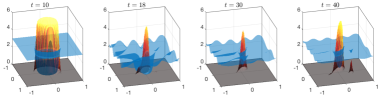
Finally, different therapies including the on-off combination therapies are compared in Figure 22. We set the dosages as , which are sufficiently high so that the on-off combination therapies are effective as much as the alternating therapies. The drug distribution is heterogeneous. As expected, the single drug therapies result with strong relapses compared with the alternating and combination therapies. In addition, we observe emerging local peaks of cancer cells when using combination therapies during the off periods. This is particularly worse than the outcome of alternating therapies when . In case of , although the alternating therapy is more effective in suppressing the tumor throughout the treatment than the combination therapy, the sizes of the relapsed tumors at are similar.
Cytotoxic
Alt.
Comb.
Targeted

Alt.
Comb.
5 Conclusion
In this work we develop a competition model of healthy and cancer cells that takes into account resistance to cytotoxic and targeted drugs. We study the dynamics of resistance to the drugs and observe the emergence of populations with distinct levels of resistance depending on the therapy. Primarily, we classify the cell competition scenarios as either mild, where distinct cell types can coexist, or aggressive, where cancer cells dominate by actively eliminating the healthy cells. The threshold of the competition rate that distinguishes the two scenarios is related to the over-proliferation of the cancer cells over the healthy tissue. It also depends on the drug dosages. In addition, the analysis shows that targeted therapies have a greater potential of being effective when the cells are highly competitive.
Various drug treatments are tested in the two competition scenarios, and we observe that the treatment outcomes are distinctive. Although the targeted drug is more effective in the highly competitive case, using a single drug therapy, either cytotoxic or targeted, results with an eventual relapse due to the preexisting resistance, regardless of the strength of the competition. However, treatments that include both drugs show better outcomes in terms of the relapse time and the tumor size. Considering the drug switching therapy, an optimal switching time that minimizes the overall number of cancer cells exists when the competition is mild. In the highly competitive case, the targeted drug therapy alone is often effective enough. We also compare different continuum models that either allow for intermediate resistance states or are close to a two-state model with cells that are either fully sensitive or fully resistant to the drugs. Although the overall advantage of the switching therapy over single drug therapy in different competition environment holds, the linear model is shown to be more sensitive to the switching time that often yields a worse outcome compared with a single targeted drug therapy. Thus, when the population is highly competitive and the tumor proliferation and the drug uptake linearly depend on the resistance trait, the drug switching time should be more carefully determined. Alternating treatments with different periods are shown to be effective in suppressing the cancer population during the entire treatment period compared to the other therapies. This particularly holds with small periods. Finally, we investigate a spatially heterogeneous tumor growth model, and verify that the same conclusions hold.
As future work, we propose to incorporate experimental results considering combination of chemotherapy and targeted therapies (Dorris et al., 2017; Ribeiro et al., 2012) and develop optimal strategies using optimal control theory for stabilizing the cancer population and/or minimizing the tumor size during the treatment period (Carrère, 2017; Jonsson et al., 2017). Adaptive therapy is another interesting topic that aims at controlling the tumor by maintaining sensitive cells in order to suppress the resistant cancer cells (Gatenby et al., 2009; Bacevic et al., 2017). Finally, the computational cost of simulating three-dimensional tumor growth models with multi-dimensional resistance traits is prohibitively expensive due to the high dimensionality. This requires developing an efficient numerical method that balances computational cost and accuracy (Grasedyck et al., 2013; Cho et al., 2016).
Acknowledgments
The work of DL was supported in part by the National Science Foundation under Grant Number DMS-1713109 and by the Jayne Koskinas Ted Giovanis Foundation.
References
- Amir et al. (2013) Amir, E.-a. D., Davis, K. L., Tadmor, M. D., Simonds, E. F., Levlne, Jacob, H., Bendall, S. C., Shenfeld, D. K., Krishnaswamy, S., Nolan, G. P., Pe’er, D., 2013. viSNE enables visualization of high dimensional single-cell data and reveals phenotypic heterogeneity of leukemia. Nat Biotechnol. 31 (6), 545–552.
- Anderson and Chaplain (1998) Anderson, A. R., Chaplain, M., 1998. Continuous and discrete mathematical models of tumor-induced angiogenesis. Bull. Math. Biol. 60 (5), 857–899.
- Bacevic et al. (2017) Bacevic, K., Noble, R., Soffar, A., Wael Ammar, O., Boszonyik, B., Prieto, S., Vincent, C., Hochberg, M. E., Krasinska, L., Fisher, D., 2017. Spatial competition constrains resistance to targeted cancer therapy. Nature Communications 8 (1995), 1–15.
- Birkhead et al. (1987) Birkhead, B. G., Rakin, E. M., Gallivan, S., Dones, L., Rubens, R. D., 1987. A mathematical model of the development of drug resistance to cancer chemotherapy. Eur. J. Cancer Clin. Oncol. 23, 1421–1427.
- Biswas et al. (2016) Biswas, R., Gao, S., Cultraro, C. M., Maity, T. K., Venugopalan, A., Abdullaev, Z., Shaytan, A. K., Carter, C. A., Thomas, A., Rajan, A., Song, Y., et al., 2016. Genomic profiling of multiple sequentially acquired tumor metastatic sites from an ”exceptional responder” lung adenocarcinoma patient reveals extensive genomic heterogeneity and novel somatic variants driving treatment response. Cold Spring Harbor molecular case studies 2 (a001263), 1–26.
- Bray (2000) Bray, D., 2000. Cell Movements: From Molecules to Motility, 2nd Edition. Garland Science.
- Brock et al. (2009) Brock, A., Chang, H., Huang, S., 2009. Non-genetic heterogeneity - a mutation-independent driving force for the somatic evolution of tumours. Nat. Rev. Genet. 10 (5), 336–342.
- Burris et al. (2011) Burris, H. A., Rugo, H. S., Vukelja, S. J., Vogel, C. L., Borson, R. A., Limentani, S., Tan-Chiu, E., Krop, I. E., Michaelson, R. A., et al., 2011. Phase II study of the antibody drug conjugate trastuzumab-DM1 for the treatment of human epidermal growth factor receptor 2 (HER2)-positive breast cancer after prior HER2-directed therapy. J. Clin. Oncol. 29, 398–405.
- Byers et al. (2013) Byers, L. A., Diao, L., Wang, J., Saintigny, P., Girard, L., Peyton, M., Shen, L., Fan, Y., Giri, U., Tumula, P. K., Nilsson, M. B., Gudikote, J., et al., 2013. An epithelial-mesenchymal transition gene signature predicts resistance to EGFR and PI3K inhibitors and identifies Axl as a therapeutic target for overcoming EGFR inhibitor resistance. Clin. Cancer Res. 19, 279–290.
- Carrère (2017) Carrère, C., 2017. Optimization of an in vitro chemotherapy to avoid resistant tumours. Journal of Theoretical Biology 413, 24–33.
- Chang et al. (2006) Chang, H. H., Oh, P. Y., Ingber, D. E., Huang, S., 2006. Multistable and multistep dynamics in neutrophil differentiation. BMC Cell Biol. 7 (11), 1–12.
- Cho and Levy (2018a) Cho, H., Levy, D., 2018a. Modeling continuous levels of resistance to multidrug therapy in cancer. Submitted.
- Cho and Levy (2018b) Cho, H., Levy, D., 2018b. Modeling the chemotherapy-induced selection of drug-resistant traits during tumor growth. J. Theor. Biol. 436 (7), 120–134.
- Cho et al. (2016) Cho, H., Venturi, D., Karniadakis, G. E., 2016. Numerical methods for high-dimensional probability density function equations. J. Comput. Phys. 305, 817–837.
- Dorris et al. (2017) Dorris, K., Liu, C., Li, D., Hummel, T. R., Wang, X., Perentesis, J., Kim, M. O., Fouladi, M., 2017. A comparison of safety and efficacy of cytotoxic versus molecularly targeted drugs in pediatric phase I solid tumor oncology trials. Pediatric Blood and Cancer 64 (3), 1–11.
- Fodal et al. (2011) Fodal, V., Pierobon, M., Liotta, L., Petricoin, E., 2011. Mechanisms of cell adaptation: when and how do cancer cells develop chemoresistance? Cancer J. 17 (2), 89–95.
- Foo and Michor (2014) Foo, J., Michor, F., 2014. Evolution of acquired resistance to anti-cancer therapy. J. Theor. Biol. 355, 10–20.
- Gatenby and Gillies (2008) Gatenby, R., Gillies, R., 2008. A microenvironmental model of carcinogenesis. Nat. Rev. Cancer 8 (1), 56–61.
- Gatenby and Gawlinski (1996) Gatenby, R. A., Gawlinski, E. T., 1996. A reaction-diffusion model of cancer invasion. Cancer Res 56 (31), 5745–5753.
- Gatenby et al. (2009) Gatenby, R. A., Silva, A. S., Gillies, R. J., Frieden, B. R., 2009. Adaptive therapy. Cancer Research 69 (11), 4894–4903.
- Gil and Rodriguez (2016) Gil, J., Rodriguez, T., 2016. Cancer: The transforming power of cell competition. Current Biology 26 (4), R164–R166.
- Gillet and Gottesman (2010) Gillet, J.-P., Gottesman, M. M., 2010. Mechanisms of multidrug resistance in cancer. Methods Mol Biol 596, 47–76.
- Glasspool et al. (2006) Glasspool, R., Teodoridis, J. M., Brown, R., 2006. Epigenetics as a mechanism driving polygenic clinical drug resistance. Br. J. Cancer 94 (8), 1087–1092.
- Gottesman (2002) Gottesman, M. M., 2002. Mechanisms of cancer drug resistance. Annu Rev Med 53, 615–627.
- Gottesman et al. (2002) Gottesman, M. M., Fojo, T., Bates, S. E., 2002. Multidrug resistance in cancer: Role of ATP-dependent transporters. Nat. Rev. Cancer 2 (1), 48–58.
- Grasedyck et al. (2013) Grasedyck, L., Kressner, D., Tobler, C., 2013. A literature survey of low-rank tensor approximation techniques. GAMM Mitteilungen 36 (1), 53–78.
- Gupta et al. (2011) Gupta, P. B., Fillmore, C. M., Jiang, G., Shapira, S. D., Tao, K., Kuperwasser, C., Lander, E. S., 2011. Stochastic state transitions give rise to phenotypic equilibrium in populations of cancer cells. Cell 146 (4), 633–644.
- Hanahan and Weinberg (2011) Hanahan, D., Weinberg, R. A., 2011. Hallmarks of cancer: the next generation. Cell 144 (5), 646–674.
- Hillen and Lewis (2014) Hillen, T., Lewis, M., 2014. Managing Complexity, Reducing Perplexity - Modeling biological systems. Springer, Ch. Mathematical ecology of cancer, pp. 13–25.
- Housman et al. (2014) Housman, G., Byler, S., Heerboth, S., Lapinska, K., Longacre, M., Snyder, N., Sarkar, S., 2014. Drug Resistance in Cancer : An Overview. Cancers 6, 1769–1792.
- Jonsson et al. (2017) Jonsson, V. D., Blakely, C. M., Lin, L., Asthana, S., Matni, N., Olivas, V., Pazarentzos, E., Gubens, M. A., Bastian, B. C., Taylor, B. S., Doyle, J. C., Bivona, T. G., 2017. Novel computational method for predicting polytherapy switching strategies to overcome tumor heterogeneity and evolution. Scientific Reports 7 (44206), 1–14.
- Kalemkerian et al. (2012) Kalemkerian, G., Akerley, W., Bogner, P., Borghaei, H., Chow, L., Downey, R., Gandhi, L., Ganti, A., Govindan, R., et al., 2012. Non-small cell lung cancer. Journal of the National Comprehensive Cancer Network 10 (10), 1236–1271.
- Kimmel et al. (1998) Kimmel, M., Swierniak, A., Polanski, A., 1998. Infinite-dimensional model of evolution of drug resistance of cancer cells. J. Math. Syst. Estim. Control 8, 1–16.
- Komarova (2006) Komarova, N., 2006. Stochastic modeling of drug resistance in cancer. Theor. Popul. Biol. 239 (3), 351–366.
- Lavi et al. (2012) Lavi, O., Gottesman, M. M., Levy, D., 2012. The dynamics of drug resistance: A mathematical perspective. Drug Resist. Updates 15 (1-2), 90–97.
- Lorz et al. (2015) Lorz, A., Lorenzi, T., Clairambault, J., Escargueil, A., Perthame, B., 2015. Modeling the effects of space structure and combination therapies on phenotypic heterogeneity and drug resistance in solid tumors. Bull Math Biol 77, 1–22.
- Lorz et al. (2013) Lorz, A., Lorenzi, T., Hochberg, M. E., Clairambault, J., Perthame, B., 2013. Populational adaptive evolution, chemotherapeutic resistance and multiple anti-cancer therapies. Esaim Math Model Numer Anal 47, 377–399.
- Lorz et al. (2011) Lorz, A., Mirrahimi, S., Perthame, B., 2011. Dirac mass dynamics in multidimensional nonlocal parabolic equations. Communications in Partial Differential Equations 36 (6), 1071–1098.
- Maley et al. (2017) Maley, C. C., Aktipis, A., Graham, T. A., Sottoriva, A., Boddy, A. M., Janiszewska, M., Silva, A. S., Gerlinger, M., Yuan, Y., Pienta, K. J., et al., 2017. Classifying the evolutionary and ecological features of neoplasms. Nat. Rev. Cancer 17 (10), 605–619.
- Marusyk et al. (2012) Marusyk, A., Almendro, V., Polyak, K., 2012. Intra-tumour heterogeneity: a looking glass for cancer? Nat. Rev. Cancer 12 (5), 323–334.
- Masui et al. (2013) Masui, K., Gini, B., Wykosky, J., Zanca, C., Mischel, P. S., Furnari, F. B., Cavenee, W. K., 2013. A tale of two approaches: Complementary mechanisms of cytotoxic and targeted therapy resistance may inform next-generation cancer treatments. Carcinogenesis 34 (4), 725–738.
- Medema (2013) Medema, J. P., 2013. Cancer stem cells: the challenges ahead. Nat. Cell Biol. 15 (4), 338–344.
- Merlo et al. (2006) Merlo, L., Pepper, J., Reid, B., Maley, C., 2006. Cancer as an evolutionary and ecological process. Nat. Rev. Cancer 6, 924–935.
- Michor et al. (2006) Michor, F., Nowak, M. A., Iwasa, Y., 2006. Evolution of Resistance to Cancer Therapy. Curr. Pharm. Des. 12, 261–271.
- Misale et al. (2015) Misale, S., Bozic, I., Tong, J., Peraza-Penton, A., Lallo, A., Baldi, F., Lin, K. H., Truini, M., Trusolino, L., Bertotti, A., Di Nicolantonio, F., Nowak, M. A., Zhang, L., Wood, K. C., Bardelli, A., 2015. Vertical suppression of the EGFR pathway prevents onset of resistance in colorectal cancers. Nature Communications 6, 1–9.
- Mok et al. (2009) Mok, T. S., Wu, Y.-L., Yu, C.-J., Zhou, C., Chen, Y.-M., Zhang, L., Ignacio, J., Liao, M., Srimuninnimit, V., et al., 2009. Randomized, placebo-controlled, phase II study of sequential Erlotinib and chemotherapy as first-line treatment for advanced non-small-cell lung cancer. Journal of Clinical Oncology 27 (30), 5080–5087.
- Moreno (2008) Moreno, E., 2008. Is cell competition relevant to cancer? Nature Reviews Cancer 8 (2), 141–147.
- Moreno et al. (2002) Moreno, E., Basler, K., Morata, G., 2002. Cells compete for decapentaplegic survival factor to prevent apoptosis in Drosophila wing development. Nature 416, 755–759.
- Mumenthaler et al. (2015) Mumenthaler, S. M., Foo, J., Choi, N. C., Heise, N., Leder, K., Agus, D. B., Pao, W., Michor, F., Mallick, P., 2015. The impact of microenvironmental heterogeneity on the evolution of drug resistance in cancer cells. Cancer Informatics 14, 19–31.
- Murray (2002) Murray, J., 2002. Mathematical Biology. Springer-Verlag.
- Peng et al. (2016) Peng, L., Trucu, D., Lin, P., Thompson, A., Chaplain, M. A. J., 2016. A multiscale mathematical model of tumour invasive growth. Bull. Math. Biol. 79 (3), 389–429.
- Perthame and Barles (2008) Perthame, B., Barles, G., 2008. Dirac concentrations in Lotka-Volterra parabolic PDEs. Indiana Univ. Math. J. 57 (7), 3275–3301.
- Perthame et al. (2014) Perthame, B., Quirós, F., Vázquez, J. L., 2014. The Hele-Shaw asymptotics for mechanical models of tumor growth. Arch. Rational Mech. Anal. 212 (1), 93–127.
- Piretto et al. (2018) Piretto, E., Delitala, M., Ferraro, M., 2018. Combination therapies and intra-tumoral competition: Insights from mathematical modeling. Journal of Theoretical Biology 446, 149–159.
- Pisco et al. (2013) Pisco, A. O., Brock, A., Zhou, J., Moor, A., Mojtahedi, M., Jackson, D., Huang, S., 2013. Non-darwinian dynamics in therapy-induced cancer drug resistance. Nat. Commun 4, 2467.
- Ribeiro et al. (2012) Ribeiro, J. T., Macedo, L. T., Curigliano, G., Fumagalli, L., Locatelli, M., Dalton, M., Quintela, A., Carvalheira, J. B., Manunta, S., Mazzarella, L., Brollo, J., Goldhirsch, A., 2012. Cytotoxic drugs for patients with breast cancer in the era of targeted treatment: Back to the future? Annals of Oncology 23 (3), 547–555.
- Roose et al. (2007) Roose, T., Chapman, S. J., Maini, P. K., 2007. Mathematical models of avascular tumor growth. Siam Review 49 (2), 179–208.
- Sharma et al. (2010) Sharma, S. V., Lee, D. Y., Li, B., Quinlan, M. P., Takahashi, F., Maheswaran, S., McDermott, U., Azizian, N., Zou, L., Fischbach, M. A., 2010. A chromatin-mediated reversible drug-tolerant state in cancer cell subpopulations. Cell 141 (1), 69–80.
- Simpson (1979) Simpson, P., 1979. Parameters of cell competition in the compartments of the wing disc of Drosophila. Dev. Biol. 69, 182–193.
- Slingerland et al. (2012) Slingerland, M., Guchelaar, H., Gelderblom, H., 2012. Liposomal drug formulations in cancer therapy: 15 years along the road. Drug Discov. Today 17, 160–166.
- Suijkerbuijk et al. (2016) Suijkerbuijk, S., Kolahgar, G., Kucinski, I., Piddini, E., 2016. Cell competition drives the growth of intestinal adenomas in Drosophila. Curr. Biol. 26, 428–438.
- Swierniak et al. (2009) Swierniak, A., Kimmel, M., Smieja, J., 2009. Mathematical modeling as a tool for planning anticancer therapy. Eur. J. Pharmacol. 625 (1-3), 108–121.
- Teicher (2006) Teicher, B. A., 2006. Cancer Drug Resistance. Humana Press, Totowa, N.J.
- Trédan et al. (2007) Trédan, O., Galmarini, C. M., Patel, K., Tannock, I. F., 2007. Drug resistance and the solid tumor microenvironment. J. Natl. Cancer Inst. 99, 1441–1454.
- Vivarelli et al. (2012) Vivarelli, S., Wagstaff, L., Piddini, E., 2012. Cell wars: regulation of cell survival and proliferation by cell competition. Essays Biochem. 53, 69–82.
- Wagstaff et al. (2013) Wagstaff, L., Kolahgar, G., Piddini, E., 2013. Competitive cell interactions in cancer: a cellular tug of war. Trends Cell Biol. 23, 160–167.
- Wosikowski et al. (2000) Wosikowski, K., Silverman, J. A., Bishop, P., Mendelsohn, J., Bates, S. E., 2000. Reduced growth rate accompanied by aberrant epidermal growth factor signaling in drug resistant human breast cancer cells. Biochimica et Biophysica Acta 1497 (2), 215–226.
- Yoon et al. (2018) Yoon, N., Velde, R., Marusyk, A., Scott, J., 2018. Optimal therapy scheduling based on a pair of collaterally sensitive drugs. Bull Math Biol, 1–34.
- Zhang et al. (2012) Zhang, Z., Lee, J. C., Lin, L., Olivas, V., Au, V., Abdel-rahman, M., Wang, X., Levine, A. D., Kyung, J., Choi, Y. J., Choi, C.-m., Kim, S.-w., Jang, S. J., Park, Y. S., Kim, W. S., Lee, D. H., Lee, J.-s., Miller, V. a., Arcila, M., 2012. Activation of the AXL kinase causes resistance to EGFR-targeted therapy in lung cancer. Nat. Genet. 44, 852–860.