Magnetic, electronic and transport properties of high-pressure-synthesized chiral magnets Mn1-xRhxGe (B20)
Abstract
We report on structural, magnetic and transport properties of a new set of the high-pressure-synthesized compounds Mn1-xRhxGe () with the chiral magnetic ordering. The magnetic and transport properties depend substantially on the concentration of rhodium () and the pressure. The saturation magnetic moment corresponds to a known high-spin value for pristine MnGe () and decreases almost linearly with increasing concentration . In addition, XMCD spectra taken at 10 K and 2 T indicate magnetic polarization of the Rh electron states and Ge states, which decreases with , too. In rhodium rich compounds () the temperature of the magnetic ordering increases significantly with pressure, whereas in manganese rich compounds () the temperature decreases. Three different tendencies are also found for several structural and transport properties. In the intermediate range () samples are semiconducting in the paramagnetic phase, but become metallic in the magnetically ordered state. We carried out density-functional calculations of Mn1-xRhxGe at various concentrations and traced the evolution of electronic and magnetic properties. The calculation results are in good agreement with the measured magnetic moments and qualitatively explain the observed trends in transport properties.
pacs:
I INTRODUCTION
The discovery of bulk metal chiral magnets obtained by cobalt doping of a narrow-gap FeSi insulator with a very high anomalous Hall conductivity opens a new arena for spintronics 1 ; 2 and prompts a search for new materials with such non-trivial properties. As another promising material we can mention a metastable high-pressure phase of MnGe, which as FeSi crystallizes in the B20 structure 3 . The high pressure phase of MnGe displaying a large anomalous Hall effect 4 , is a chiral magnet with the Neel temperature = 170 K and the magnetic moment 2.3 ( is the Bohr magneton) at 2 K 5 . Unlike MnSi which demonstrates a quantum critical transition to a non-Fermi-liquid state under pressure 6 ; 7 , the high-pressure phase of MnGe undergoes a two-stage transition. At the first stage (at 6 GPa) the magnetic moment of Mn transforms from a high spin state to a low spin state 8 , while at the second stage at 23 GPa the magnetic moment disappears completing the transition to a paramagnetic phase 9 .
Further research in this direction has become possible recently when on the basis of MnGe a new series of compounds - Mn1-xFexGe with has been synthesized under high pressure 10 . It has been found that the Mn1-xFexGe compounds crystallize in the same B20 structure and are magnetically ordered through the whole range of concentration. Small-angle neutron scattering reveals a ferromagnetic-like transition at 10 , where a short period helical structure characteristic of pure MnGe ( nm-1) changes to a long period helical structure characteristic of pure FeGe ( nm-1).
The magnetic structure found for Mn1-xFexGe has been also observed in the Fe1-xCoxGe series 11 . In both these families the substitution involves solely -elements, and the increase of the number of electrons in the band leads to a linear decrease of the cubic lattice constant (Vegard‘s law) 11 . This is not necessarily so if manganese is substituted with a element, for example, with rhodium. The rhodium monogermanide - RhGe - also synthesized at high pressure, has the B20 crystal structure 12 and displays unusual physical properties. It is a weak band ferromagnet with the ordering temperature K, and at temperatures below K the magnetic order in RhGe coexists with the superconductivity 13 .
On the other hand, substituting Mn with Rh in MnGe with chiral magnetic ordering has resulted in the formation of magnetic spin helices with very long periods - ten times more than the period in the pristine compound 14 . At the level of the Rh-substitution, the neutron scattering shows patterns with a double periodicity. In Ref. 14 it has been suggested that the double periodicity reveals the presence of magnetic “twist grain boundary” phases, involving a dense short-range correlated network of magnetic screw dislocations.
In the present work we continue a comparative study of MnGe and RhGe and report on structural, magnetic and transport properties of a new set of the Mn1-xRhxGe compounds with the chiral magnetic ordering. Our main goal is the study of the evolution of physical characteristics when Mn is substituted with Rh. The paper is organized as follows. In Sec. II we give technical details of experimental techniques and theoretical calculations for these compounds. Experimental results are presented in Sec. III, followed by the density functional calculations and discussion, Sec. IV. In Sec. V we summaries the conclusions.
II EXPERIMENT AND THEORY
Polycrystalline samples of Mn1-xRhxGe cubic phase were synthesized at 8 GPa and 1500 -1700 K using toroidal high-pressure apparatus 15 by melting Mn, Rh and Ge 16 . The purity was 99.9% for Mn, 99.99% for Rh and 99.999% for Ge. The phase remains metastable after the pressure release. The crystal structure of samples was examined by x-ray diffraction (XRD). Measurements were performed at room temperature and ambient pressure using the diffractometer STOE IPDS-II (Mo-K) and Guinier camera e G670, Huber (Cu-K).
Magnetic properties were measured with VSM inserted in the PPMS. The electrical resistivity measurements were performed on bulk polycrystalline samples using a lock-in detection technique (SR830 lock-in amplifier) in the temperature range of 2 - 300 K. The magnetic ac-susceptibility was studied at pressures up to 6 GPa and temperatures down to 1.3 K with the use of a miniature clamped toroid-type device 17 . Samples and pressure gauge (Pb) were placed in a Teflon capsule filled with liquid in this case.
Magnetic susceptibilities at high pressure were measured with the SR830 lock-in amplifier in home-made small coils placed inside teflon capsules filled with liquid. In all experiments the geometry of coils and the sample size were approximately the same. In this case a quantitative comparison between magnetic susceptibilities of different samples is possible though they are measured in arbitrary units (lock-in output voltage).
The x-ray absorption experiments were carried out at ID12 beamline at the European Synchrotron Radiation Facility (ESRF). The beamline is dedicated to polarization dependent x-ray-absorption studies18 in the energy range from 2 to 15 keV, that covers -edges of Mn and Ge as well as absorption edges of Rh. Sources of circularly polarized x-rays were helical undulators either of Helios-II type for experiments at Rh or of Apple-II type for measurements at the -edges of Mn and Ge. The spectra are recorded using total fluorescence yield detection mode in backscattering geometry. A magnetic field (up to 9 T) generated by a superconducting solenoid was applied along the x-ray beam direction and ensured a complete magnetic saturation of the samples at a temperature of 10 K. Magnetic saturation was additionally verified by recording so-called element-specific magnetization curves, i.e. intensity of XMCD at a given absorption edge as a function of applied magnetic field. To make sure that XMCD results are free of eventual experimental artifacts, the spectra were recorded by changing the helicity of the incoming x-rays for both parallel and antiparallel direction of the magnetic field.
Our computations are based on the density functional theory (DFT). We used the first-principles pseudopotential method as implemented in the Quantum Espresso package 19 , with the exchange-correlation functional taken within generalized-gradient approximation (GGA) by Perdew-Burke-Ernzerhof (PBE) 20 . We employed the projected-augmented-wave (PAW) type scalar-relativistic pseudopotentials from the SSSP library 21 , with the valence electron configurations of , , and for Mn, Rh, and Ge, respectively. The integration over the irreducible Brillouin zone (BZ) for the electron density of states computation was performed on a uniform grid of -points. The B20 unit cell contains four formula units of Mn1-xRhxGe, that is four transition metal (TM) atoms and four metalloid atoms. For , and 3/4, the due number of equivalent Mn atoms in the cell were replaced by Rh atoms. For and 7/8 we used a supercell containing eight formula units. For , the supercell Mn16Rh15Ge16 was used. The plane wave cutoff of 100 Ry was chosen, which gives the total energy convergence better than 10-8 Ry. For each composition, the equilibrium value of system‘s lattice constant was defined as the one corresponding to zero pressure. The geometry relaxation was performed, until the residual atomic forces were converged down to 3 meV/Å. The optimized internal atomic positions for MnGe are and (experimental values are 0.136 and 0.846), and for RhGe and (experimental values are 0.128 and 0.834). Fermi surface (FS) plots were generated using the XCrysDen software 22 . Running ahead of discussion, we note that the structural and electronic properties of pure MnGe calculated here are in excellent agreement with those obtained in 23 using the LAPW+lo method (Wien2k package) that is basically different from our approach.
III MEASUREMENT RESULTS
III.1 Crystal structure
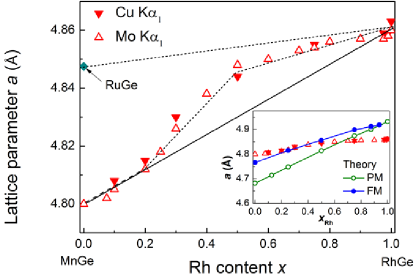
We have found that in the whole range of concentrations , the Mn1-xRhxGe compounds are crystallographically equivalent. All of them are crystallized in the same B20 cubic structure. In previous studies of the B20 systems Mn1-xFexGe 10 , Fe1-xCoxGe 11 and Mn1-xCoxGe 24 ; 25 , which are solid solutions of MnGe, FeGe and CoGe (monogermanides of 3d-metals), the linear change of the cubic lattice constant with has been observed (Vegard‘s law). In contrast to these -solid solutions, Mn1-xRhxGe demonstrates an appreciable deviation from Vegard‘s law, FIG. 1. Starting with the lattice constant values for and , one can draw the expected linear dependence for , shown in FIG. 1 by black solid line. We see that the actual lattice constant function follows Vegard‘s law only up to . At concentrations , the dependence of on changes. Now it lies close to another (dotted black) line, , which connects data for RuGe and RhGe, FIG. 1. Clearly, this is the change from the 3d dependence to the 4d one, since both Ru and Rh are 4d elements. Concentrations between and represent a transition region between 3d and 4d regimes. FIG. 1 describes a peculiarity of the Mn1-xRhxGe system which holds for its other properties. It implies that properties of the manganese-rich samples () differ from the rhodium-rich samples ().
III.2 Magnetic properties
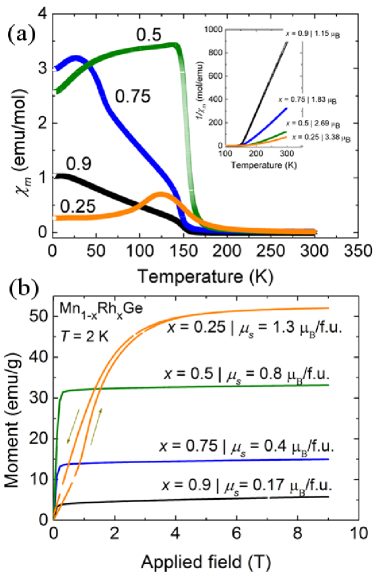
The temperature dependencies of the magnetic susceptibility () of Mn1-xRhxGe for some representative concentrations are presented in FIG. 2 (a). In the Mn-rich side () the temperature dependence of susceptibility is similar to that of MnGe. With the increase of the rhodium concentration the broad peak signaling the onset of a chiral magnetic order is shifted down. For Mn0.75Rh0.25Ge this maximum is located at K whereas for pristine MnGe it is at K. At the sharp step-like rise of the magnetic susceptibility at K manifests the formation of the ferromagnetic-like order. FIG. 2 (b) shows the field dependence of the Mn1-xRhxGe magnetization. Notice, that between and there is a qualitative change of the plot shape. In the Mn-rich side (as in pristine MnGe) the field-induced ferromagnetic state appears only at high fields above 5 T 4 ; 16 , whereas at the magnetic moment saturates already at low fields 0.1-0.3 T.
Though the magnetic properties of Mn1-xRhxGe are quite different for and for , both the effective magnetic moment found by fitting (insert in FIG. 2 (a)) and the saturation moment (FIG. 2 (b)) change nearly linearly through the whole range of rhodium concentrations, FIG. 3.
III.3 Transport properties
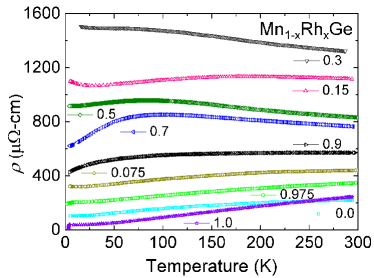
The electric transport properties of Mn1-xRhxGe (FIG. 4) exhibit unusual variation on going from to . Both end members of a series MnGe and RhGe are metals with a moderate value of resistivity at room temperature cm. RhGe is a superconductor below K. The addition of rhodium to MnGe produces the increase of resistivity of Mn1-xRhxGe and appearance of semiconducting behavior of for . The deviation from semiconducting behavior to metallicity for and seems to be correlated with the transition to the ferromagnetic state. It looks like Mn1-xRhxGe compounds at intermediate become semimetals or narrow gap semiconductors in the paramagnetic state. The transition to the magnetic state moves them to the metallic state. This unusual behavior of the electric transport properties indicates on the qualitative changes of the band structure of Mn1-xRhxGe in the paramagnetic and magnetically ordered state when rhodium concentration changes from to .
The dependence of Seebeck coefficient on the rhodium concentration in Mn1-xRhxGe is shown in FIG. 5. While MnGe has a positive value of V/K indicating the dominant role of hole carriers, RhGe has a negative value of V/K with electron carriers. The remarkable feature of this dependence is the presence of three distinct regions and the clear borders between them where Seebeck coefficient exhibits appreciable changes. With the increase of rhodium concentration from to the value of decreases and approaches zero at . But at increases suddenly to the value of half of that of MnGe. Between and (the second region) decreases linearly and approaches zero again at . On further increase of from 0.8 to 0.9, the Seebeck coefficient increases sharply to 15 V/K. The strongest changes of Seebeck coefficient are observed between and from +15 V/K to -25 V/K. It changes sign between and . The anomalous behavior of at and is discussed further in Sec. IV where it is related with the electron density of states (DOS) at the Fermi level.
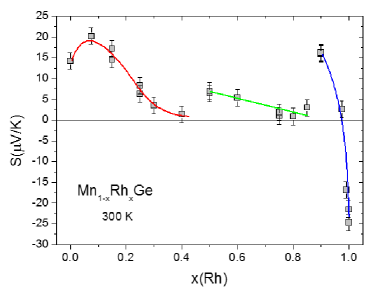
It is worth mentioning that a large negative Seebeck coefficient has been reported in non-magnetic CoGe 26 and CoSi 27 , which are isovalent with RhGe. Furthermore, changes from a large negative to a large positive value at low hole doping when cobalt is substituted with iron (i.e. in Co1-xFexGe and Co1-xFexSi). We observe the same behavior in Mn-doped RhGe (FIG. 5).
III.4 Pressure Effect
Temperature dependences of the magnetic susceptibility () of Mn1-xRhxGe for various rhodium concentrations () at different pressures are presented in FIG. 6a, b, c, d, e, correspondingly. Notice that the magnetic ordering temperature of Mn1-xRhxGe is very different for the regions (FIG. 6a, b, c) and (FIG. 6d, e, f). In FIG. 6a () and FIG. 6 b () we see that exhibits a broad peak at a certain (Neel) temperature . With increasing pressure the peak value () decreases while is shifted to lower temperatures. Earlier this behavior has been observed in MnGe 8 . (In fact, at where is a more complex pressure dependencies. The behavior discussed above holds only at high pressures [ GPa] while at low pressures [ GPa] the changes in and are reversed. We consider this as a precursor of the tendency.)
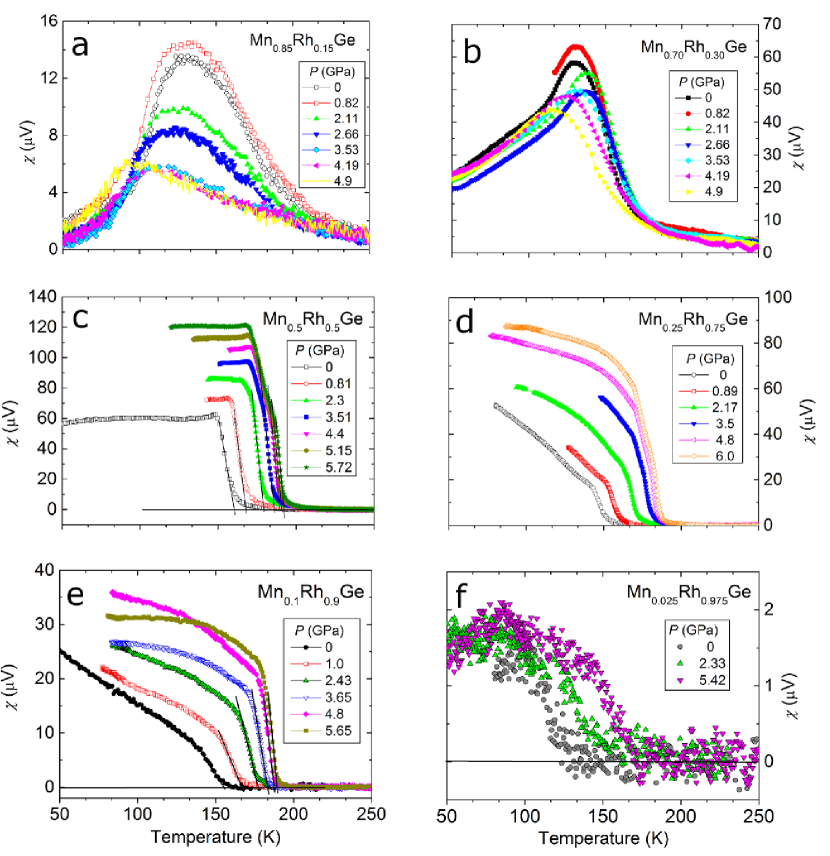
The susceptibility behavior is completely changed in the range , FIG. 5c, d, e, where demonstrates a step-like temperature dependence at the transition temperature . At remains approximately constant at , FIG. 6c. At , (FIG. 6d and 6e) in the region increases with decreasing temperature. The character of pressure dependency of at is also changed: with increasing pressure is shifted up while increases.
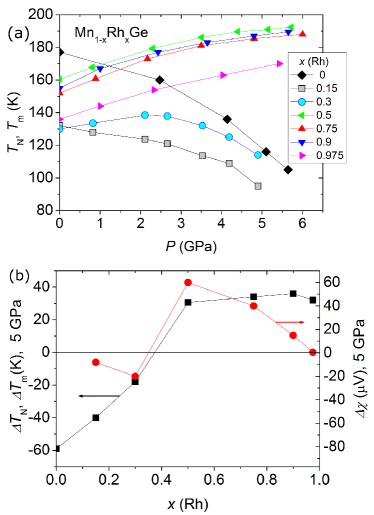
Two different types of pressure dependencies of Mn1-xRhxGe are clearly illustrated in FIG. 7a and 7b. FIG. 7a shows the pressure dependencies of for concentrations (type I) and for (type II). FIG. 7b shows the rhodium concentration dependence of the quantity or [black line with black squares] and the quantity [red line and red circles], where GPa. Thus, [or ] and signify a change of these pressure derived quantities with . From FIG. 7a we clearly see two types of dependencies: decreasing temperature values of for and monotonically increasing values of for . FIG. 7b also demonstrates the two types of tendencies, the first region with negative values of and at and the second with the positive values of and at .
III.5 XANES and XMCD measurements
Experimental XANES and XMCD spectra at the -edge of Mn, -edge of Rh and -edge of Ge are presented in FIGs. 8, 9 and 10, respectively. The spectra have been corrected for self-absorption effects and for the incomplete circular polarization rate: 0.05 at the edge of Rh, 0.85 at the Mn -edge and 0.95 at the -edge of Ge. The XANES and XMCD spectra provide information on the electronic and magnetic properties of Mn, Rh and Ge atoms in Mn1-xRhxGe.
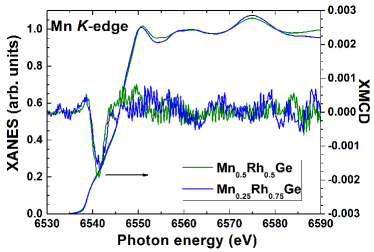
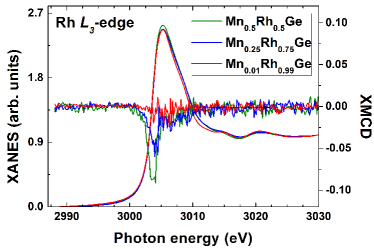
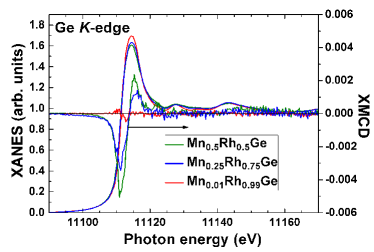
One can see on FIG. 8 that the XANES spectra recorded at the Mn -edge for samples with and have a very similar spectral shape. This indicates that the valence state of the Mn atoms changes barely if at all between these two samples. Unfortunately, the XANES spectrum could not be recorded for the sample with due to a very strong fluorescence and x-ray scattering background signal. The samples with and exhibit sizeable XMCD signals at the -edge of Mn under 2 T field and at temperature of 10 K. The normalized amplitude and the spectral shape of XMCD signals shown on FIG. 8 are also similar for both samples. It implies that the magnetic moment carried by Mn atoms remains nearly the same for both samples. This observation is in good agreement with the results of present DFT-calculations. XANES and XMCD spectra recorded at the -edge of Rh for all three samples are reproduced on FIG. 9. The XANES spectra for all three samples look rather similar. It shows that there are no significant changes in the occupation of states of Rh with concentration, even though some minor increase in number of holes is present in the sample with . The negative sign of the XMCD signal at the absorption edge indicate that the induced magnetic moment of Rh is parallel to an applied magnetic field and, therefore, to the magnetic moment of Mn 29 . Unfortunately, the presence of a strong diffraction peak around keV prevents us from measuring “clean” XANES and XMCD spectra at the -edge of Rh. Consequently, we could not use the sum rules analysis to determine the spin and orbital magnetic moments induced in shells of Rh atoms. However, the intensity of XMCD signals at the -edge of Rh for all three samples follows the experimentally measured values of macroscopic magnetization. To get further insight into magnetism of Rh in the studied samples we exploit XMCD recorded on a reference system for the induced magnetic moment on Rh, namely FeRh films 30Rogalev . Comparing the present XMCD signals with the reference one, we could estimate the induced magnetic moment carried by Rh atoms to be about +0.1 in Mn0.5Rh0.5Ge, +0.06 in the sample with whereas it is below 0.01 , if any, in Mn0.01Rh0.99Ge sample. The XANES and XMCD spectra measured at the Ge -edge for all three samples are shown on FIG. 10. The XANES spectra show some changes in the white-line intensity at the Ge -edge, which could be attributed to a minor changes in the occupation of the states of Ge with increase of concentration of Mn. The XMCD spectra for and 0.75 samples display a dispersive like shape with a negative peak at 11.11 keV. Amplitude of XMCD signals at the Ge -edge is comparable to those at the -edge of Mn and that implies a significant magnetic polarization of the states of germanium, which scales rather well with the macroscopic magnetization. In Mn0.01Rh0.99Ge with a very weak total magnetization, the XMCD signal is at the detection limit. Thus, XMCD results show that induced magnetic moments on both Rh and Ge atoms are closely related to the exchange field due to Mn magnetic moments.
IV CALCULATION RESULTS AND DISCUSSION
We calculated in detail the electronic properties of the system Mn1-xRhxGe for changing from 0 to 1, with and without taking account of the spin polarization. The experimentally measured helix pitch is very large in comparison with lattice parameter, therefore our spin-polarized calculations were done using a simple model of collinear ferromagnetism. Both nonmagnetic and magnetic solutions are obtained for all the compounds, except RhGe that turned out to be nonmagnetic (see below). The cubic lattice parameter a of the system increases with increasing Rh content, as shown in the inset to FIG. 1. This could be expected, because the atomic radius of rhodium is a few percent larger than that of manganese. For the both PM and FM states, the concentration dependence of lattice parameter, , is practically linear, in accordance with Vegard‘s law. Thus, the anomalous behavior of observed experimentally at room temperature (see FIG. 1) is not predicted in our DFT calculations. Note that the dependence for Mn1-xRhxGe in the FM state has been previously calculated at 14 .
The theoretical lattice parameter a of nonmagnetic RhGe (4.931 Å) exceeds the experimental one by 1.5%, which is acceptable accuracy within DFT-GGA approach. Our results for pure RhGe partially published in Ref. 30 are consistent with the theoretical data 13 . For the compounds Mn1-xRhxGe in the FM state, a disagreement between the theoretical and experimental curves a(x) is within uncertainty of measurements and calculations (for MnGe, Å is only 0.5% less than the measured value of 4.79 Å 31 ). The same is true for the PM state at . At the same time, the calculated a value is strongly underestimated for the Mn-rich side of the series Mn1-xRhxGe. The lattice parameter of PM MnGe ( Å) is by 2.6% smaller than the room-temperature value ( 2.2% as compared with a value extrapolated to low temperatures using the experimental thermal expansion 31 . Similar results for pure MnGe in the PM and FM states have been obtained in the DFT calculations 23 ; 32 . Such a deviation is understandable, because correlation effects are important in systems with partially filled bands, especially in the middle of the period, moreover, these effects are stronger for Mn, than for other -metals 33 . It is also well known that the DFT-calculated atomic volume and bulk modulus of manganese (and some Mn-based compounds) are respectively, underestimated and overestimated in non-spin-polarized calculations, but become more reasonable if spin polarization is taken into account 34 . At the same time, such calculations of systems provide rather good agreement with experiment. Reliable values of a on the Mn-rich side of Mn1-xRhxGe in the PM state can be obtained within ‘beyond-DFT‘ approaches (such as DMFT) not used here.
The theoretical bulk modulus of MnGe is known to be of 133 GPa, which exceeds the available experimental value of 106 GPa (see Ref. 8 and references therein). Our approximate estimate gives GPa for RhGe and 154 GPa for Mn0.5Rh0.5Ge.
IV.1 Non-spin-polarized calculations
Our calculated densities of states (DOS) of Mn1-xRhxGe in the PM and FM phase are presented in FIGs. 11 and 12a, correspondingly. FIGs. 14 and 15 display the electronic band structure and Fermi surface (FS) at and 0.75. Paramagnetic RhGe is shown separately in FIG. 13 as it represents a prototype for subsequent discussion. As is seen in the figures, the DOS and band structure of paramagnetic MnGe are very similar to those of RhGe. Actually, in both cases they are typical of nonmagnetic B20-type TM monogermanides 23 ; 31 ; 32 and monosilicides 33 ; 34 . This suggests that the electronic structure of B20 compounds is well described in the rigid band approximation, i.e. the position of the bands relative to the Fermi level, , is mainly determined by the electron count, while the general shape of bands remains practically unchanged. When a particular compound contains both the Mn and Rh atoms, the B20 lattice is distorted because of difference in the properties of - and -elements in their properties (atomic size, the space distribution of orbitals, the depth of potential well). Hence at and 0.75, the lattice can be only approximately considered as B20-type (our x-ray data also evidence that in the pseudobinary compounds studied, the B20 reflections are slightly broadened). It is clear that Mn0.5Rh0.5Ge possesses maximal lattice distortion among the compounds considered here.
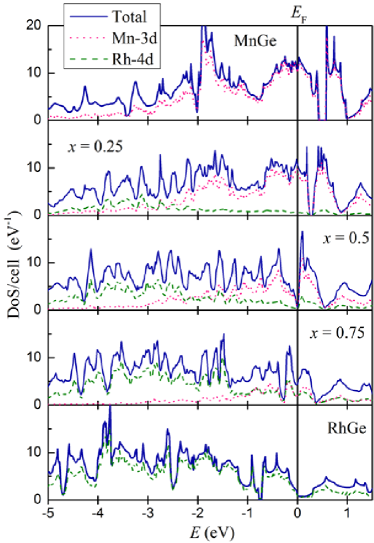
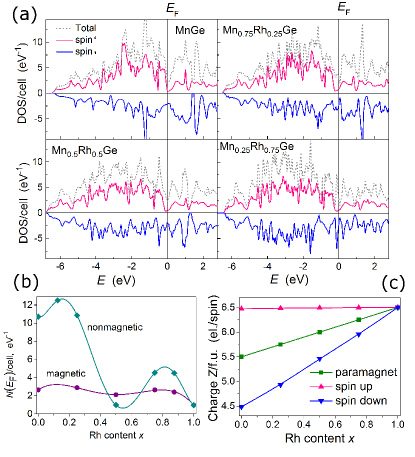
FIG. 11 demonstrates that over the entire energy range, the DOS of Mn1-xRhxGe is contributed mostly by transition-metal d-states hybridized with germanium -states (not shown) with a dominating contribution from the former. At , the contribution from Mn -states exceeds that of Rh -states. The reason is that a more filled -band of Rh lies deeper in energy (manganese has 5 -electrons and rhodium 7; in MnGe and RhGe these values increase respectively, to 6.1 and 8.3 because of a charge transfer from - to -band). Thus, the near-EF states in Mn1-xRhxGe, except for the Rh-rich side, are mainly formed by the electrons originating from the Mn atoms. A striking feature of the DOS in PM MnGe is a symmetry-conditioned gap situated at 0.5 eV above . As the Rh content increases, the gap is shifted towards lower energies and goes down to eV in RhGe. At , it is actually a pseudogap, which is a consequence of increasing lattice distortion. At , the pseudogap falls exactly on the Fermi level (FIG. 11c). It is clear if one bears in mind that the electron count of Mn0.5Rh0.5Ge coincides with that of FeGe which is insulating in the PM state 35 .
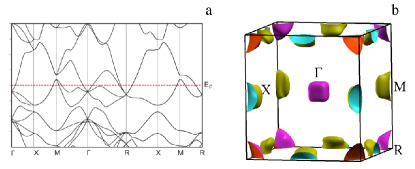
The energy bands of the non-centrosymmetric and non-symmorphic B20 lattice have some symmetry-related peculiarities. For RhGe and MnGe in the PM state, all the bands along the R-X-M-R path (residing in the BZ face) are doubly degenerate and all the states at R point (the zone corner) are four-fold degenerate. Another uncommon feature is three intersecting bands at the zone center (), the middle of which has a zero slope (the electron group velocity ), while the other two possess linear dispersions of equal slope and opposite sign, similar to Dirac cone This -centered triply degenerate state lies just below in RhGe and goes up to +1 eV in MnGe, owing to a smaller lattice parameter and a less filled -band of the latter. At , the degeneracy of bands is lifted by lattice distortion (FIG. 14, left). Owing to the occurrence of zero-velocity bands below (and related van Hove singularity), the Fermi level in RhGe falls on the verge of a wide valley of the DOS (FIG. 11e). The Fermi surface of RhGe (FIG. 12b) consists of -centered electron-like pockets related to the three crossing bands, R-centered electron-like pockets, and hole-like pockets at the M point (middle of the zone edge). Notice that the FS of RhGe compressed to 8 GPa 30 is analogous to that of isovalent nonmagnetic CoGe 23 , which is a consequence of a smaller atomic size of Co.
The FS of MnGe in the PM state (FIG. 15, left) consists of R-centered electron-like pockets and three large hole-like concentric voids on (shown transparent for clarity), the outer of which is open along the -X direction (X denotes the center of BZ face). Inspection of the figure from top to bottom shows that the FS in the PM state dramatically changes with increasing . At , the FS with its tiny hole- and electron-like pockets and a minimal charge-carrier density resembles that of semimetals. It only exists thanks to a very small indirect overlap of two bands near (see FIG. 14, left) corresponding to a pseudogap at . Upon further increase in , a more metallic character of FS returns. In general, an increase in Rh content causes various void- and neck-type electronic topological transitions, which are expected to manifest themselves in anomalous concentration dependencies of electrical resistivity and thermopower.
According to our non-spin-polarized calculations, the least symmetric compound Mn0.5Rh0.5Ge in the PM state exhibits the worst metallic properties among the considered compositions. Qualitatively, this finding does not contradict to the semiconductor-like -dependence of electrical resistivity observed in Mn1-xRhxGe above , as lies in the interval (FIG. 4). A qualitative correlation also exists between -dependencies of the room-temperature Seebeck coefficient (FIG. 5) and the DOS at the Fermi level in the PM state (green curve in FIG. 12b). The exception is represented by RhGe that possesses an anomalously large negative Seebeck coefficient that becomes large positive at a low hole doping when manganese substitutes for rhodium. An analogous behavior of was observed for hole-doped B20-CoGe in Ref. 26 , where was calculated using the semi-classical Boltzmann approach within the relaxation-time approximation 37 . It was demonstrated 24 that the asymmetry of the density of states related to the triply-degenerate bands just below is a crucial factor to enhance . In the near future we are about to quantitatively study the transport properties of Mn1-xRhxGe using appropriate software.
IV.2 Spin-polarized calculations
FIG. 12a displays the spin-majority (also denoted as ‘up‘ or ‘‘), spin-minority (‘down‘ or ‘‘), and total (up+down) DOS at and 0.75. Comparison between the concentration dependencies of the total DOS at the Fermi level, , in the PM and FM state is presented in FIG. 12b. Contrary to the dramatic behavior in the PM state, the x-dependence of the total DOS at in the FM state varies smoothly around eV-1, a pronounced dip near absent. The middle and right columns in FIG. 14 show the spin-split bands in the FM case. Let us consider first pure MnGe (upper row). Due to exchange splitting, the up and down subbands in FM MnGe are rigidly shifted respectively, downwards and upwards by eV with reference to the PM case, which yields a magnetization of about 2 /f.u. As a consequence of charge transfer to the low-lying majority bands, the resulting number of spin-up electrons , a value very close to the valence of paramagnetic RhGe per spin, (FIG. 12c). As is seen in the figures, the spin-up DOS, bands, and FS of MnGe are very similar in their shape to those of paramagnetic RhGe. The same is true for all the compounds with .
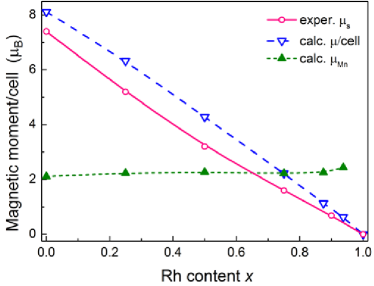
FIG. 3 demonstrates that the total spin magnetic moment of Mn1-xRhxGe scales linearly with (or the valence ). The calculated dependence represents a negative-slope part (so called ‘itinerant‘, usually related with fcc-derived structures) of the Slater-Pauling curve, where the magnetic moment linearly decreases with increasing . In this case, is pinned within a valley of the spin-up DOS, as in RhGe. The valley constrains the number of the spin-up electrons, while the number of spin-down electrons increases proportionally to and hence, so does the magnetic moment 38 .
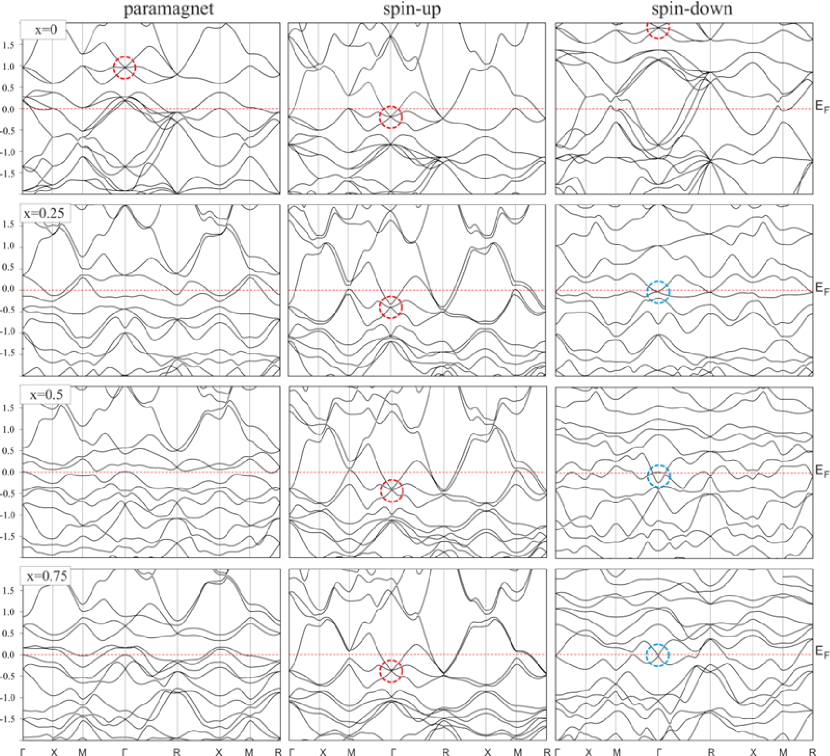
At all , the spin-up bands not only retain stable positions with respect to , but also hold, to a large extent, a specific shape typical of B20 symmetry, while the spin-down bands at are strongly distorted (see FIG. 14). Correspondingly, the triple degeneracy of levels is lifted, and instead, two-fold degenerate states (marked with blue circles) appear near . For example, the spin-down band structure of Mn0.25Rh0.75Ge is characterized by the intersection at of two bands with close-to-linear dispersions of opposite sign (Dirac-like crossing point). These features deserve special consideration as a candidate 3D Dirac (or Weyl) points and will be the subject of future study.
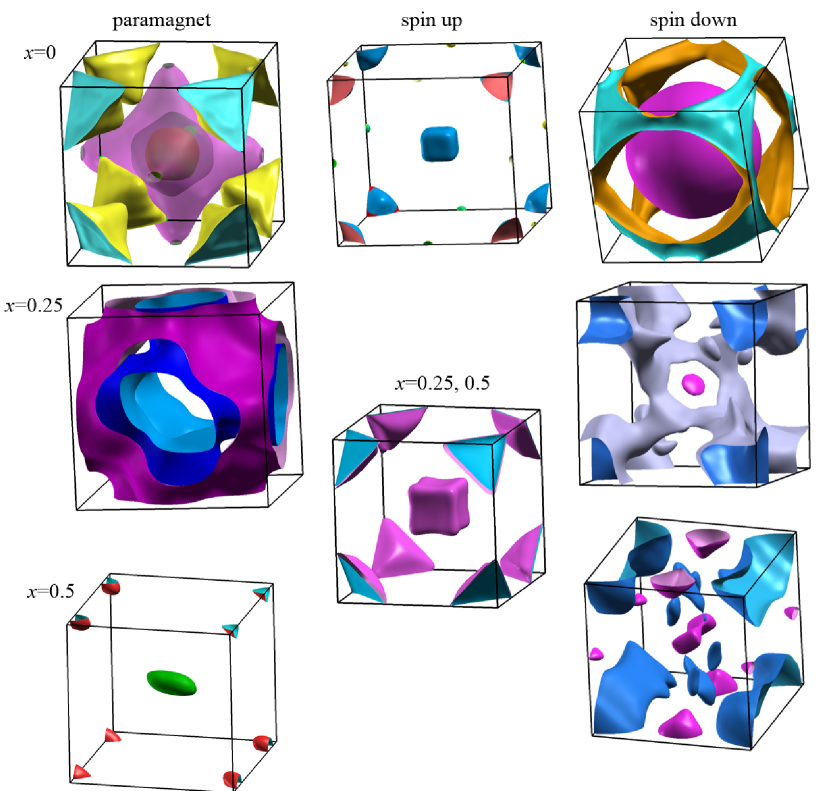
The spin-resolved Fermi surfaces of magnetic Mn1-xRhxGe are presented in the middle and right columns of FIG. 15. The spin-up FSs are topologically equivalent to that of paramagnetic RhGe in FIG. 13b, with moderate variations in size of pockets around , R and M points. At , the low-symmetry spin-down FSs consist of many irregular-shaped fragments, which reflects the growing lattice distortion. Again, we refer to paper 23 , where the spin-up DOS, band structure, and FS of ferromagnetic MnGe and FeGe have been found similar to those of paramagnetic CoGe (isovalent to RhGe). To this we can add that the spin-down DOS, band structure, and FS of ferromagnetic FeGe coincide in every detail with those of paramagnetic MnGe calculated here and shown in FIGs. 11, 14 and 15.
As mentioned above, Mn0.5Rh0.5Ge in the PM state is a semimetal very close to an indirect-gap semiconductor. Our spin-polarized calculations demonstrate metallic character of the DOS, band structure and FS for all the considered compounds in the FM state, including Mn0.5Rh0.5Ge. The onset of metallicity in Mn0.5Rh0.5Ge at the transition to magnetic state is similar to the case of compressed isovalent FeGe, where collapse of magnetic moment has been found to coincide with a metal-to-semiconductor transition 35 .
Even in case of disagreement between the measured and calculated lattice parameters, the magnitude of magnetic moment is known to be fairly well reproduced in standard DFT calculations. Here, the theoretical and experimental dependencies well agree to each other (see FIG. 3), a small systematic excess of calculated above measured values is most probably due to the approximation of collinear magnetism used in our calculation. The theoretical spin moment localized on Mn site, , very slightly increases with , which corresponds to a lattice expansion due to increasing Rh content. As is seen in FIG. 3, the cell magnetization is localized mostly at manganese atoms and virtually proportional to their number. The magnetic moments induced on the Rh and Ge sites (not shown in the figure) decrease with . At all , they are relatively small in magnitude (, ) and parallel and antiparallel to , correspondingly. This result is consistent with the measured sign and -dependence of the XMCD signal for Rh and Ge. In addition, we evaluated the magnetic moment on Mn site for Mn0.5Rh0.5Ge as a function of pressure and found that linearly decreases from 2.2 to 2.1 upon compression to 6 GPa.
Our calculations reveal no stable magnetic solution for pure RhGe. Apparently, extremely small magnetization values (/f.u.) observed experimentally in RhGe 13 are below the uncertainty of our calculations. However, within the itinerant magnetism model used here, the magnetization of RhGe is expected to be zero. Furthermore, according to available experimental and theoretical research, the isovalent B20 counterparts RhSi, CoSi, and CoGe are paramagnetic. We suppose that very weak ferromagnetism observed 13 in high-pressure cubic phase of RhGe might be related to disordered moments or lattice defects and cannot be described within the simple band model. A more detailed study of magnetic properties of Mn1-xRhxGe, including non-collinearity is under way, the results will be published elsewhere. In this paper we undertook an initial theoretical investigation of the system Mn1-xRhxGe by means of standard DFT calculations, in an effort to reveal main trends in the concentration behavior of the system and find possible correlations with our experimental results.
V CONCLUSIONS
To summarize, we experimentally studied the structural, magnetic and transport properties, as well as XANES/XMCD spectra, of the series of B20-type compounds Mn1-xRhxGe () synthesized under high pressure of 8 GPa. The system was also investigated theoretically on the basis of ab initio density-functional calculations. An anomalous non-linear concentration dependence of the lattice parameter, , was experimentally found for the high-pressure phases studied. This result is not explained with our DFT calculations, which produce a linear function , according to Vegard‘s law. At the same time, the concentration dependencies of magnetization , both measured in external magnetic field and DFT-calculated, are in rather good agreement to each other and linearly decrease with increasing x. The total magnetization in unit cell is mostly localized on manganese atoms and virtually proportional to their number. The magnetic moment on Mn site () is practically independent of concentration . The significantly smaller magnetic moments on Rh and Ge sites decrease with and are directed parallel and antiparallel to , correspondingly. The comparison with our XMCD measurements of magnetic polarization induced on Rh and Ge atoms shows that our DFT calculations agree with observed sign and -dependence of the XMCD signal for Rh and Ge.
Our measurements of magnetization and magnetic susceptibility reveal that as changes from zero to 0.3, the magnetic ordering temperature decreases from 170 K to 140 K. Upon further increase in rhodium concentration, rises again up to approximately 160 K at and then slowly decreases down to K at . Under external compression up to 6 GPa, it was found that on the Mn-rich side (up to ), , as expected, decreases as a function of pressure P, while at , definitely increases with elevated pressure (by 20% at 6 GPa), the rate of the increase independent of . Indirectly, this result is not confirmed theoretically, because our calculated magnetic moment linearly decreases with pressure. Such a pressure-induced increase in the magnetic ordering temperature is first observed for the B20-type high-pressure phases with helical magnetic structure, in contrast to all other -metal-based monosilicides and monogermanides with B20 structure. This unusual behavior needs a special theoretical justification and will be studied in the future.
The semiconductor-like behavior of electrical resistivity, , observed experimentally for paramagnetic Mn1-xRhxGe at lying in the interval , is qualitatively consistent with our theoretical result that Mn0.5Rh0.5Ge in the PM state is very close to indirect-gap semiconductor, as judged from the shape of its electronic spectrum. Both our experiments and calculations at these intermediate concentrations demonstrate a semiconductor-to-metal transition, upon the occurrence of magnetic order. A qualitative correlation also exists between the concentration dependencies of the room-temperature Seebeck coefficient, , and the density of states at the Fermi level, , in the PM phase. An anomalously large negative Seebeck coefficient measured in RhGe is related to the triply-degenerate electron state, residing just below . Our calculations show that the electronic structure of Mn1-xRhxGe in the both PM and FM states is characterized by the presence near of symmetry-conditioned points of three- and two-fold degeneracy, which deserve special consideration as candidate 3D Dirac (or Weyl) points and will be the subject of future study.
Acknowledgements.
The authors gratefully thank S. M. Stishov for supporting of this work and I. Mirebeau, S. V. Grigoriev, Yu. A. Uspenskii, and A. V. Mikheenkov for valuable discussions. This work was supported by Russian Science Foundation: V. A. Sidorov, A. E. Petrova, D. A. Salamatin and A. V. Tsvyashchenko acknowledge the support of their experimental measurements (grant RSF 17-12-01050) and N. M. Chtchelkatchev is grateful for support of his theoretical calculations (grant RSF 18-12-00438). The support from Russian Foundation for Basic Research (grants 16-02-01122 and 17-02-00725) is also acknowledged. The numerical calculations were carried out using computing resources of the Federal Collective Usage Center Complex for Simulation and Data Processing for Mega-science Facilities at NRC ‘Kurchatov Institute‘, http://ckp.nrcki.ru/. Part of calculations was performed at the cluster of Joint Supercomputing Center, Russian Academy of Sciences.References
- (1) N. Manyala, Y. Sidis, J. F. DiTusa, G. Aeppli, D. P. Young and Z. Fisk, Magnetoresistance from quantum interference effects in ferromagnets. Nature 404, 581-584 (2000).
- (2) N. Manyala, Y. Sidis, J. F. DiTusa, G. Aeppli, D. P. Young and Z. Fisk, Nature materials, 3, 255-262 (2004).
- (3) H. Takizawa, T. Sato, T. Endo, and M. Shimada, J. Solid State Chem. 73, 40 (1988).
- (4) N. Kanazawa, Y. Onose, T. Arima, D. Okuyama, K. Ohoyama, S. Wakimoto, K. Kakurai, S. Ishiwata, and Y. Tokura, Phys. Rev. Lett. 106, 156603 (2011).
- (5) O. L. Makarova, A. V. Tsvyashchenko, G. Andre, F. Porcher, L. N. Fomicheva, N. Rey, and I. Mirebeau, Phys. Rev. B 85, 205205 (2012).
- (6) C. Pfleiderer, S. R. Julian, and G. G. Lonzarich, Nat. (London) 414, 427 (2001).
- (7) S. M. Stishov, A. E. Petrova, Uspekhi Fizicheskikh Nauk 181 (11) 1157 (2011)
- (8) M. Deutsch, O. L. Makarova, T. C. Hansen, M. T. Fernandez-Diaz, V. A. Sidorov, A. V. Tsvyashchenko, L. N. Fomicheva, F. Porcher, S. Petit, K. Koepernik, U. K. Rößler, and I. Mirebeau, Phys. Rev. B 89, 180407(R) (2014).
- (9) N. Martin, M. Deutsch, J.-P. Itiê, J.-P. Rueff, U. K. Rössler, K. Koepernik, L. N. Fomicheva, A. V. Tsvyashchenko, and I. Mirebeau, Phys. Rev. B 93, 214404 (2016).
- (10) S.V. Grigoriev, N.M. Potapova, S.-A. Siegfried, V.A. Dyadkin, E.V. Moskvin, D. Menzel, C.D. Dewhurst, D. Chernyshov, R.A. Sadykov, L.N. Fomicheva, A.V. Tsvyashchenko, Phys. Rev. Lett. 110, 207201 (2013).
- (11) S.V. Grigoriev, S.-A. Siegfried, E. V. Altynbayev, N.M. Potapova, V.A. Dyadkin, E.V. Moskvin, D. Menzel, A. Heinemann, S. N. Axenov, L.N. Fomicheva, A.V. Tsvyashchenko, Phys. Rev. B 90, 174414 (2014).
- (12) V. I. Larchev, S. V. Popova, J. Less-Common Met. 87, 53 (1982).
- (13) A. V. Tsvyashchenko, V. A. Sidorov, A. E. Petrova, L. N. Fomicheva, I. P. Zibrov, V. E. Dmitrienko, J. Alloys Compd. 686, 431 (2016)
- (14) N. Martin, M. Deutsch, G. Chaboussant, F. Damay, P. Bonville, L. N. Fomicheva, A. V. Tsvyashchenko, U. K. Rössler, and I. Mirebeau, Phys. Rev. B 96, 020413(R) (2017).
- (15) L. G. Khvostantsev, V. N. Slesarev, V. V. Brazhkin, High Press. Res. 24 (2004) 371.
- (16) A. V. Tsvyashchenko, V. A. Sidorov, L. N. Fomicheva, V.N. Krasnorussky, R.A. Sadykov, J. D. Thompson, K. Gofryk, F. Ronning, and V. Yu. Ivanov Solid State Phenom. 190 225 (2012)
- (17) A. E. Petrova, V. A. Sidorov, and S. M. Stishov, Physica B:Condens. Matter 359-361, 1463 (2005).
- (18) A. Rogalev, F. Wilhelm, Phys. Metals Metallogr. 116, 1285 (2015).
- (19) P. Giannozzi, S. Baroni, N. Bonini, M. Calandra, R. Car, C. Cavazzoni, D. Ceresoli, G. L. Chiarotti, M. Cococcioni, I. Dabo, J. Phys.: Condens. Matter 21, 395502 (2009)
- (20) J. P. Perdew, K. Burke, M. Ernzerhof, Phys. Rev. Lett. 1996, 77, 3865-3868.
- (21) G. Prandini, A. Marrazzo, I. Castelli, N. Mounet, N. Marzari, Standard Solid State Pseudopotentials (SSSP), 2018; http://materialscloud.org/sssp.
- (22) A. Kokalj, Comp. Mater. Sci. 28 (2), 155-168 (2003), https://doi.org/10.1016/S0927-0256(03)00104-6; http://www.xcrysden.org/.
- (23) J. F. DiTusa, S. B. Zhang, K. Yamaura, Y. Xiong, J. C. Prestigiacomo, B. W. Fulfer, P. W. Adams, M. I. Brickson, D. A. Browne, C. Capan, Z. Fisk, J. Y. Chan, Phys. Rev. B 90, 144404 (2014)
- (24) G. A. Valkovskiy, E. V. Altynbaev, M. D. Kuchugura, E. G. Yashina, A. S. Sukhanov, V. A. Dyadkin, A. V. Tsvyashchenko, V. A. Sidorov, L. N. Fomicheva, E. Bykova, S. V. Ovsyannikov, D. Yu. Chernyshov, S. V. Grigoriev, J. Phys.: Condens. Matter, 28 , 375401 (2016).
- (25) E. Altynbaev, S.-A. Siegfried, P. Strau., D. Menzel, A. Heinemann, L. Fomicheva, A. Tsvyashchenko, and S. Grigoriev, Phys. Rev. B 97, 144411 (2018)
- (26) N. Kanazawa, Y. Onose, Y. Shiomi, S. Ishiwata, Y. Tokura, Appl. Phys. Lett. 100, 093902 (2012).
- (27) A. Sakai, F. Ishii, Y. Onose, Y. Tomioka, S. Yotsuhashi, H. Adachi, N. Nagaosa, Y. Tokura, J. Phys. Soc. Jpn. 76, 093601 (2007).
- (28) S. Pizzini, A. Fointaine, Phys. Rev Lett. 74, 1470 (1995).
- (29) A. Smekhova, D. Ciuculescu, P. Lecante, F. Wilhelm, C. Amiens, A. Rogalev, and B. Chaudret, IEEE TRANSACTIONS ON MAGNETICS, 44, 2776 (2008).
- (30) V. M. T. S. Barthem, A. Rogalev, F. Wilhelm, M. M. Sant‘Anna, S. L. A. Mello, Y. Zhang, P. Bayle-Guillemaud, D. Givord, Phys. Rev. Lett. 109, 197204 (2012).
- (31) M. Magnitskaya, N. Chtchelkatchev, A. Tsvyashchenko, D. Salamatin, S. Lepeshkin, L. Fomicheva, M. Budzynski, J. Magn. Magn. Mater. Available online 25 October 2017, https://doi.org/10.1016/j.jmmm.2017.10.090.
- (32) V. Dyadkin, S. Grigoriev, S. V. Ovsyannikov, E. Bykova, L. Dubrovinsky, A. Tsvyashchenko, L. N. Fomicheva, and D. Chernyshov, Acta Cryst. B 70, 676 (2014).
- (33) U. K. Rößler, J. Phys.: Conf. Ser. 391, 012104 (2012).
- (34) I. Di Marco, J. Minar, J. Braun, M. I. Katsnelson, A. Grechnev, H. Ebert, A. I. Lichtenstein, and O. Eriksson, Eur. Phys. J. B 72, 473 (2009).
- (35) V. L. Moruzzi and P. M. Marcus, Phys. Rev. B 48, 7665 (1993).
- (36) M. Neef, K. Doll, and G. Zwicknagl, Phys. Rev. B 80, 035122 (2009).
- (37) J. A. Hernandez, L. Vočadlo, and I. G. Wood, J. Alloys Compd. 626, 375 (2015).
- (38) G. D. Mahan, Solid State Phys. 51, 81 (1998).
- (39) B. Balke, S. Wurmehl, G. H. Fecher, C. Felser, and J. Kübler, Sci. Technol. Adv. Mater. 9, 014102 (2008).