Cross-country comparisons of scientific performance
by focusing on post-apartheid South Africa
Abstract
This paper examines the scientific performance of South Africa since 1994 (post-apartheid) until 2014 in comparisons with the rest of the world, utilizing relative indicator. It provides a view over current standing of South Africa in the scientific world as well as its temporal evolution after the apartheid. This study focuses on four major aspects of scientific performance, namely quantity, productivity, impact and quality, as the main attributes of scientific perfomance on national level. These are measured by re-based (relative) publication, publication per population or GDP, citations and citations per publication respectively. The study focuses on scientific outputs (in the form of papers published in peer-reviewed journals) and their impact (measured by the citations they have received) to bring into a light a homogeneous comprehension of South Africa’s scientific performance in all these four aspects. Indicators are adopted cautiously by considering the measures put forward recently for scientometrics indicators and their usage in the long-term comparisons studies. The temporal evolution of these indicators for South Africa are discussed in the context of three major groups of countries, namely African countries, developing countries, and developed (including BRICS) countries. It aims to examine the process of transition of South Africa from a developing world economy system into a knowledge-based and innovation-driven one of the developed world. The study reveals that South Africa has shown steady increase in its scientific performance during the studied period when compared to the rest of the world. However, due to the increasing competition from the other developing countries, South Africa’s position stands the same during this period, while countries such as China, Iran, Turkey and Malaysia have shown great jump at least in the quantity of their scientific performance. Furthermore, the study provides the rank of South Africa globally in both 1996 (initial year of the studied period) and 2014 (ending year of the study). These ranks, changes in them, and their interpretations are discussed by considering their distributions.
I Introduction
I.1 Motivation
The national level scientometrics has been increasing recently due to a global shift towards innovation-driven economy. This tendency calls on measuring scientific performance of counties as a proxy of their success in the new world economy. As governments, societies and corporations realize the significance of the new system of economy based on high-tech products, human capital and information (OECD 1996)OECD1996 , the importance of research, education and innovation grows. In this era, the competitiveness of a nation relays on the level of their performance in producing knowledge and consuming it in the form of manufacturing ultra-modern softwares and hardwares. In other words, the assessment of national success in financial terms is closely associated with such indicators as quality and quantity of its scientific performance. It is suggested that technological progress can enable a cycle of exponential growth by economists such as Zvi Griliches and Kenneth Arrow. As Griliches griliches1998introduction emphasized on the relationship between economical growth and scientific performance:
“Real explanations [of productivity growth] will come from understanding the sources of scientific and technological advances and from identifying the incentives and circumstances that brought them about and that facilitated their implementation and diffusion”
For instance, the near-to-exponential GDP growth of United States during the last 130 years has been identified to relate to its heavy investment in science and technology press2013s .
This push of financial evolution of human societies is echoed in many countries’ national road-maps regarding their future science-policies. For instance, Iran insists on
“achieving the first place in science and technology within the Islamic world, and obtaining a high-rank scientific place in the world”
as its first goal in its “national road-map of science”Iran2010 , and the European union foresees to become
“… the most competitive and dynamics knowledge-based economy in the world…”.
South Africa recognized this trend swilling2014rethinking in the opening line of its “innovation towards a knowledge-based economy 2008-2018”:
“This Ten-Year Innovation Plan proposes to help drive South Africa’s transformation towards a knowledge-based economy, in which economic growth is lead by the production and dissemination of knowledge for the enrichment of all fields of human endeavor”.
This document has set a variety of detailed targets to achieve this goal, most of them are relative and cross-country in nature; for example:
-
•
“By 2018, South Africa will have: 2.5 percent global share of research publications”.
-
•
“Human and social dynamics: as a leading voice among developing countries, South Africa should contribute to a greater global understanding of shifting social dynamics, and the role of science in stimulating growth and development.”
This shift of policies creates a demand for measurement framework to evaluate countries achievement in pursuing their goals as well as cross-country evaluation to determine their relative position. In other words, the judgment over national scientific standing in the world of science plays a crucial role for governments, businesses and agencies which should decide on funding priorities and scientific preferences.
I.2 Brief literature review
The origins of this line of research can be traced back to the English chemist Edward Frankland (1825 - 1899) who put together figures showing England to be much behind France and Germany in chemical research by relying on the relative numbers of papers published in 1866 222Edward Frankland’s comments before the 1872 Devonshire Commission, which inquired into the state of scientific education in Great Britain, are cited in Cardwell, Science in England (cit. n.1), p. 96.. The concern over the “national inferiority” engulfed both England and France by the end of nineteen century. The concept of decline has helped to produce some of the impressive quantitative studies in the history and sociology of science. However, all these early attempts were short of relative positioning and were just concerned mostly to deliver the message of decline to these countriesnye1984scientific .
The first well-received study in this line of research was published in 1994 by May may1997scientific who looked at a few different countries’ share of annual scientific outputs of the world and their citations. He used measures of relative performance to determine the rank of countries. The study covers top 15 countries (based on the total number of publications) in the period of 1981-1994. He concluded that when measuring research performance on national level, country size (which can be measured by gross domestic product -GDP- or population) should be taken into account. However, May’s study lacks the standardization for discipline-specific attributes and hence has been criticized heavily for it. Furthermore, the temporal evolution of the indicators is overlooked by averaging over all the years and presenting median values. King king2004scientific address the issue of discipline-specification by distinguishing seven broad fields of research. His study widens the circle of countries from 15 to 31, and focuses on more recent period, from 1993 to 2002. However, it still lacks the understanding of scientific activity as an international endeavors which needs to take into account all the nations to understand the global changes in the culture of scientific activity. In other words, although he uses the “Re-Based” indicators to remove the effect of disciplines discrepancies, there is no re-based or normalization for different years, and hence temporal discrepancies are ignored. Furthermore, the scarcity of information on the funding spent by different countries on each field restricts the comparisons based on normalization over investments.
Recent studies revealed the dependency of scientific performance of countries on the international collaborationssorensen2016studies . Therefore, the concept of national research performance stays unclear to some extent. This poses a conceptual challenge in this line of research, since publications with international co-authorship can not be easily assigned equally for all the countries listed in their affiliations. Furthermore, the method of counting, either full or fractional counting, brings its own problems to the table. Both approaches are concluded to be flawed since they both ignore that fact that credit should be unevenly distributed. Full counting results in what is know as “inflationary bias”, while fractional counting causes “equalizing bias” hagen2015contributory .
Adding to the conceptual challenges of the research field, the citation pattern for internationally co-authored papers differ from the others. It has been pointed out in a few studies that international co-authored publications receive greater number of citations glanzel2001double ; persson2004inflationary , which means that international collaborations not only does blur the meaning of national publication but also causes bias in the citation patterns of the countries involved in those papers.
I.3 Measures for using scientometrics indicators
Due to the explosive increase in the indicators used to measure scientific performances on different levels, namely individual researchers, scientific journals, universities or research organizations and countries, some sort of regulation or at least measures are needed to validate them. In the latest attempt, the San Francisco declaration on Research Assessment (DORA)van2013scientists lays some important recommendations to observer when using indicators to assess scientific performance 333For more information visit: http://www.ascb.org/dora/. The qualities of an appropriate performance indicators have been discussed in the scientometrics community and they are still away from being settled bollen2009principal ; zahedi2014well . However, there are some basic intuitions which can be helpful. The list below presents those major ones which are observed in this studygingras2014criteria :
-
1.
Adequacy : an indicator should be strongly related to the property it is supposed to measure.
-
2.
Sensitivity: an indicator should take into account the intrinsic inertia of the object it is measuring
-
3.
Homogeneity: an indicator should stay homogeneous by addressing all the different dimensions of the measurement independently.
An indicator is defined as a variable that measures and faithfully represents a specific property of an object under study lazarsfeld1958evidence . Hence, the properties of the indicator should satisfy our instinct (originating from intuition or prior knowledge) regarding that concept’s properties. One of the major properties includes the inertia of the object, i.e. its resistance to change. Appropriate indicator should be able to show the same resistance as the object. For instance, consider individual, researchers versus countries. The former has much less inertia than the later. Hence, on the level of individuals the change in their ranking or impact can easily happen (it might just take one year or two to change the raking of specific researchers). However, on national level, due to the massive inertia, the change in relative position of countries should take decades, and national level indicator should be able to reflect that.
Other than these, two more insightful criteria are proposed by Gervers gevers2014scientific :
-
1.
Insensitivity: small variation in data should not affect the results and more precisely should not change ranking or classification
-
2.
Normalization: the data should be normalized to the field, time period and size, or at least the effect of these factors should be noted in any conclusions.
It is vital to emphasize that even a simple comparison of publication of one country in two different years which are apart enough is to some extent misleading since these two numbers are coming from different eras in scientific performance. It is something which is widespread in scientometrics studies across different levels. One should note that underlying context for scientific activity is changing rapidly and performance of 2004 can not easily be compared with 1994 or 2014. That is why the normalization to year plays an essential role to come closer to a correct judgment for cross-year comparisons. In other words, “almost inflationary growth of the value of the basic indicators” (such as publications and citations) requires relative indicators when studying medium or long term trends in bibliometrics persson2004inflationary ; schubert1986relative .
Numerous factors have changed globally during the studied period, especially considering the scientific activity. A new era of transnational scientific activity has emerged during these years, and Internet started to impact scientific activity culture heavily adams2013collaborations . Although a simple method of averaging over years can not replace all the differences for these different years, it the first best option to deal with this problem. In this study, indicators are used cautiously by re-basing them in order to overcome the discipline and temporal discrepancies. To do so, all the nations () 444Note that the number of countries for each fields varies since for small countries there exists years that they have not published any paper for some specific fields. are included in the averaging to create as little bias as possible in the indicators temporal evolutions.
I.4 South Africa and its transition
This study focuses on South Africa as a nation in its post-apartheid era, i.e. from 1996 until 2014. After its remarkable peaceful transition from apartheid to democratic regime, South Africa has experienced a relatively prosperous years. It has managed to move from developing world to newly industrialized countries (NIC)hossain2011panel , and by joining BRICS group (comprised of Brazil, Russia, India, China and South Africa) it is guaranteed to be considered as part of transitional countries to the developed world. In order to achieve such state, it urgently needs to change its economical system into a knowledge-based and high-tech oriented status. Although new policies and laws in support of such change have put into place, the transition is still seems far-fetched. The first necessity for achieving this goal is to boost scientific performance of the country on a national level to reach the same standards as the developed world. Although this transition encompasses different aspects of social and economical life of South Africa, this study is mainly concerned about its scientific aspect. The focus is on the four main aspects of scientific performance, i.e. quantity, productivity, impact and quality. These attitudes among the different aspects of the national scientific activity is chosen to address the main questions of the paper: What is the standing point (position) of South Africa in the world of science, especially in the context of Africa and developing world? The answer to this question will show how far South Africa has come in its transition. The study will compare South African scientific performance with the developed world to bring lights on the remaining trajectories that South Africa should take to complete the transition. Furthermore, the study focuses on the temporal evolution in these comparisons in order to show the context within which South Africa is. Since the study relies on relative (re-based) indicators, the temporal evolutions of other nations is as important as South Africa’s itself in this study. Specifically talking, other successful countries in the developing world have gone through rapid decline/growth during the same time. This dynamical context can be reckon when the temporal evolution of South Africa is presented in comparison with other nations.
I.5 Four aspects
Scientific activity on any of the four levels under scientometric study (e.g. individuals, journals, universities or groups and nations) should be considered as a multi-dimensional and complex endeavor. Any attempts in measuring it should firstly decide which aspects it is going to focused upon. These different aspects can be thought of as layers in which the inner layers focus on more ambiguous and qualitative aspects. Scientific performance is the outermost layer of national scientific activity covering the outcomes of the national level scientific system. One can discuss the inner layers such as internal structure and culture of scientific activity in certain countries.
The internal structure includes concepts such as mobility, collaborations pattern, science policies adopted in the country and many other concepts concerning a certain country’s scientific system. Culture refers to even more ambiguous aspects including educational and research system and its history. For example, “publish or perish” meme can be found in most of countries nowadays; however, its intensity plays a crucial role in the culture of national level scientific activity. Studies on inner layers are limited to a few countries since they need to dive deep into those countries’ scientific systems and their data bases. Hence, the comparisons are challenging to carry out. Furthermore, serious limitations are imposed on such studies due to the dearth of data. Not to mention the need to be familiar with the context of scientific activity which requires a broad vision on the common culture of the countries in the study.
In this study, since our main concern is the relative position of countries, the focus is on the outer layer of scientific activity. Quantity, productivity, impact and quality are the four major concepts that this study analyzes. Although the scientific performance is not limited to the four aspects considered here, they cover all of its major attributes and produce a well-defined comprehension of countries position in the world of science.
II Methodology
In this study, the basic methodological principle used throughout the paper considers the papers published in peer-review journals as the unit of assessments. The usage of number of publication and citation and other derived indicators have been discussed throughly in several publications. The inadequacy of these two indicators when comparing different fields and even different years or periods is a frequent claimed drawbacks schubert1986relative ; schubert1996cross ; garfield1979citation . In this study, re-based (relative) indicators are utilized to overcome this problem. This method assesses each paper against its own context and standards both in its field and age. Since the study focuses on national level scientometrics, statistical reliability can almost be guaranteed. It is due to the fact that there are enough papers for each field in each year to make the study statistically plausible.
When adopting relative indicators in assessment, the focus should be on relative standing rather the value of the indicator, since the value itself can not reflect any meaningful understanding of the concept. Among many other possible approaches, two different methods is used here to make sense of such values. Firstly, the value can be assessed against the expected value for such an indicator. However, this causes its own complexity about how such expected value should be calculated. Here, in case of three indicators,namely the minimum expected value is defined, and comparisons against such values are considered in the analysis of the results.
Secondly, the values can be compared versus each other. This basically means looking at the ranking of the objects under study in regards to that concept. Although this is less ambiguous to do, one should always take into consideration if enough and correct number of objects are chosen for the comparison in order to deliver a fair and comprehensive judgment. Here, in case of all the indicators this method is adopted. The choice of countries to compare South Africa against and the justification behind it will be discussed in the next section. The results of the two approaches is presented in Secs. III.1, III.2, III.3 and III.4 for all the four concepts.
The other way to approach this issue is based on sketching the distribution of values. Distributions can reveal the discrepancies among the objects and normal or abnormal behaviors. It also brings to light the relative position of the object in contrast to the whole ensemble. The outcomes of this analysis are presented in Sec. III.5.
II.1 Concepts and Their Indicators
II.1.1 Quantity ():
Quantity of scientific performance can be measured in the paper published peer-reviewed journals which consist the main output of scientific activity across fields and disciplinesglaser2007social . Here, the following formula is used to achieve “re-based publication” as quantity indicator. The head-count method is used to calculate the publications (and citations) number for countries. First, the re-based publication is calculated for each field in a specific year:
The value of this relative indicators is basically comparable across years and fields since it is standardized against the context of each field in each year. Afterwards, they are averaged over different fields to find a single number which represents the re-based publication of a country in a given year:
| (1) |
II.1.2 Productivity (, ) :
The concept of productivity refers to the number of outputs in comparison to input in the form of human capital or financial investments. On national level, inputs consists of population and gross domestic product (GDP). In this study, both aspects of the concept input are considered. So, two indicators are studied, namely productivity in financial term and productivity in terms of human capital.
Here, the focus is on the productivity of a nation rather than on the productivity of its scientific community. Therefore, the publication is divided by the total population of the country and not just its full-time equivalent (FTE) researchers. In other words, the idea is that if a country possesses certain share of the population of the world, it should be able to produce the same share of scientific outputs of the world. Hence, publication per population () is used as a proxy to productivity of a country. However, according to the consideration outlined in the Introduction, these values of can misguide the comparisons. Therefore, relative form of is adopted here, based on the following definition:
| (2) |
in which comes from equation 4. stands for the re-based population, or in other words, the share of population of a specific country in a given year of the world population in the same year.
Following the same logic, one can build the productivity indicator based on financial input. Here, the concern is about the productivity of a nation. So, devision is carried out over total GDP. If the publication is divided by the total investment (share of GDP spent on science and research), then indicator is mostly showing the efficiency of the investment, which stands out of the scope of this study. The formula for this indicator of productivity is as follows:
| (3) |
in which
Note that the values of this indicator is presented in percentage, and hence the value () presents the case in which the country under study produce the same share of scientific outputs as its share of population (GDP). Such a country has achieved average productivity. However, as it will be discussed in Sec.III.2, most of the developed world show more productivity than average, especially in case of .
II.1.3 Impact ():
Citations has frequently been used as a proxy for impact of scientific research moed2006citation . However, citation, as an indicator (like any other indicators), faces its own restrictions and should be used cautiously macroberts1989problems ; nicolaisen2007citation ; macroberts2010problems . The major drawback of citation as proxy of scientific impact is the fact that it just measures one aspect of impact (i.e. the impact of publication on other scientists outputs). Various ways of impact stays out of scope of citation. For example, readers and the number of those who benefit from reading the paper but do not publish a paper in that research line to cite a specific paper. New instruments have been developed with the help of information technology to count all these micro-data; however, most of them are limited to individual level priem2012altmetrics ; mohammadi2014mendeley ; kurtz2010usage . Although these new tools have started a renaissance in bibliometrics, they can not be utilized for national level due to the complexity of data management. Hence, this study unwillingly limits the concept of impact to the citations (as the available proxy for it) and adopts the re-based form of citations. Firstly, the re-basing is carried out for each field:
Then, the values of re-based citations for different fields are averaged over to produce single number for each country in every year:
| (4) |
II.1.4 Quality ():
Although the definition of quality when it comes to scientific performance is to some extent vague, and it is conceptually difficult to elucidate, a simple and general notion of that is assumed here. The impact of a country’s output should be at least equal to its share of quantity; that is to say a country’s share of citation should match its share of publication of the world. If these two shares are equal to each other, then the quality of scientific performance has reached its minimum value (here presented in percentage value ). Based on this definition, the formula of quality indicator is as follows:
| (5) |
II.2 Groups of countries
As stated in the Introduction, the focus in this study is on the transition of South Africa from a developing to a developed country, and its economy changing into a knowledge-based model. Therefore, South Africa’s scientific performance is compared versus three main groups of countries in the world, e.g. African, developing and developed (including BRIC countries). The overlapping between African and developing countries help to include more countries in the comparison presented in the figures.
Africa:
For each of the indicators, a comparison is firstly presented among African countries. It is widely believed that South Africa stands as the most prosperous country in Africa, and it has moved beyond African nations in terms of economical progress. Hence, it is accepted to see South Africa on top of Africa in almost all of the aspects of scientific performances. However, one should note the recent swift growth among some of African nations (some of the fastest growing countries in the world are in Africa nowadays). Therefore, it is important to our study to check the relative position of South Africa within Africa to consider all the movements by other nations in Africa. Eight countries which are the most productive in science in Africa are considered. They include Kenya, Algeria, Tanzania, Egypt, Ethiopia, Nigeria, Tunisia and Morocco.
Developing world:
Secondly and mainly, South Africa’s achievement in scientific performance is measured versus developing countries. This group consists of eight countries, e.g. Iran, Argentina, Pakistan, Ukraine, Poland, Turkey, Malaysia, Mexico. The choice of counties relies on the quality of their research This collection includes countries from all the continents. Note that developing countries from Africa are presented in the first group. Hence, the first two groups show South Africa in the context of developing world.
Developed world:
The next comparison presented for each of indicators shows the position of South Africa in the developed world and among BRICS countries, including Brazil, Russia, India, China, United States, United Kingdom, Germany, France.
II.3 Database
The data, such as number of publications and citations, needed for the analyses are obtained from the SCImago Journal and Country Rank portal, which provides Scopus data arranged according to the country, subfield of science and year of publication 555Further information is available at: http://www.scimagojr.com/.. The information about population and GDP of countries are collected from the website of “The World Bank” which covers almost all the countries for the last 40 years 666Further information is available at: http://data.worldbank.org/..
III Results
III.1 Quantity: Re-Based Publication ()
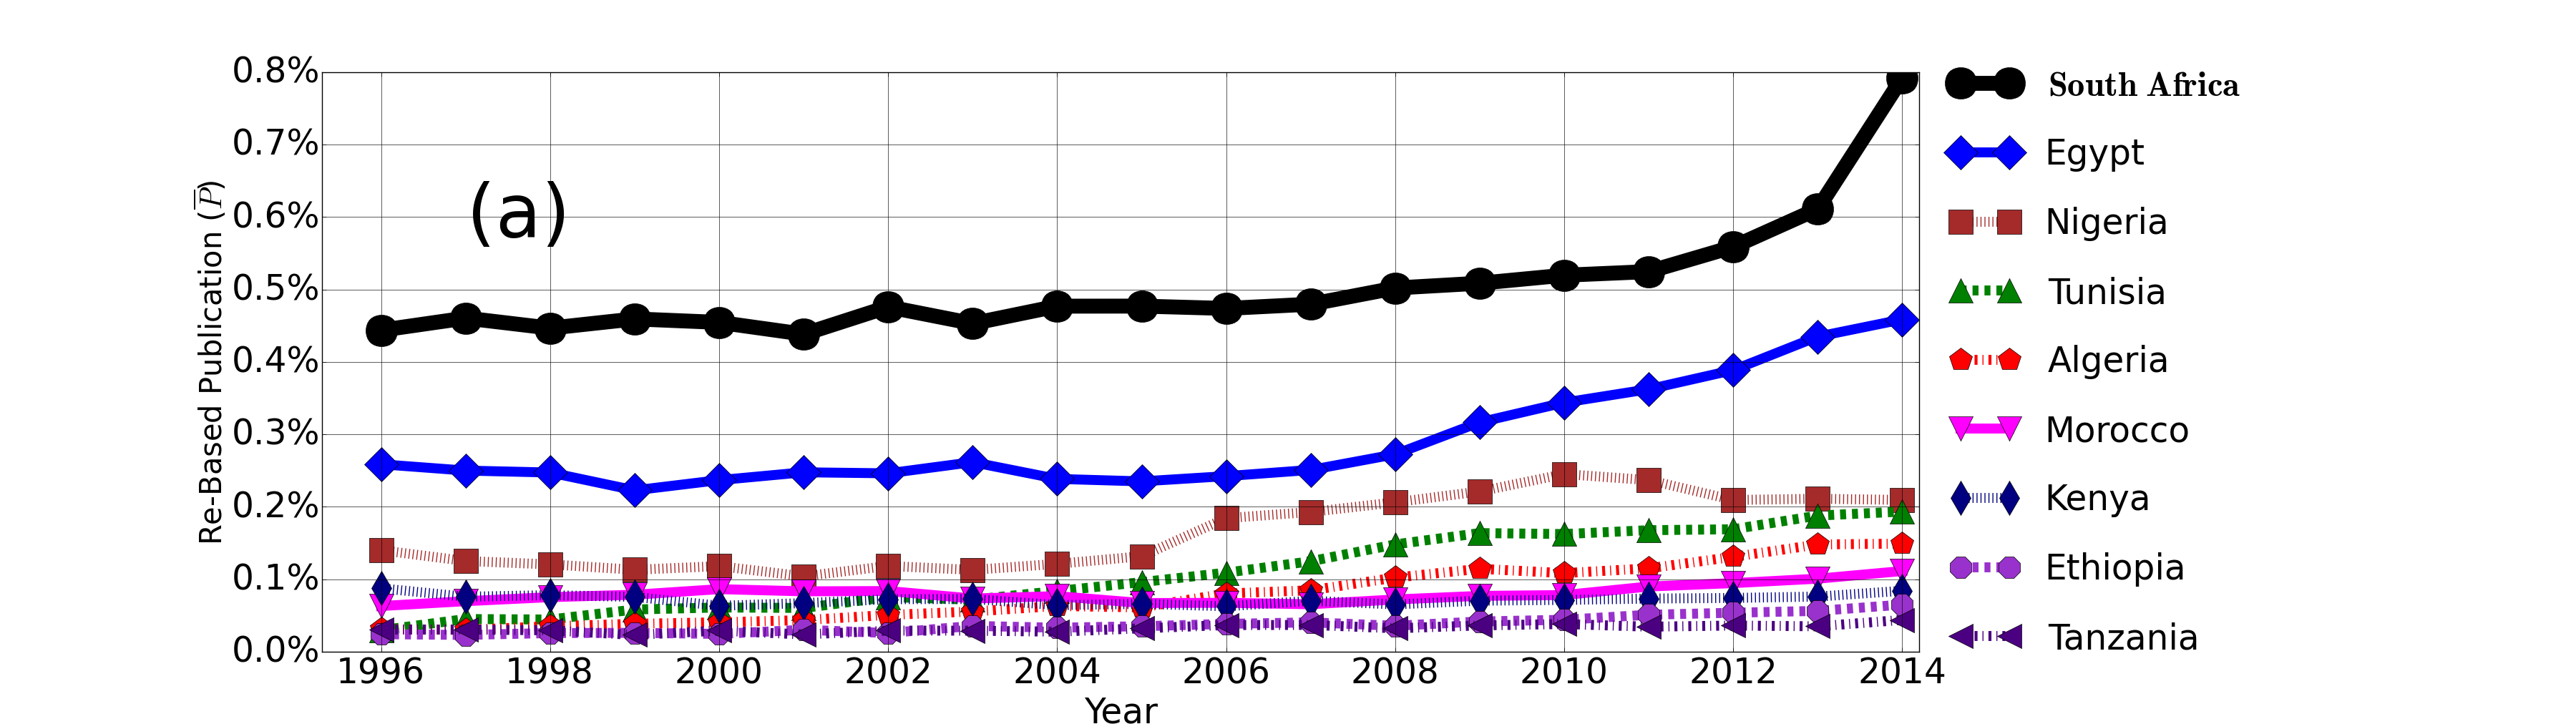
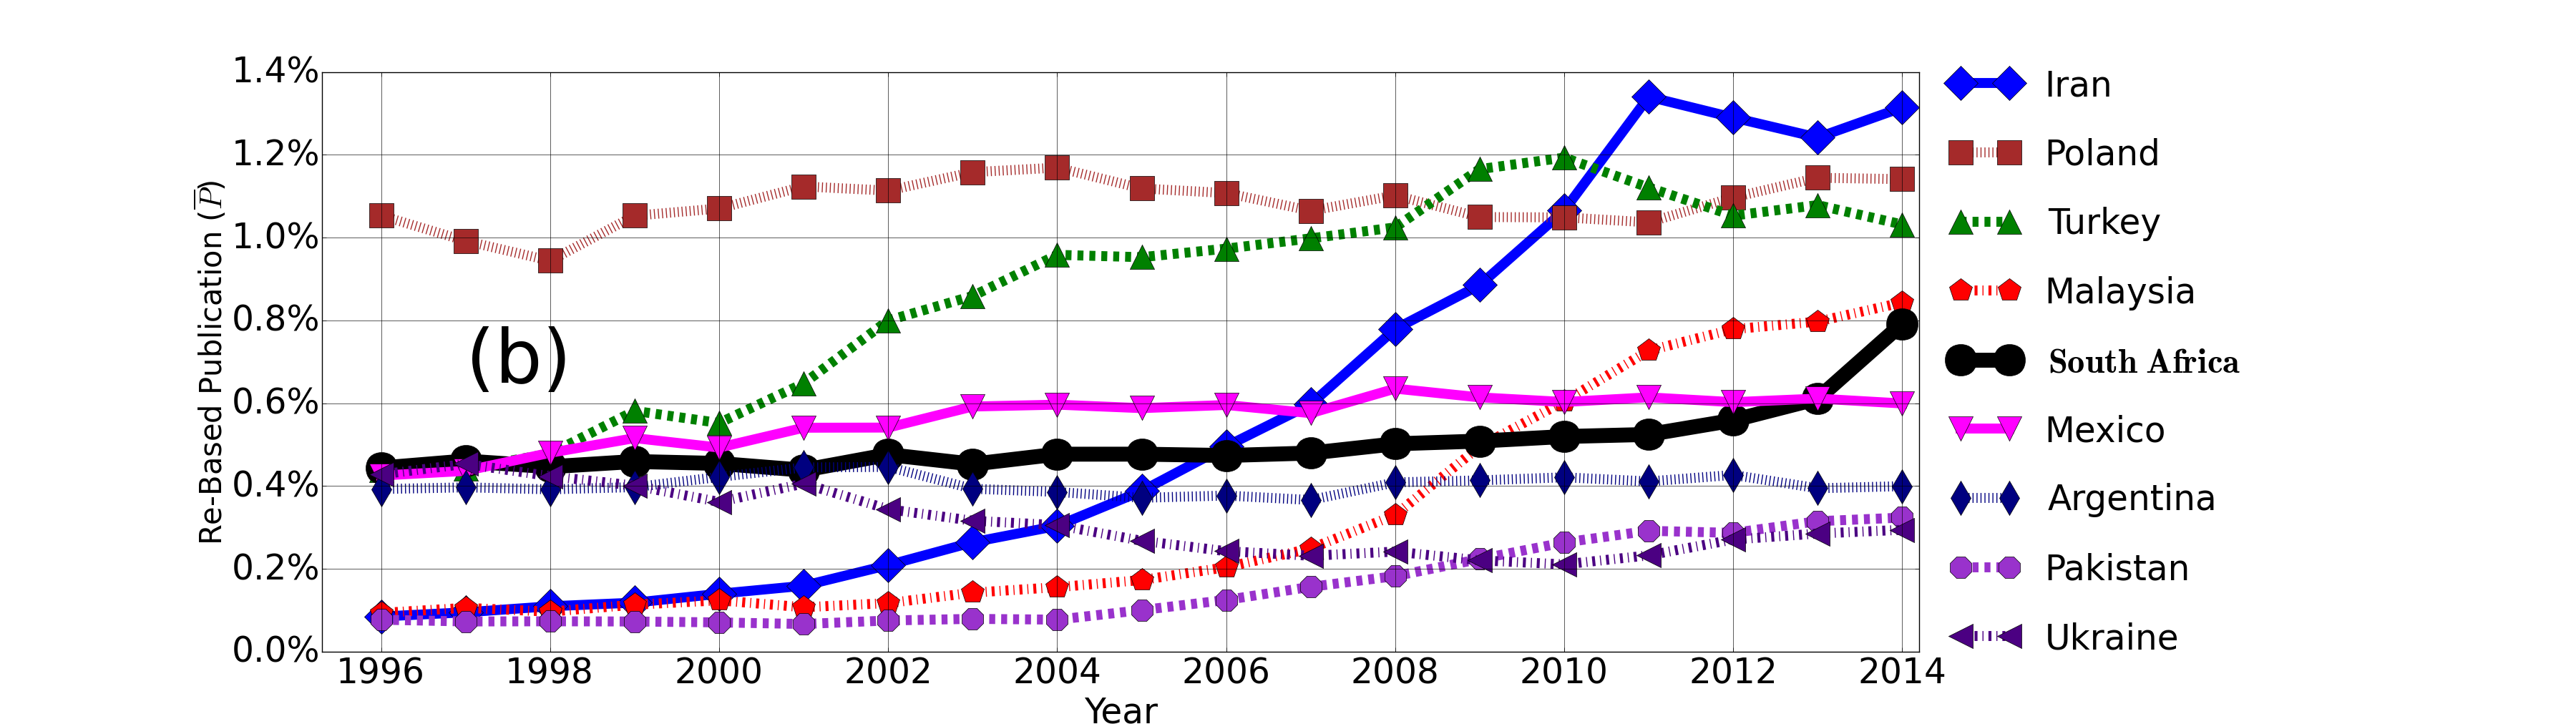
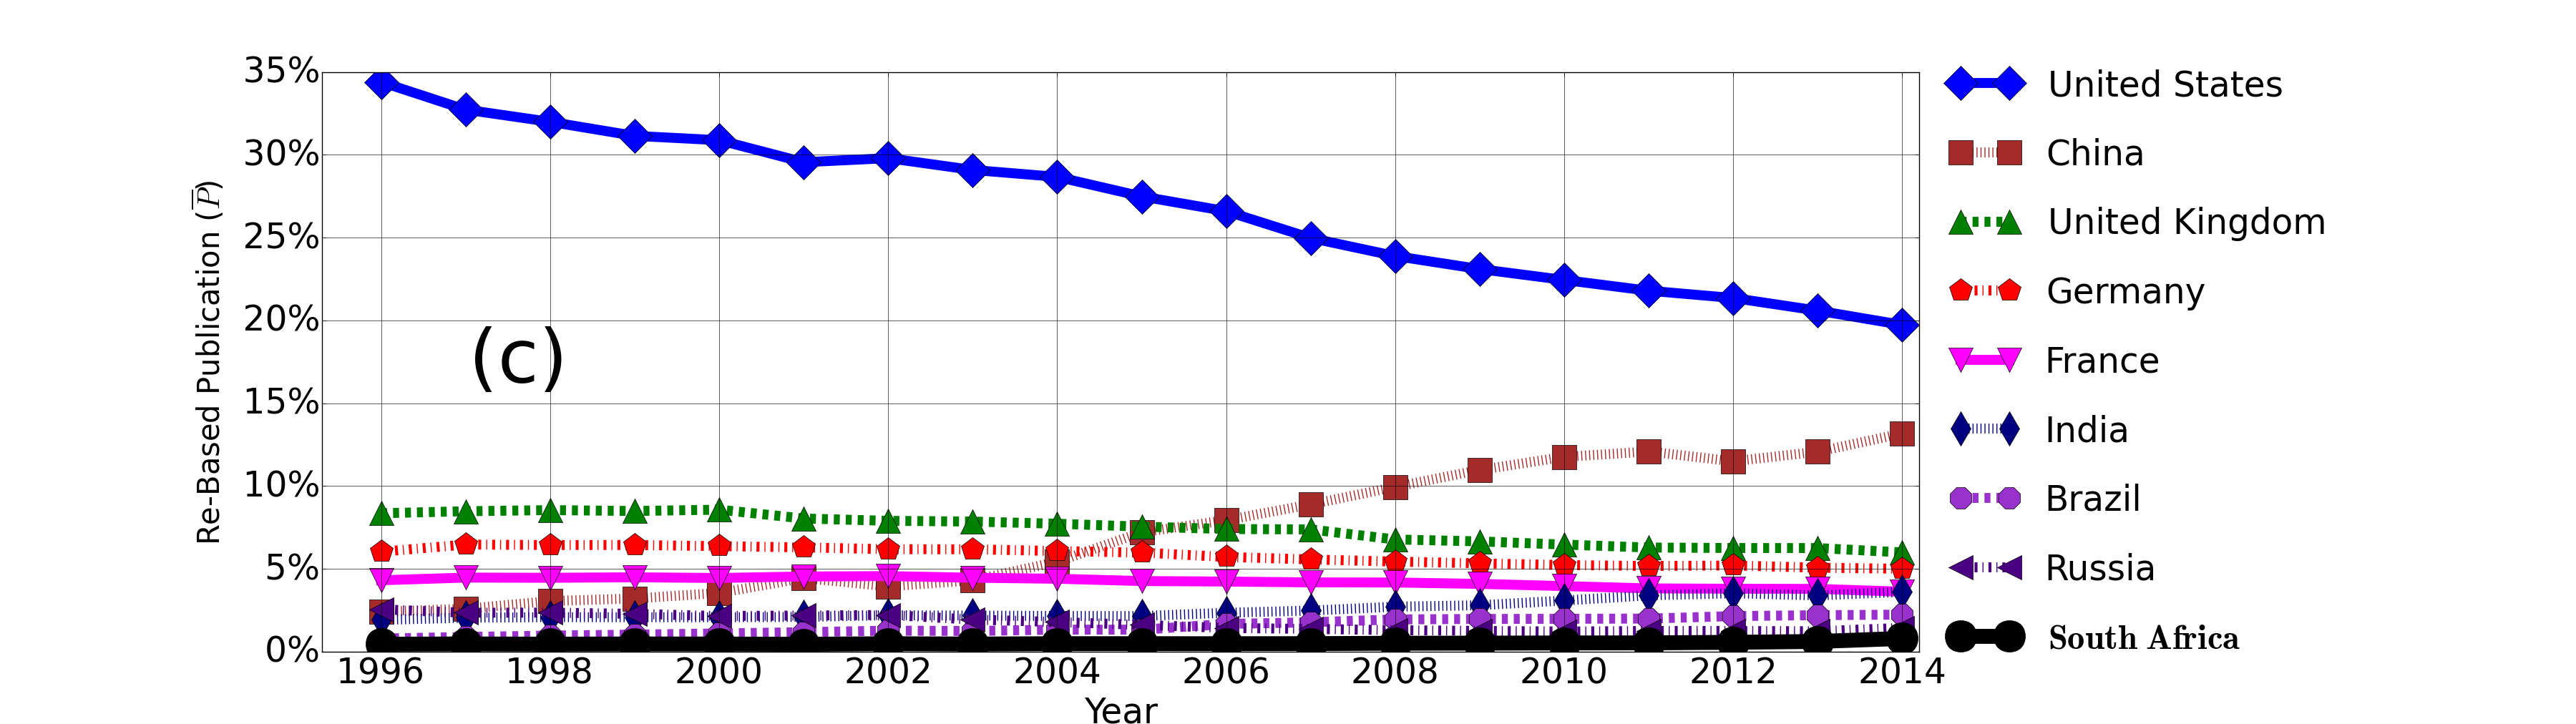
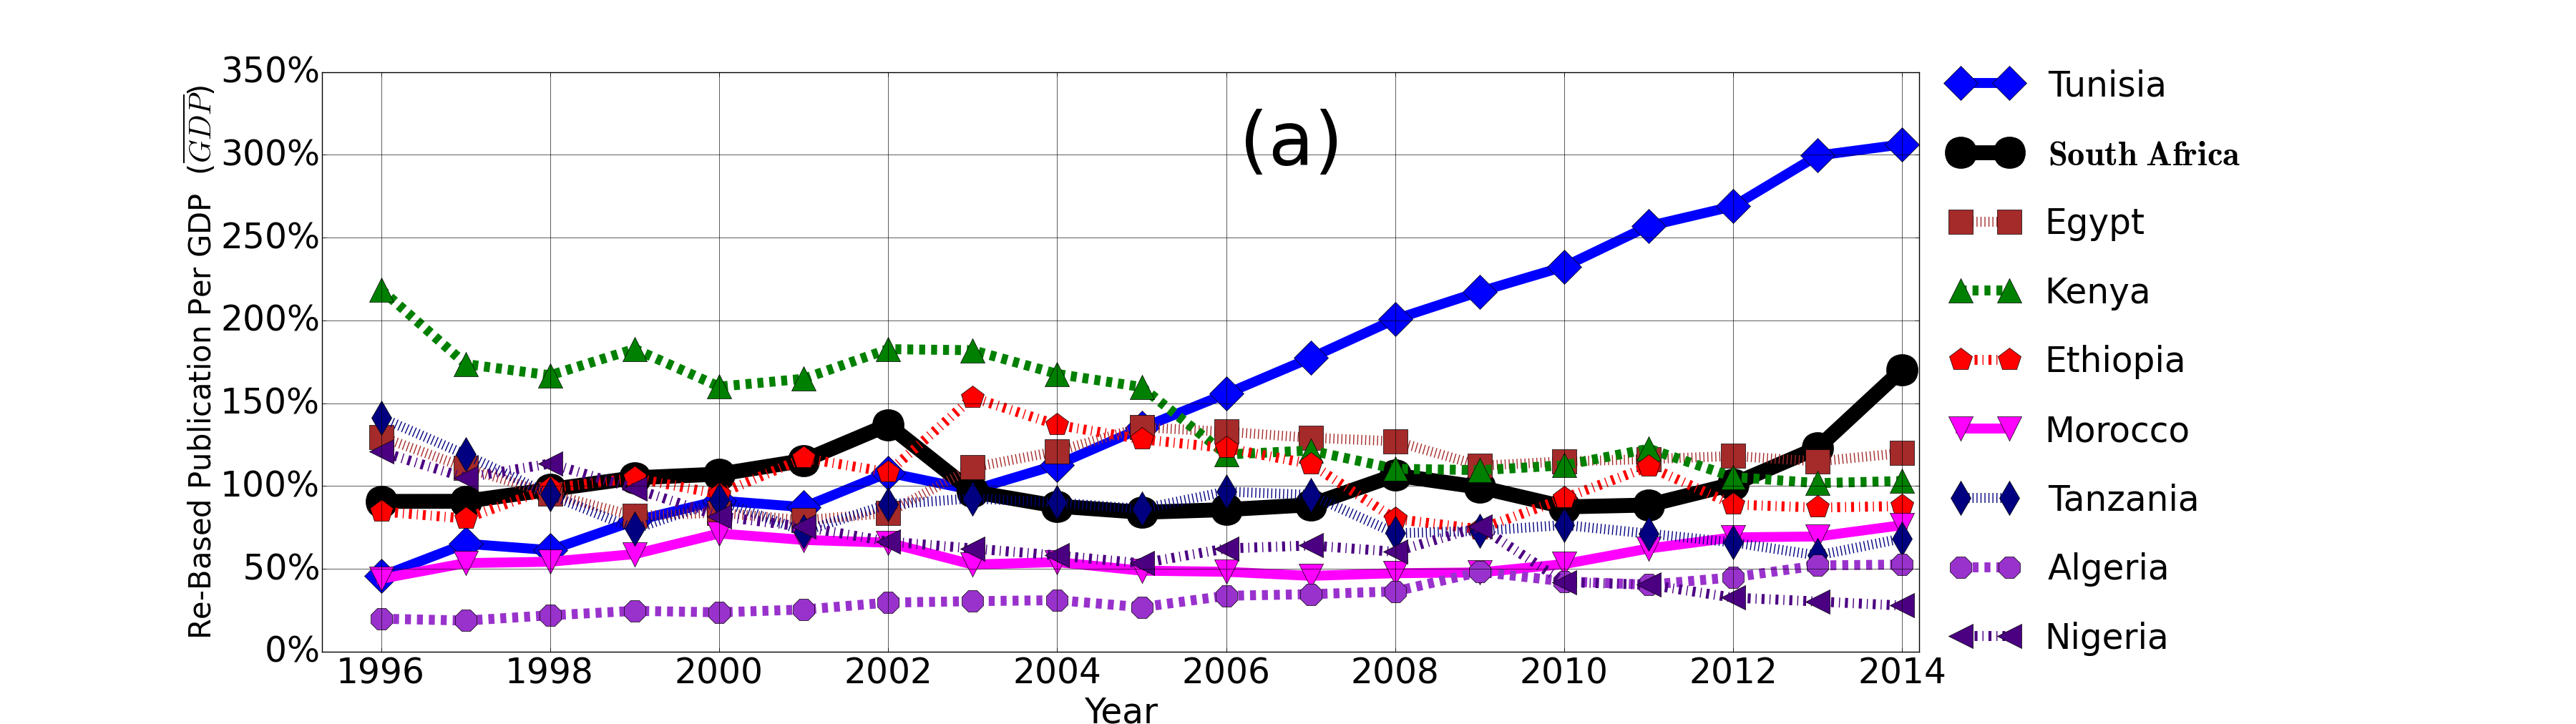
Fig. 1 presents the comparison in re-based publication of the selected countries with South Africa in three major groups considered in this study, namely African countries, developing countries, and developed including BRICS countries. It shows that South Africa stands on top of its continent when it comes to the quantity of scientific performance, followed closely by Egypt. Other major African countries by having less than of re-based publication of the world are far below South Africa and Egypt. In case of Egypt, the relatively close link to the Middle East and Arab world helps its scientific performance to stay above the rest of Africa. South Africa, on the other hand, especially after the apartheid, has managed to increase the quantity of its scientific performance by adopting new policies focusing on publication as the major form of scientific outputpouris2012science . The incentives policy passed on 2003 which grants scientists considerable amount of payment per publication has played a crucial role in this achievement. This policy insists on scientific publication as an important source of income for universities in South Africa, by forcing them to us publication as a ‘carrot and stick’ incentive for their staff. Hence, the policy impacts on universities can be summarized as:
“publish or (you and the university will) perish”kahn2011bibliometric .
Furthermore, the level of internationalization and oversees collaborations has been mentioned as the major boost to the scientific activity in South Africa sooryamoorthy2014publication ; mouton2000patterns ; sooryamoorthy2007does ; sooryamoorthy2015transforming .
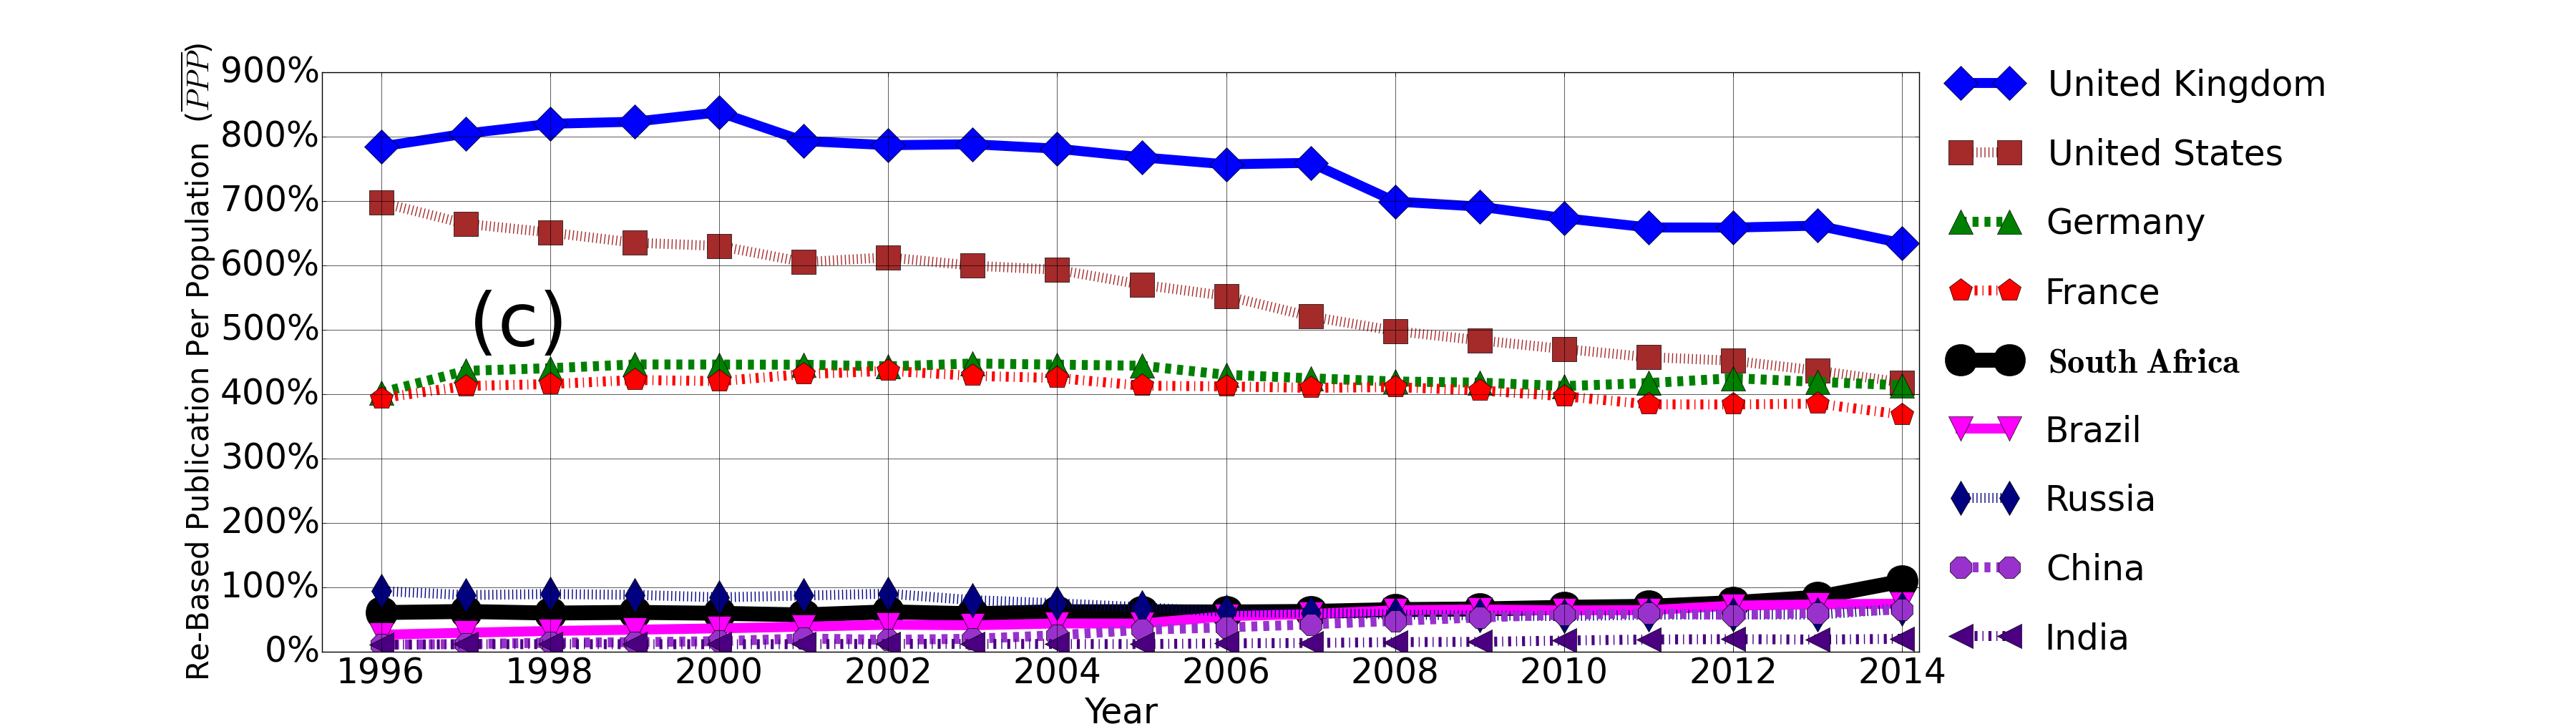
However, the considerable growth in re-based publication of South Africa is dwarfed by the countries such as Iran, Turkey and Malaysia, from the developing world, which are all started from lower than or equal to the position of South African in 1996 and surpassed it by 2014 (see Fig. 1b). Most of the developing countries show growth in re-based publication. Since this indicator is a “re-based” one, all the improvements of developing world would come at the price of other countries, mostly developed ones which are experiencing decline in this indicator over studied years. This decline is more profound in case of United States which has lost half of its share during the studied period, from down to . Among the BRICS countries, South Africa stands with the lowest share in quantity, which reflects the gap in scientific activity among this group. China stands way above the rest of the group with India, Brazil and Russia standing around the same position while South Africa is at the bottom.
This comparison reveals both the profound divergence in the quantity of scientific performance around the globe, the dynamics and movement that undergoes in scientific performance among the nations. The great gap between the USA and the rest of the world has started to close down, while China managed to secure a strong position way above the developed countries. Among all these fluctuations, South Africa was successful to at least have growth rate with pace of the average of the developing world.
III.2 Productivity: Re-Based Publication Per Population () and Per GDP ()
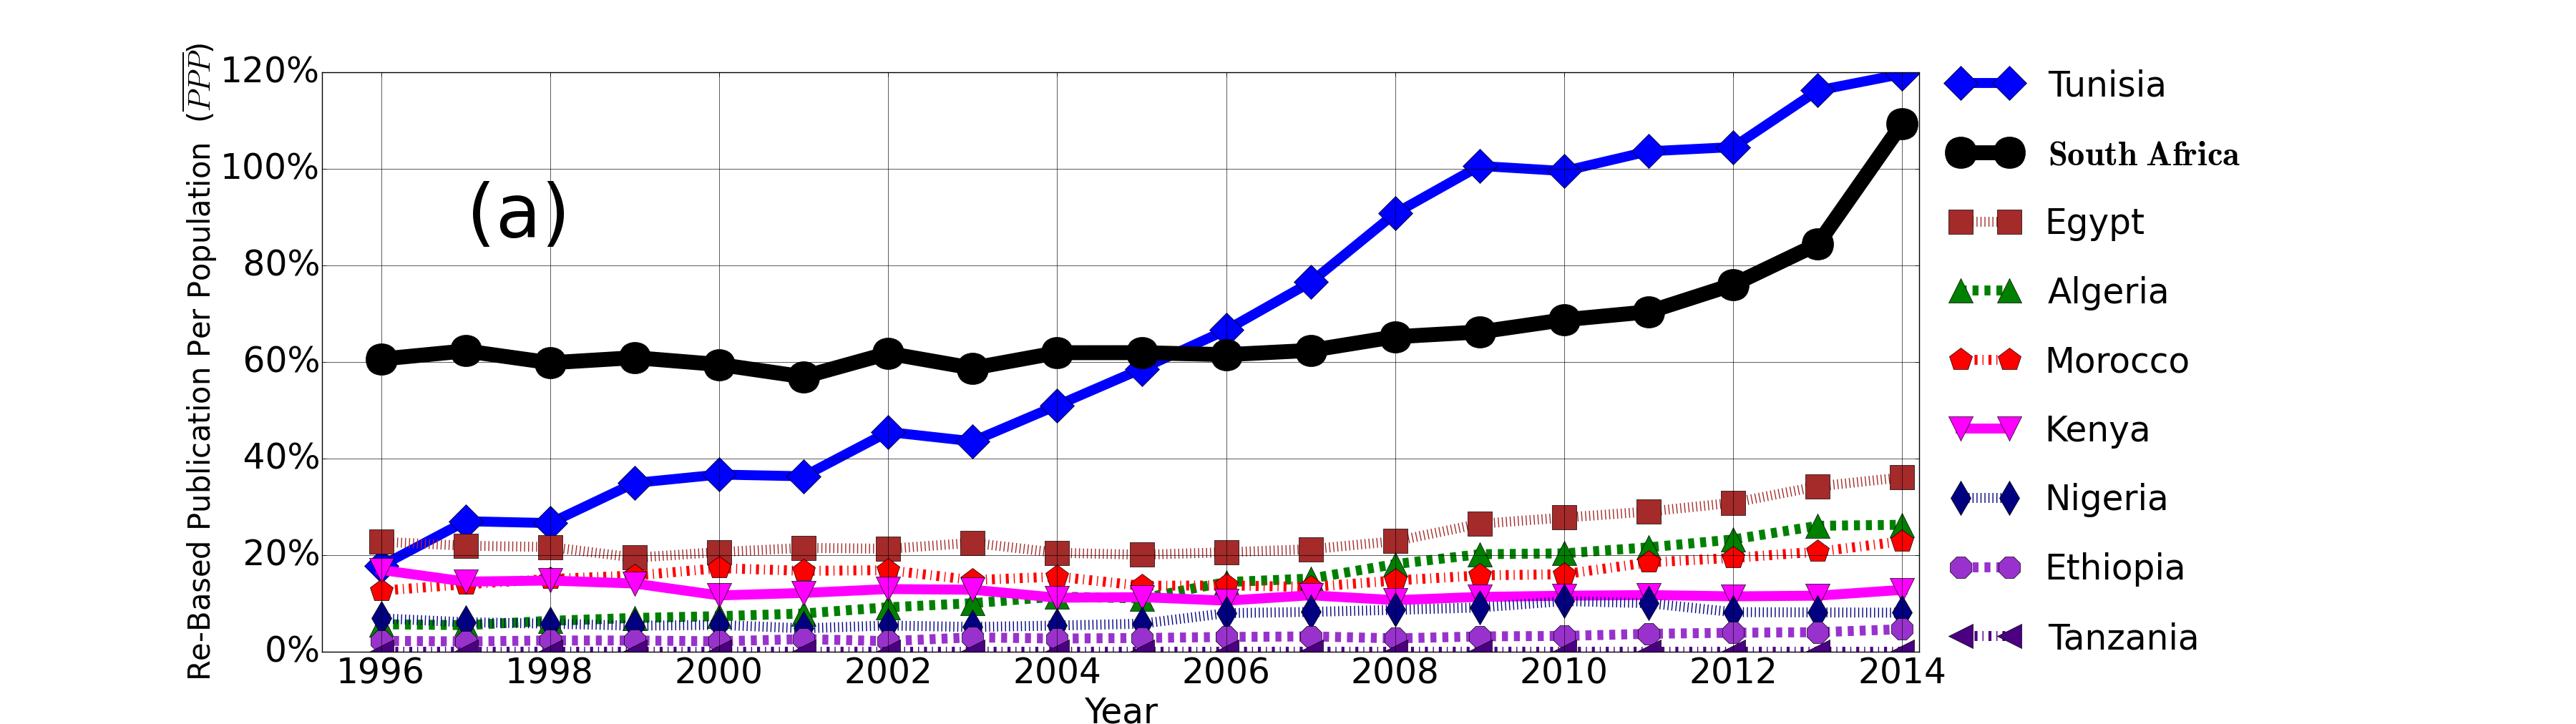
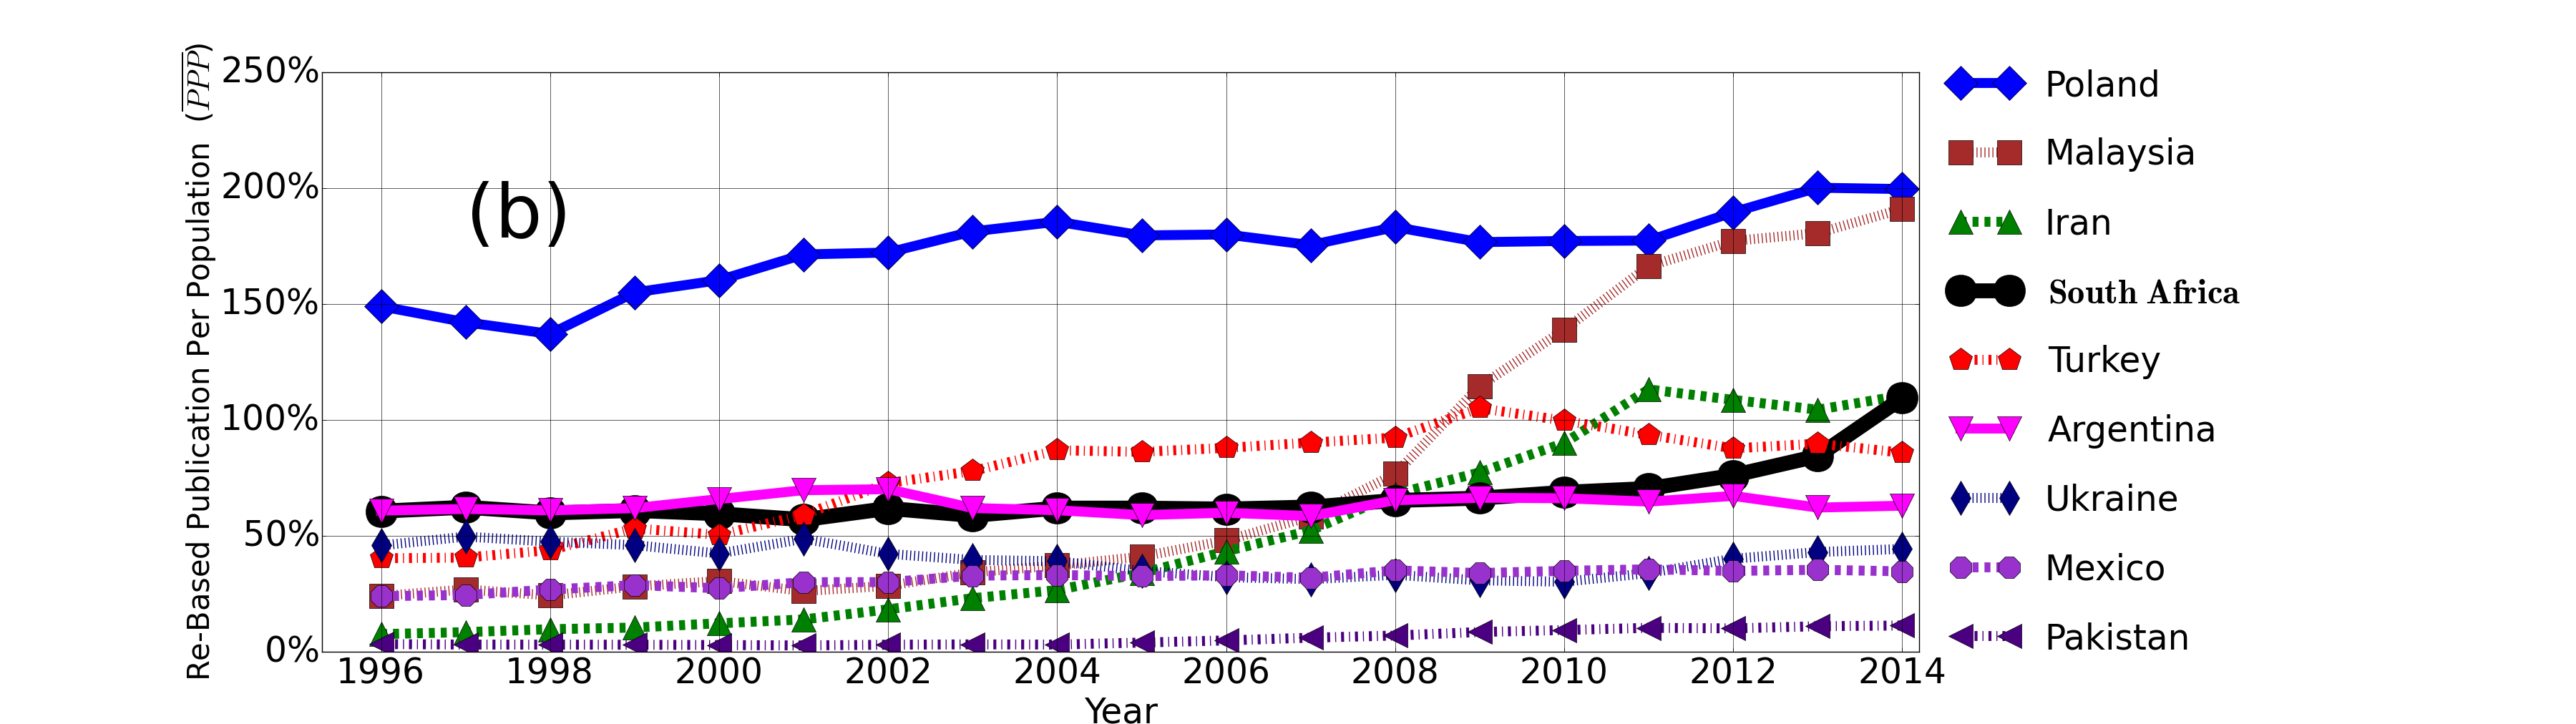
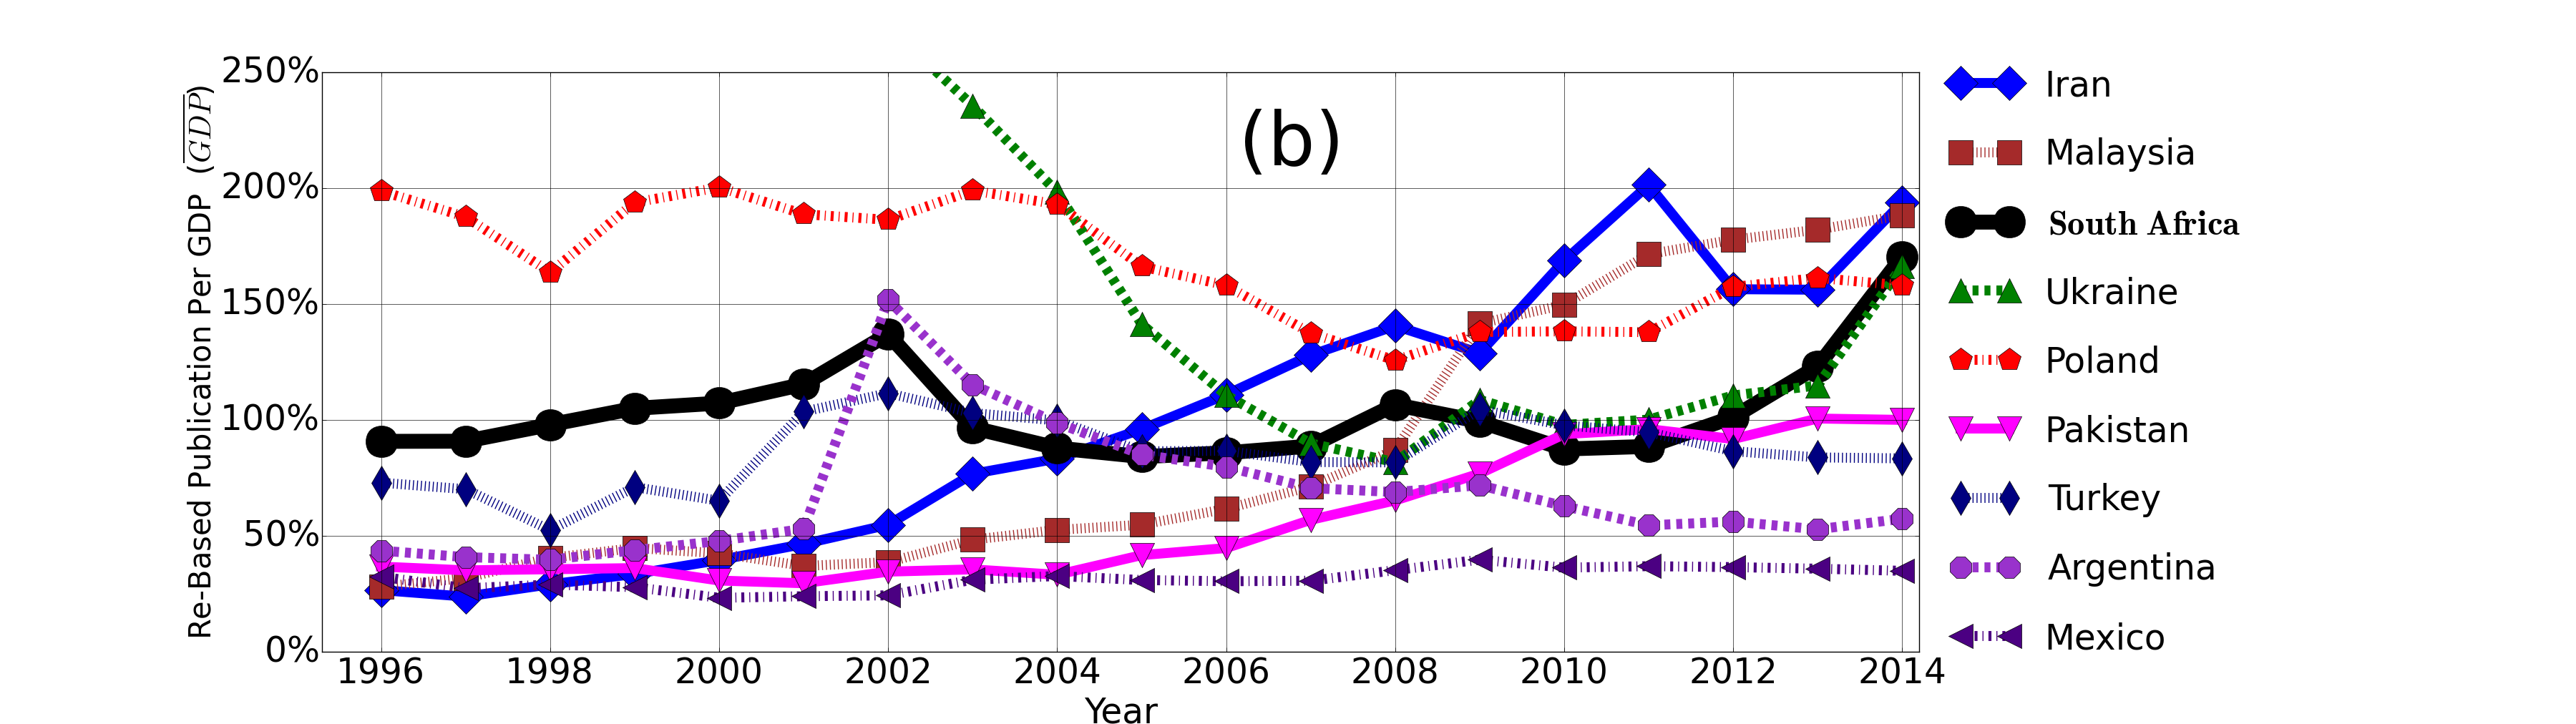
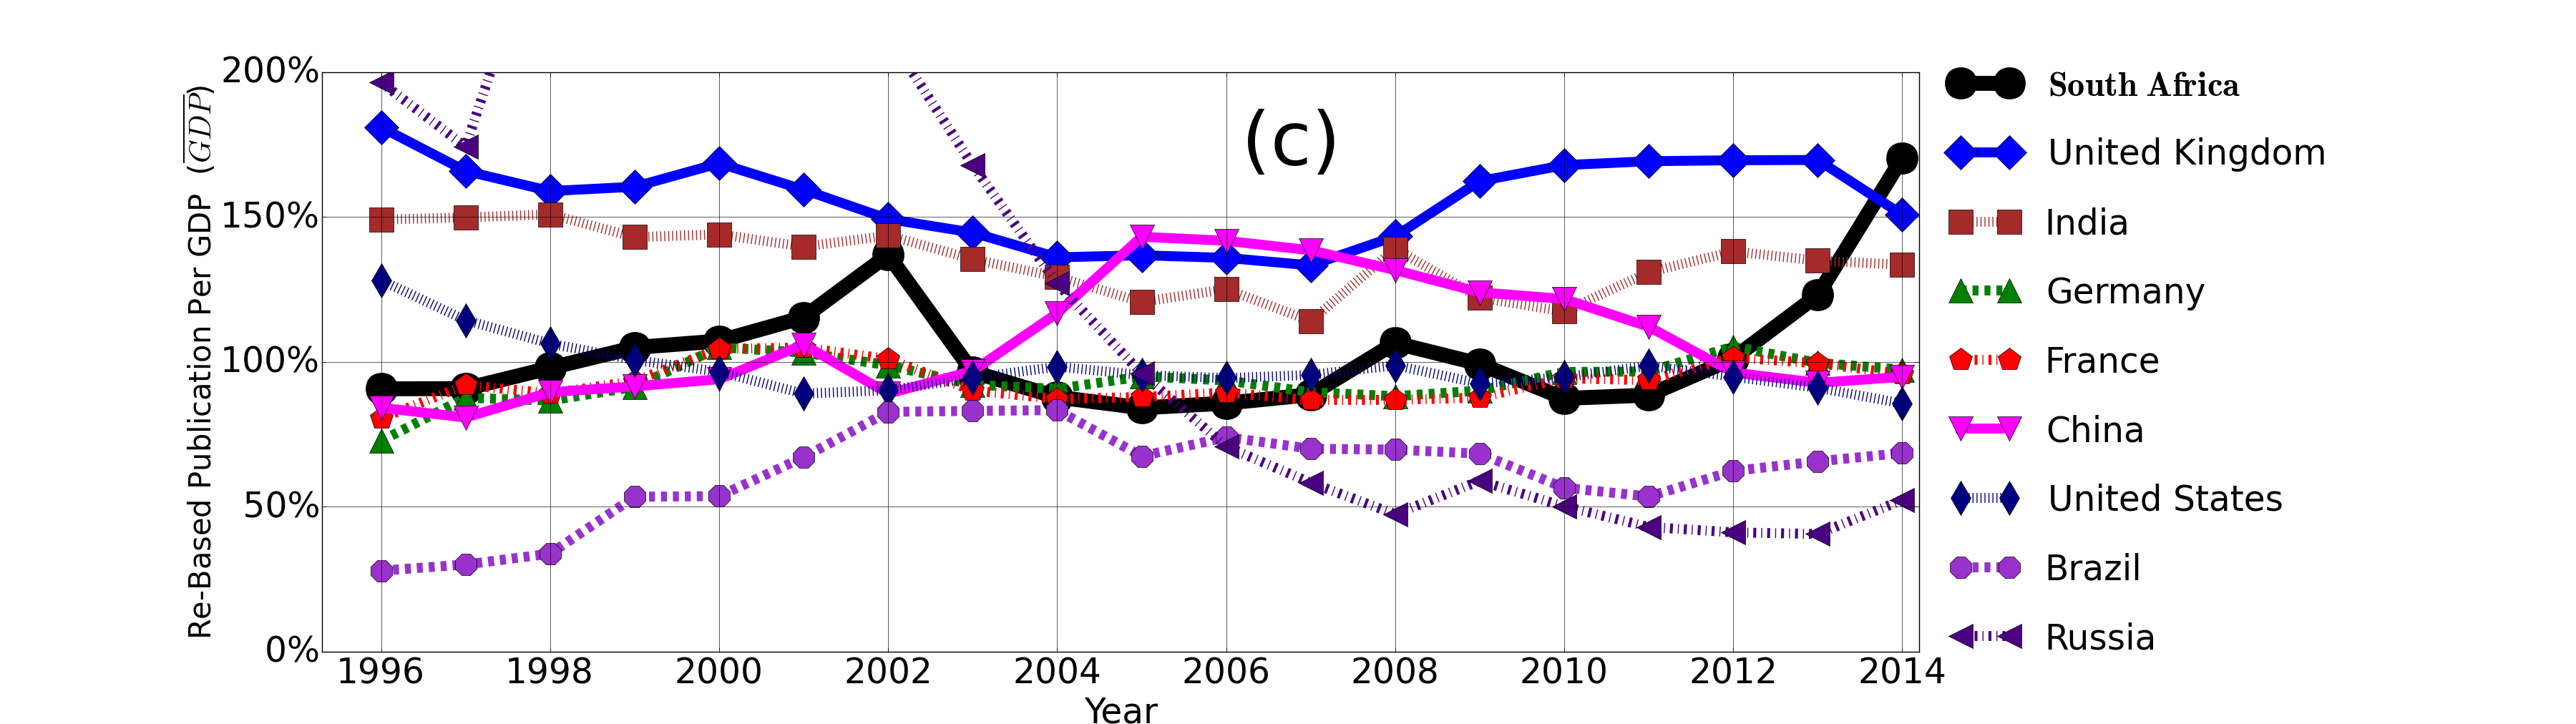
Here, both economical and human capital as an input to the scientific system of each countries have been considered in oder to measure the productivity of the nations. The value of stands a threshold, above which countries can be considered as productive. The idea is that a country should at least have the same share of world publications as its share of population or GDP. Figs. 2 and 3 present the comparisons for re-based publications per population () and per GDP () respectively.
In both these indicators, South Africa shows the productivity near the acceptable minimum of , . Relatively increasing tendency can be witnessed in both of them when considering the temporal evolution after post-apartheid era. In the context of Africa, Tunisia and South Africa dominate. Nevertheless, Tunisia supersedes South Africa in both the indicators by a considerable margin. When comparing developing countries, South Africa shows an average productivity; however, the temporal evolution of countries such as Iran, Malaysia and Turkey signals the great changes that have taken place during this era. Compared to these countries’ big jumps, South Africa has not shown that much of development. In contrast to the developing world, South Africa stands as above the rest of BRICS members, which is mostly due to the fact that the rest of BRICS countries possess much larger population or GDP compared to South Africa. In conclusion, South Africa’s scientific productivity (based on the definition presented here) shows a minimum acceptable level and has not changed considerably in post-apartheid era, which can be worrisome and a source of concern when considering the jumps that developing countries has enjoyed in the same era.
Furthermore, when comparing quantity and productivity, the polarity appearing in the quantity among the countries reduces dramatically in case of productivity, especially GDP-wise comparison. This shows that most of the movement and growth visible in the quantity originate from the disparity in the population or GDP of countries, which is a strong evidence of the relationship between financial growth and intensity of scientific activity. The growth in the productivity for most of the countries are limited compared to some of big jumps in the quantity, reflecting the difficulty in boosting productivity of a country.
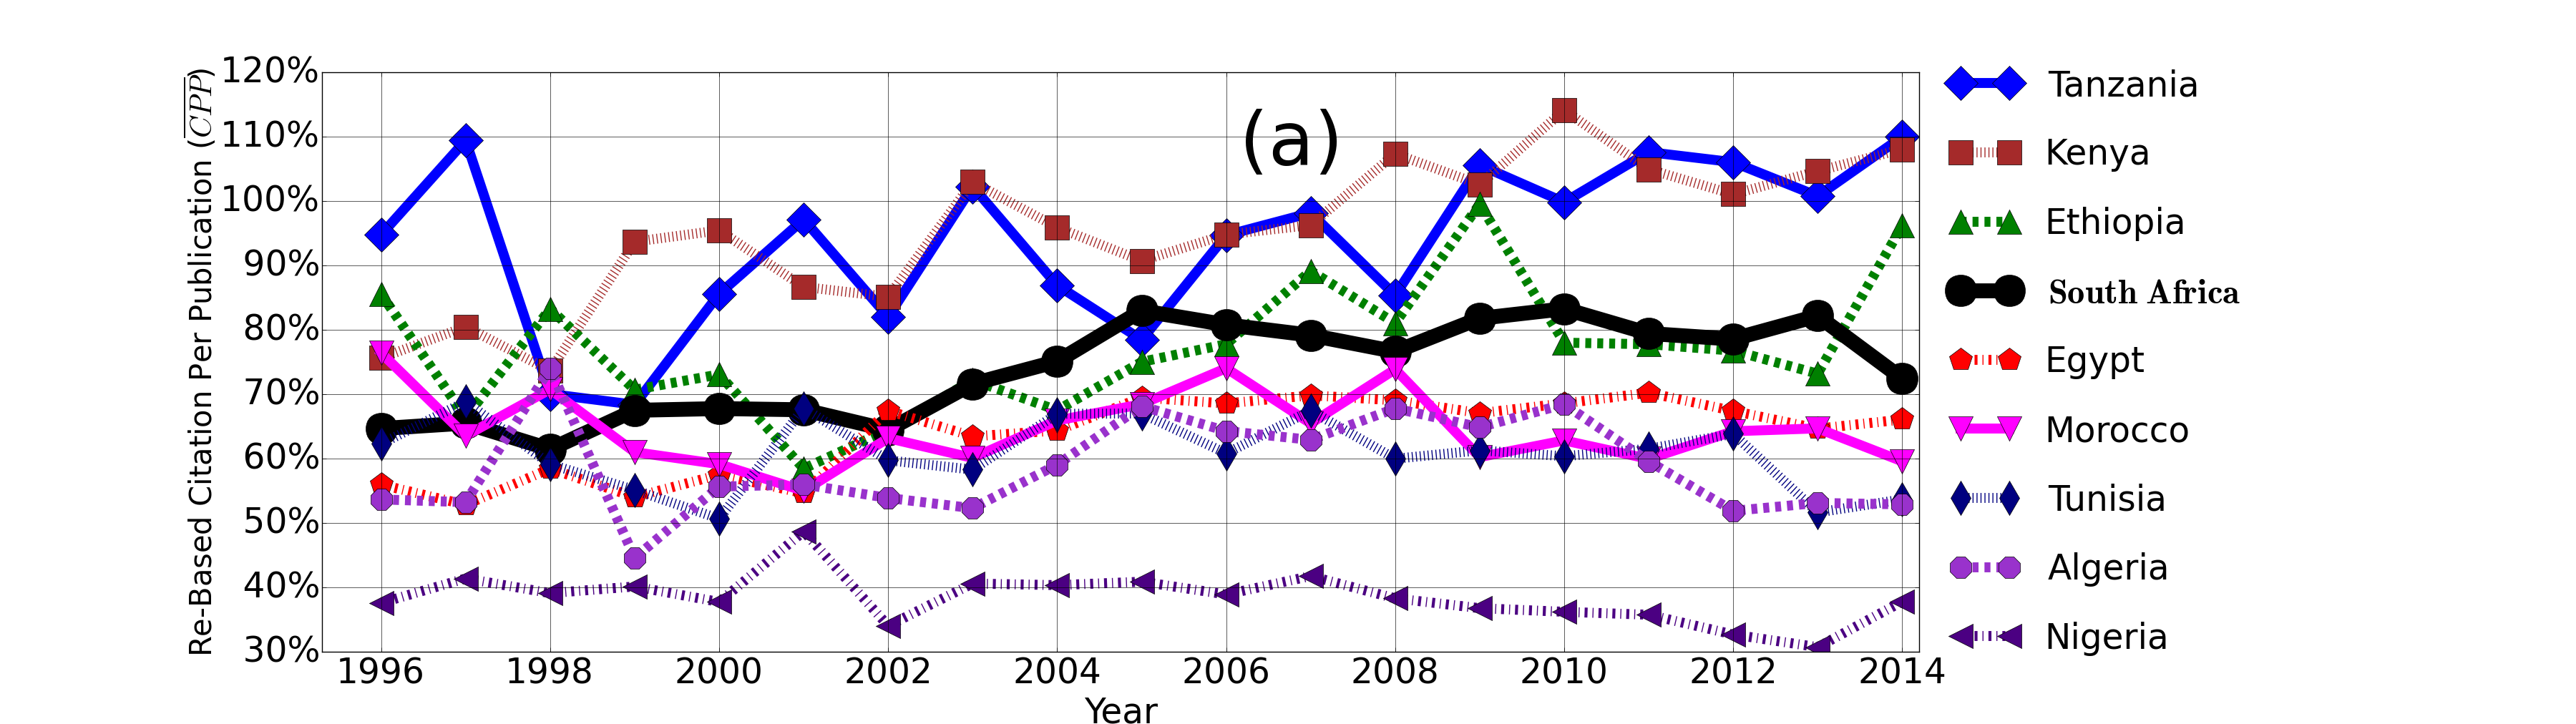
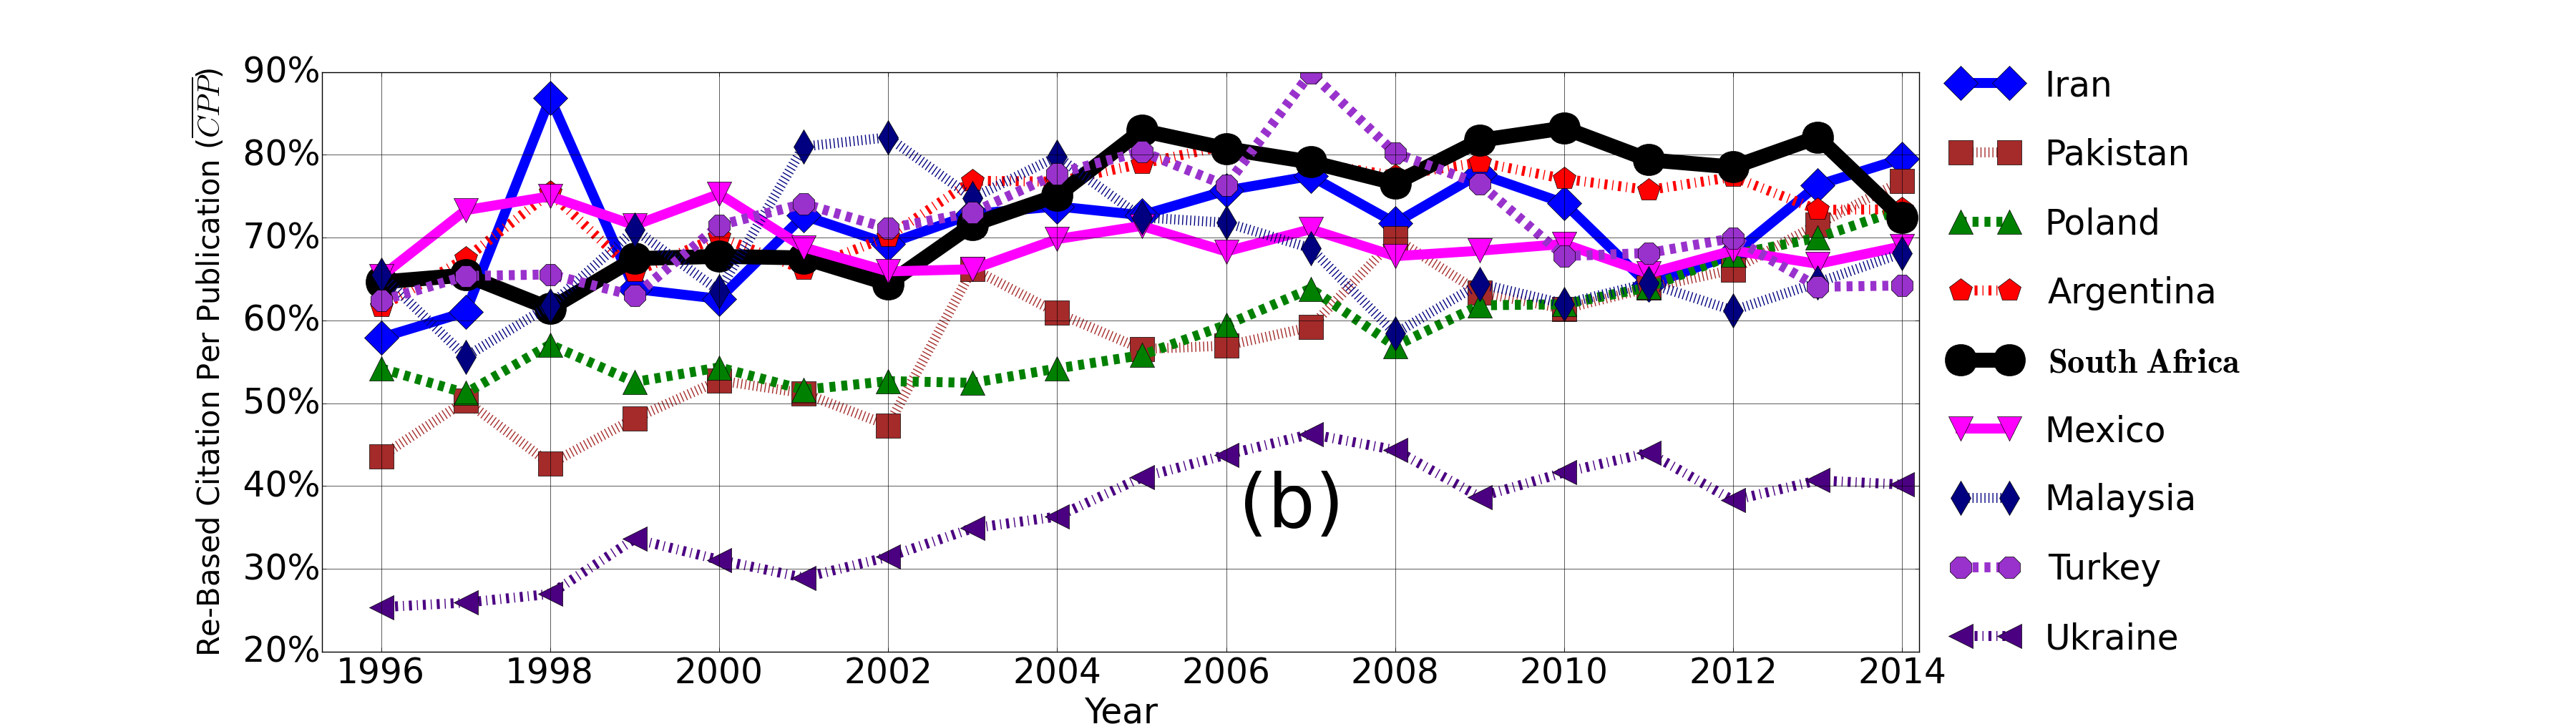
III.3 Impact: Re-Based Citation ()
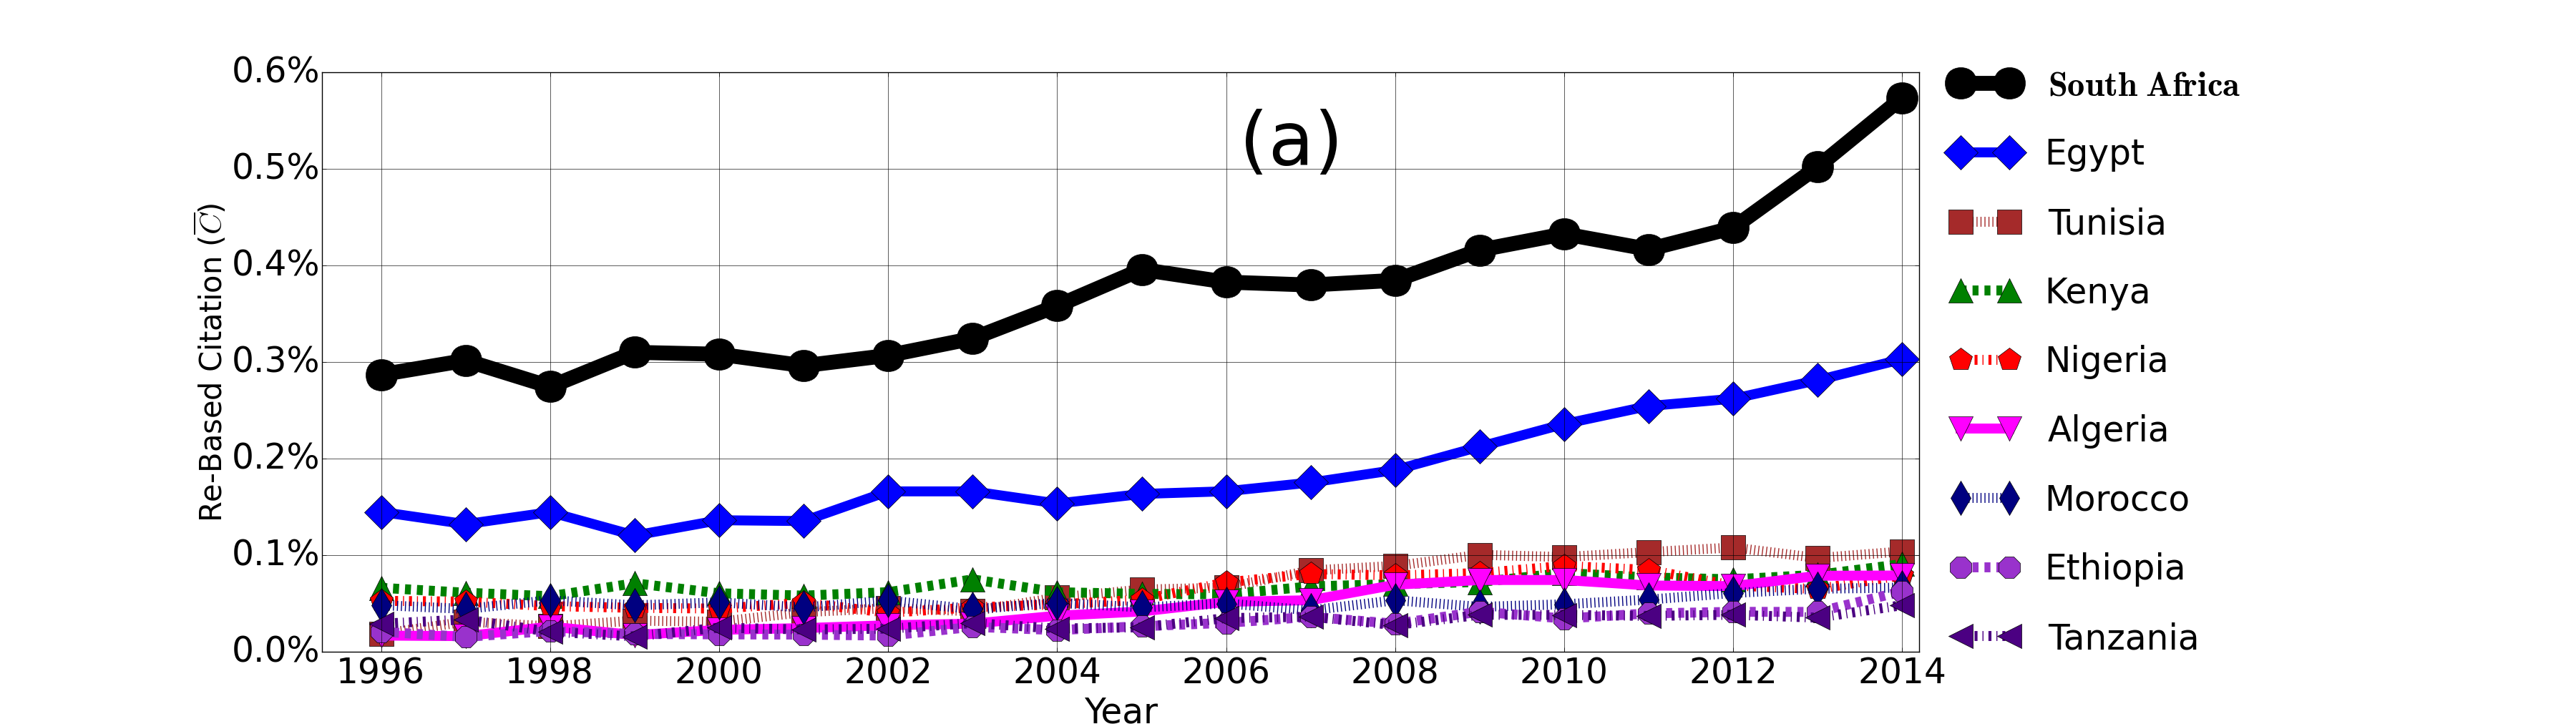
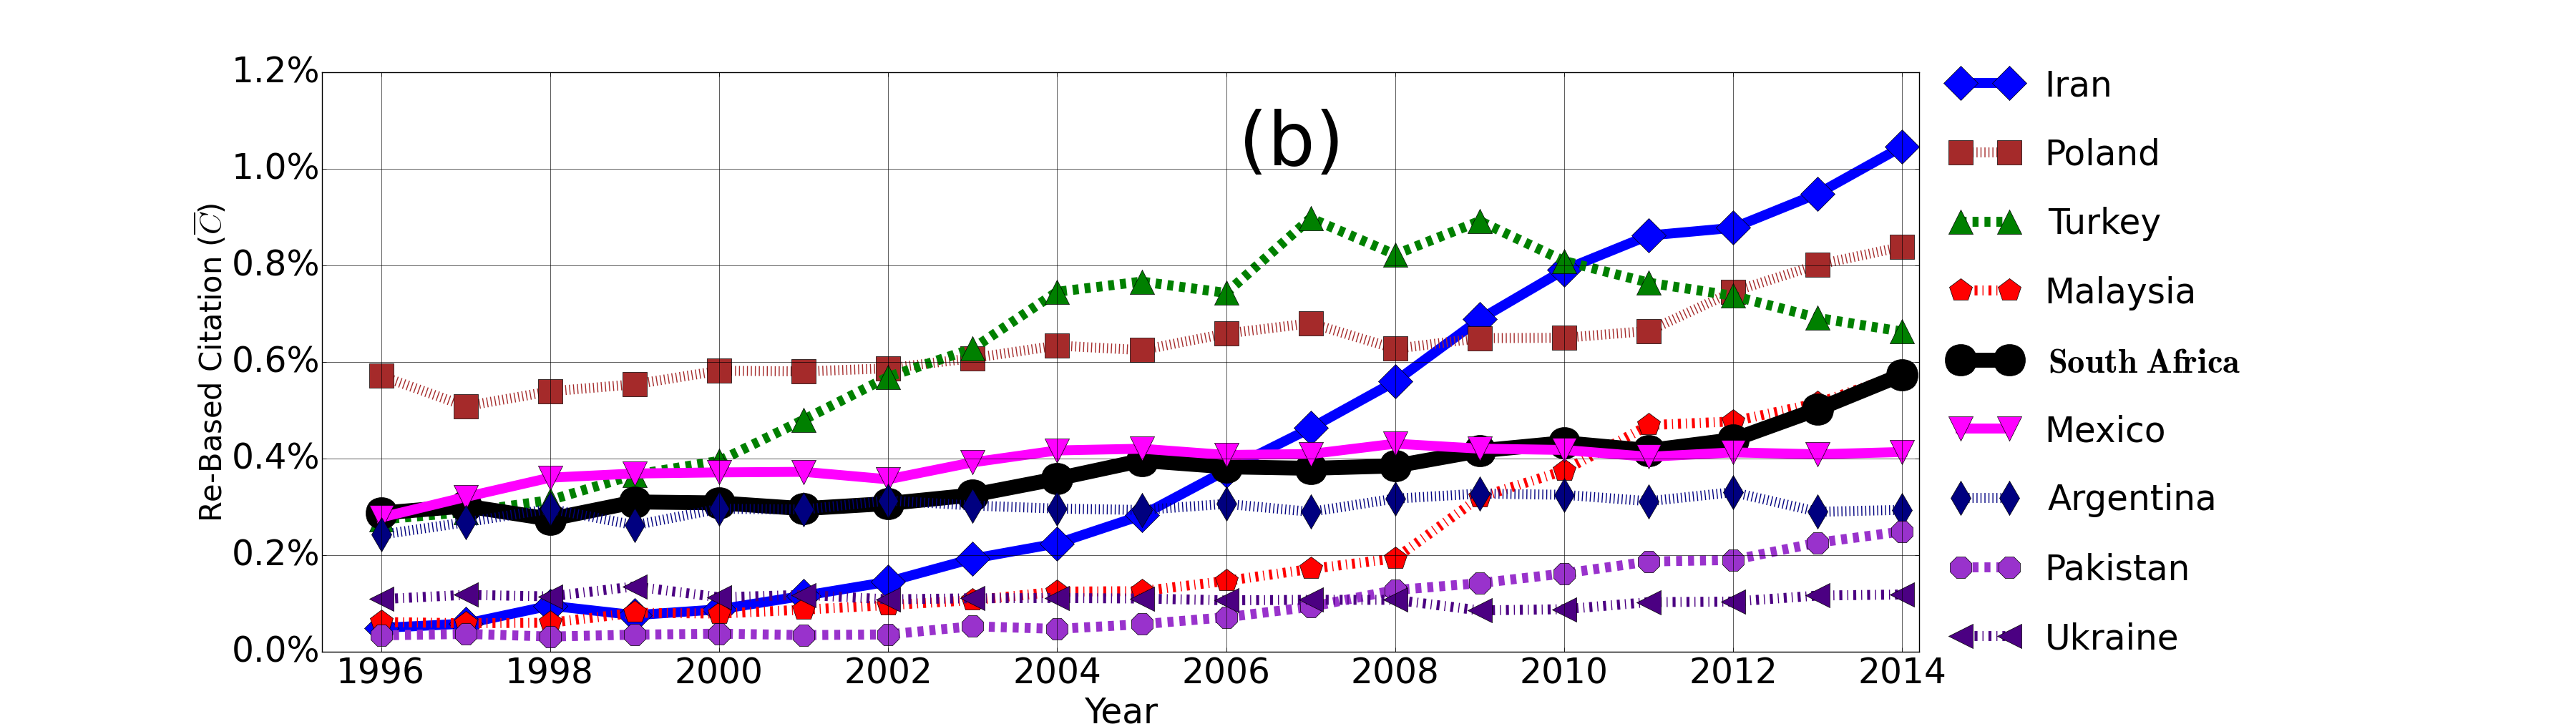
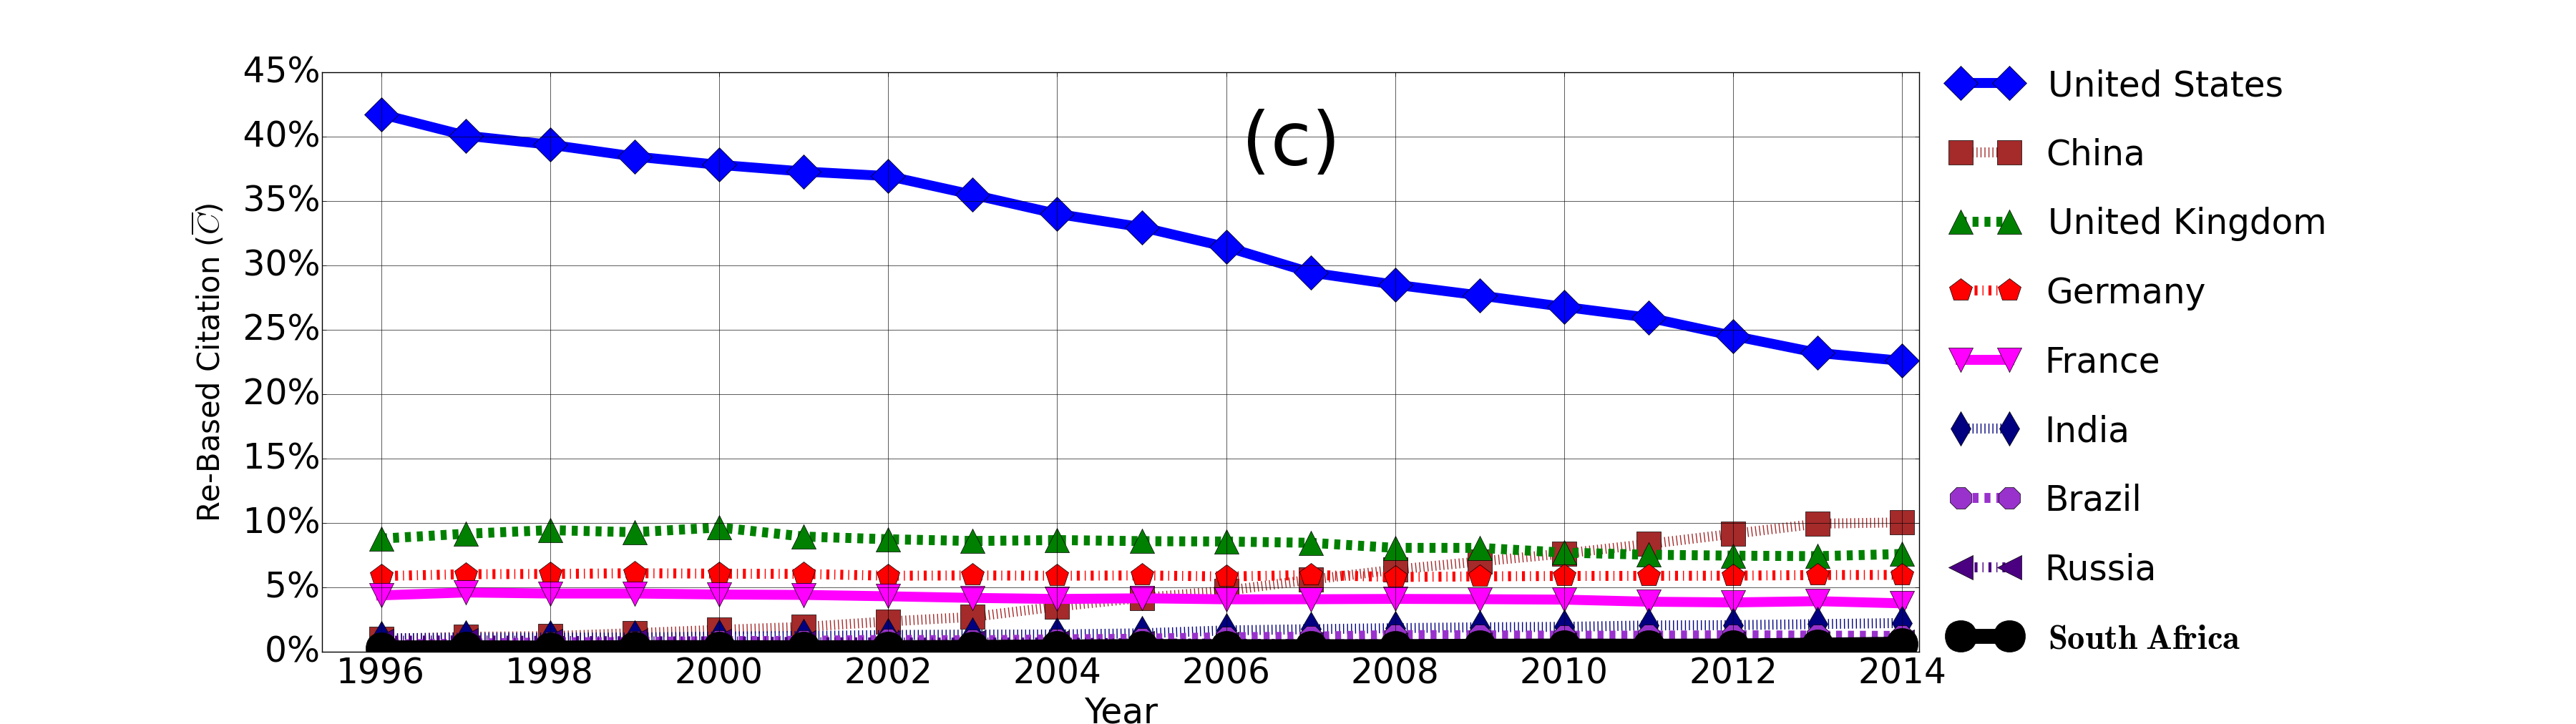
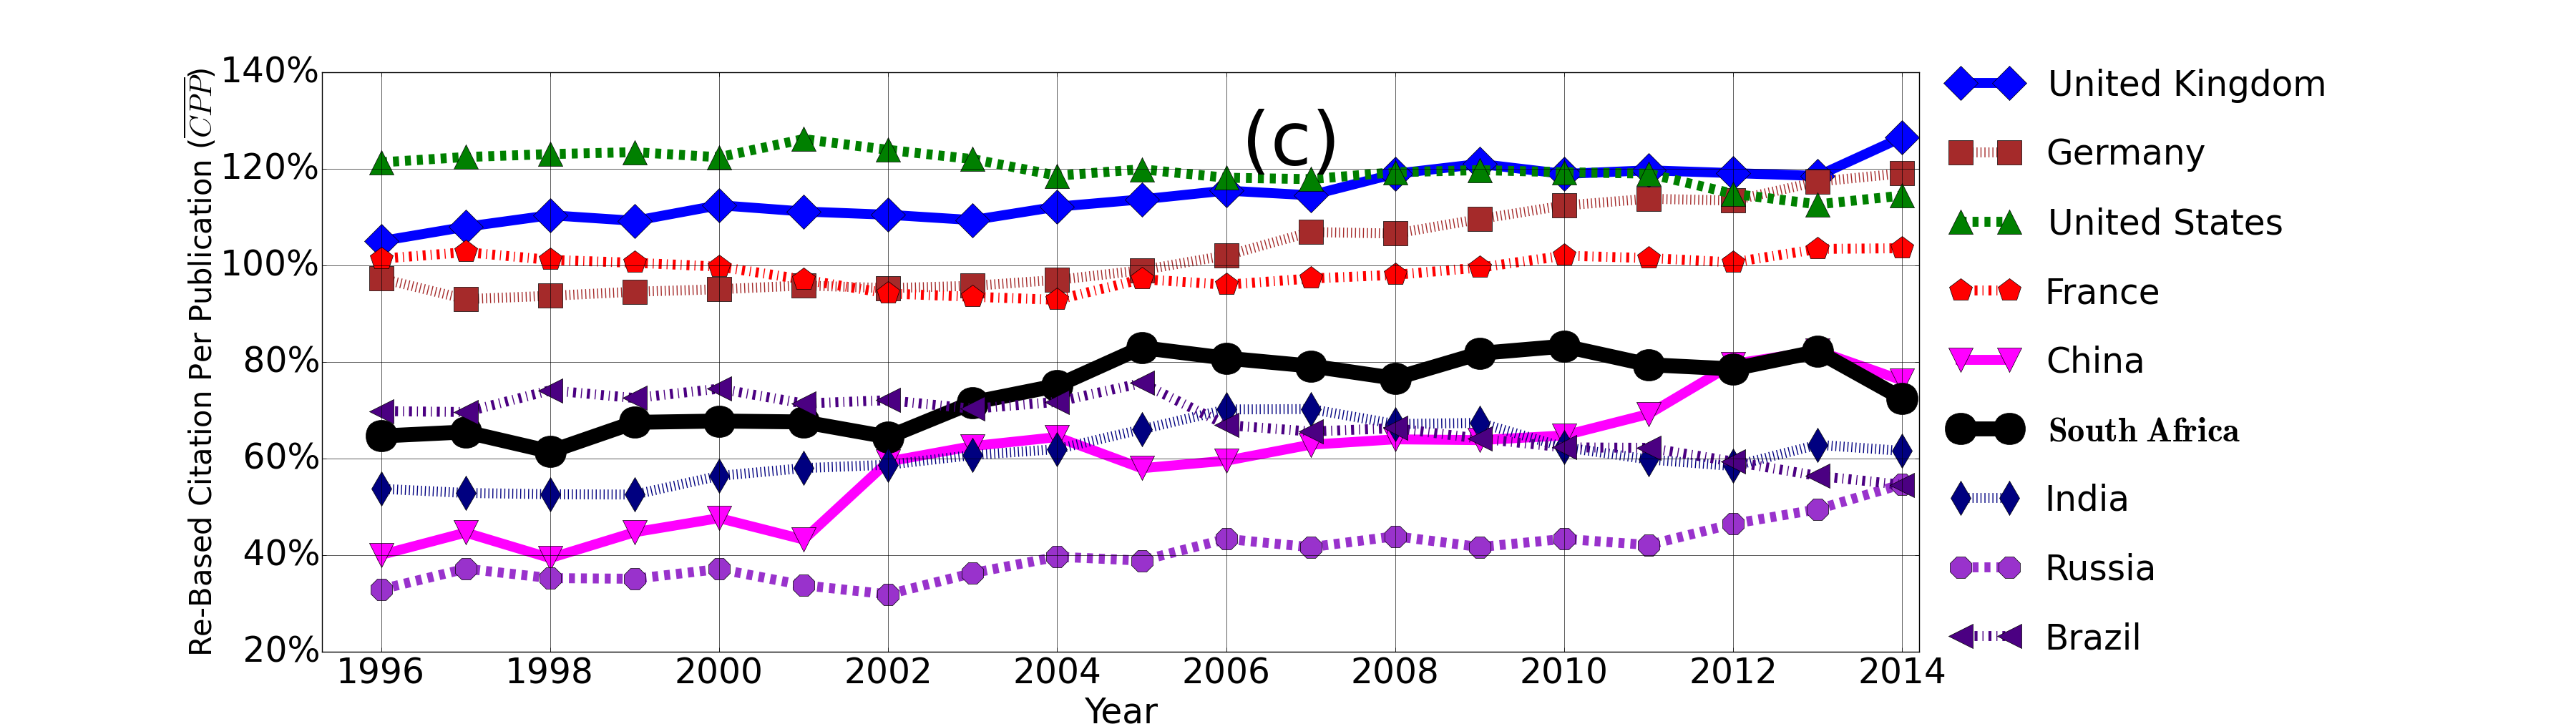
Certain dominance of South Africa in the re-based citation is well established among African countries, as its achievement during the studied period has always stayed far above the rest of the group (Fig. 4). Furthermore, South Africa managed to double its impact during this era. However, comparison with developing countries reveals that the overall tendency among these countries have grown and in some cases has shown, e.g. Iran, Turkey and Malaysia substantial jumps. South African scientific impact on the global level () is still limited (), as it stands the lowest among BRICS countries and average among developing world.
United States shows a preeminent impact throughout the studied years; however, decreasing tendency exists, even in the last year ()of the study it stands twice the value of the next giant China ().
III.4 Quality: Re-Based Citation Per Publication ()
shows the average quality, meaning that a country should receive at least the same portion of citation of the world as its share of the world’s publication. South Africa, although growing, remains below the average quality, showing the struggle ahead for improving the quality of the research in the country. The same challenge exists for almost all the developing countries, as most of them show the same below-average quality.
In the context of the developed and BRICS countries, South Africa stands as the mean value between these two sets of countries. Almost all the countries in this group show growth in their quality, especially China, Germany and France. In contrast to the quantity of scientific performance of the same group of countries, it can be witnessed that although most of the developed countries are losing ground to the developing world in the quantity of publications, their quality stays the same or even increases.
III.5 Global rankings and distributions
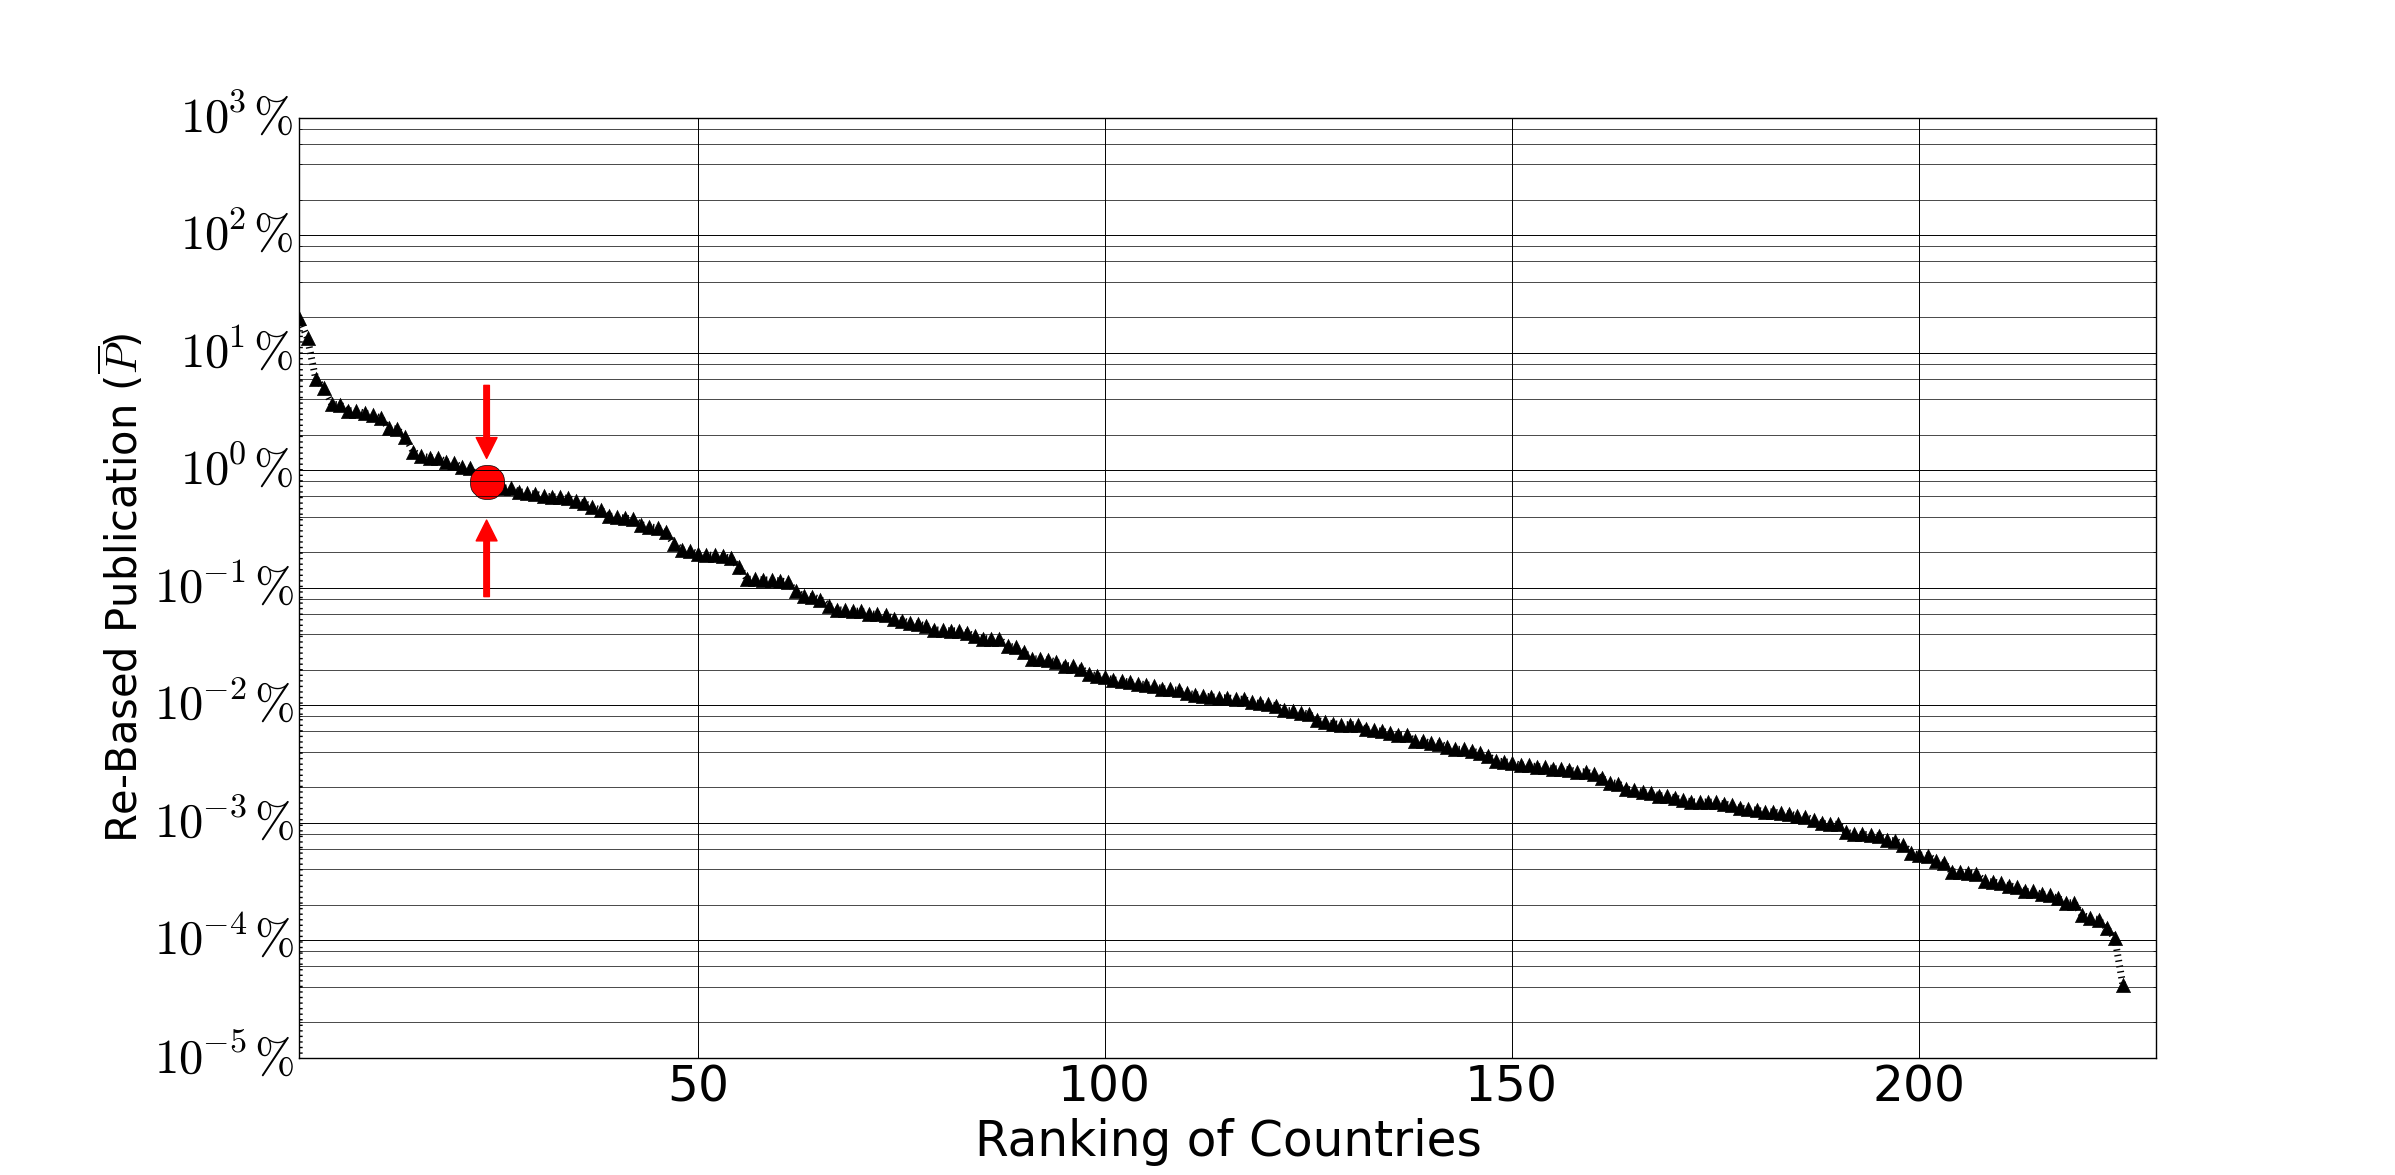
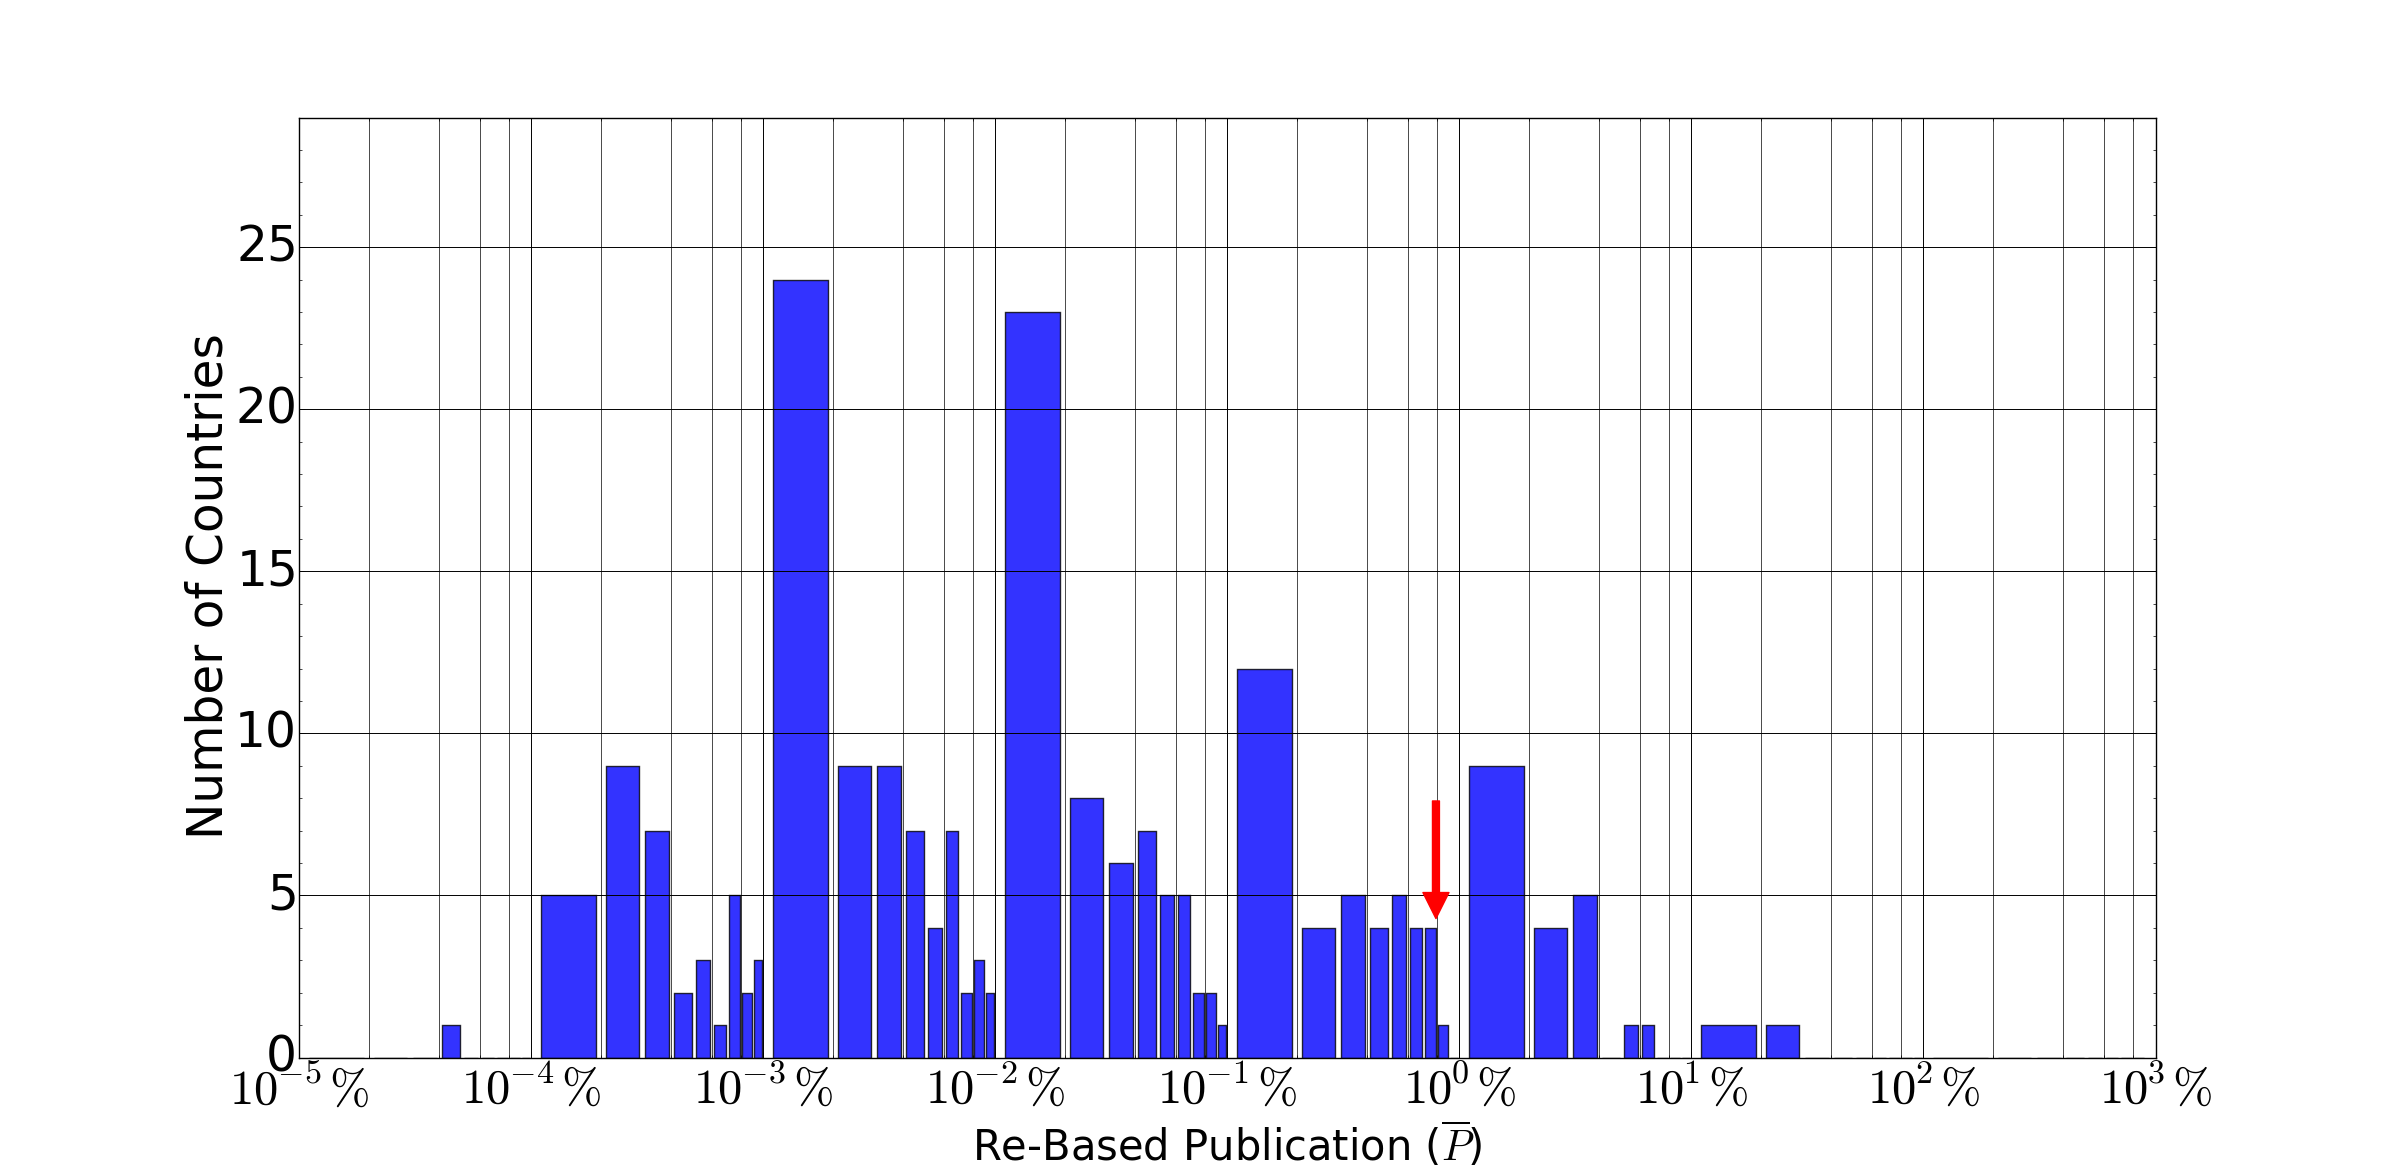
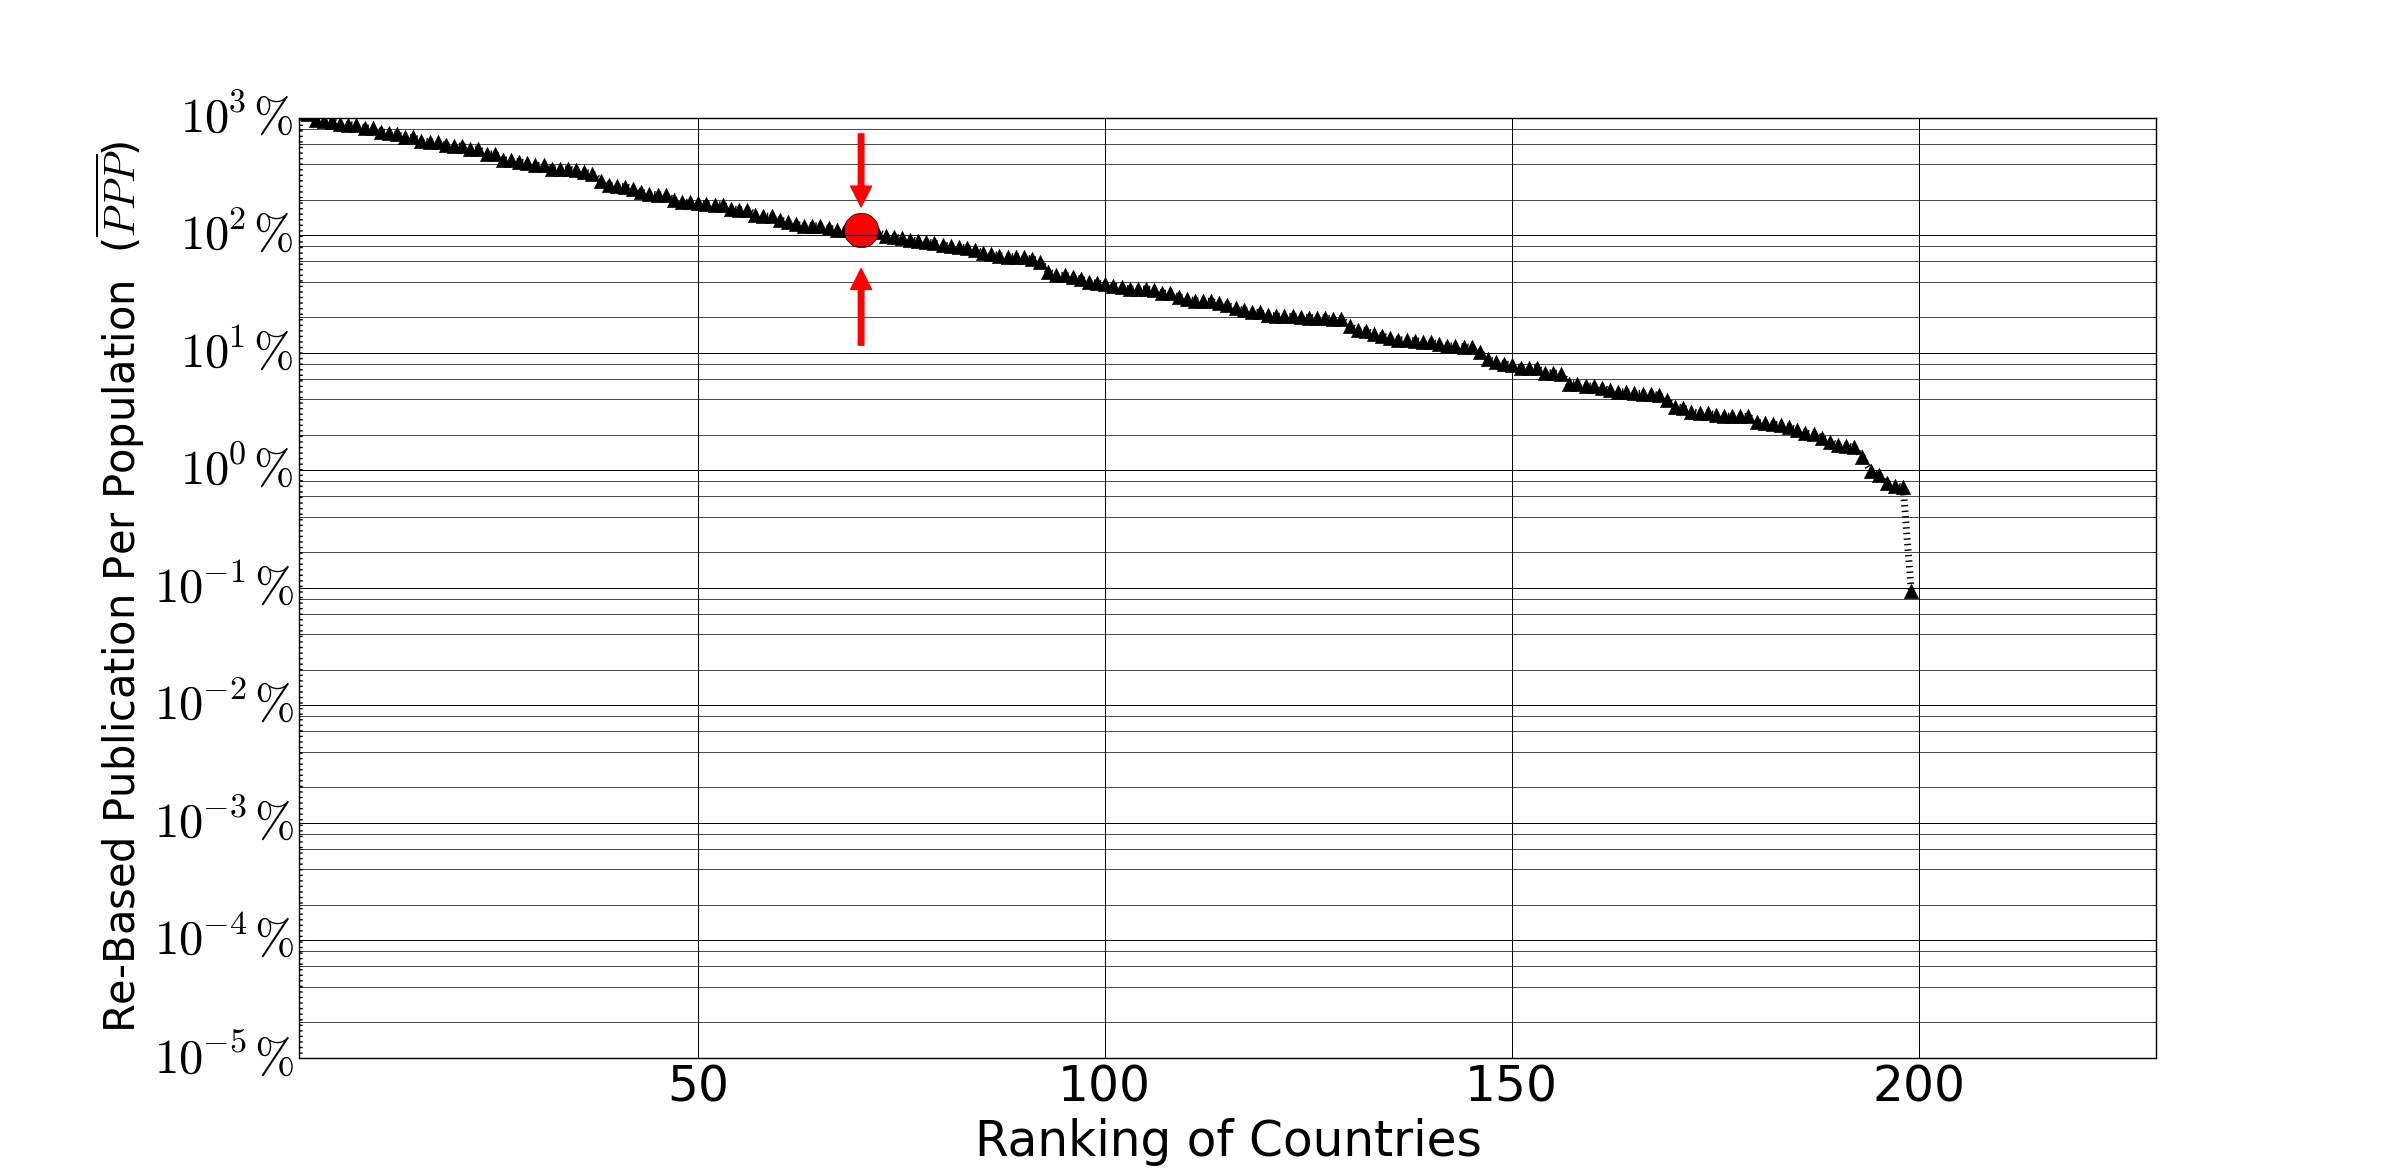
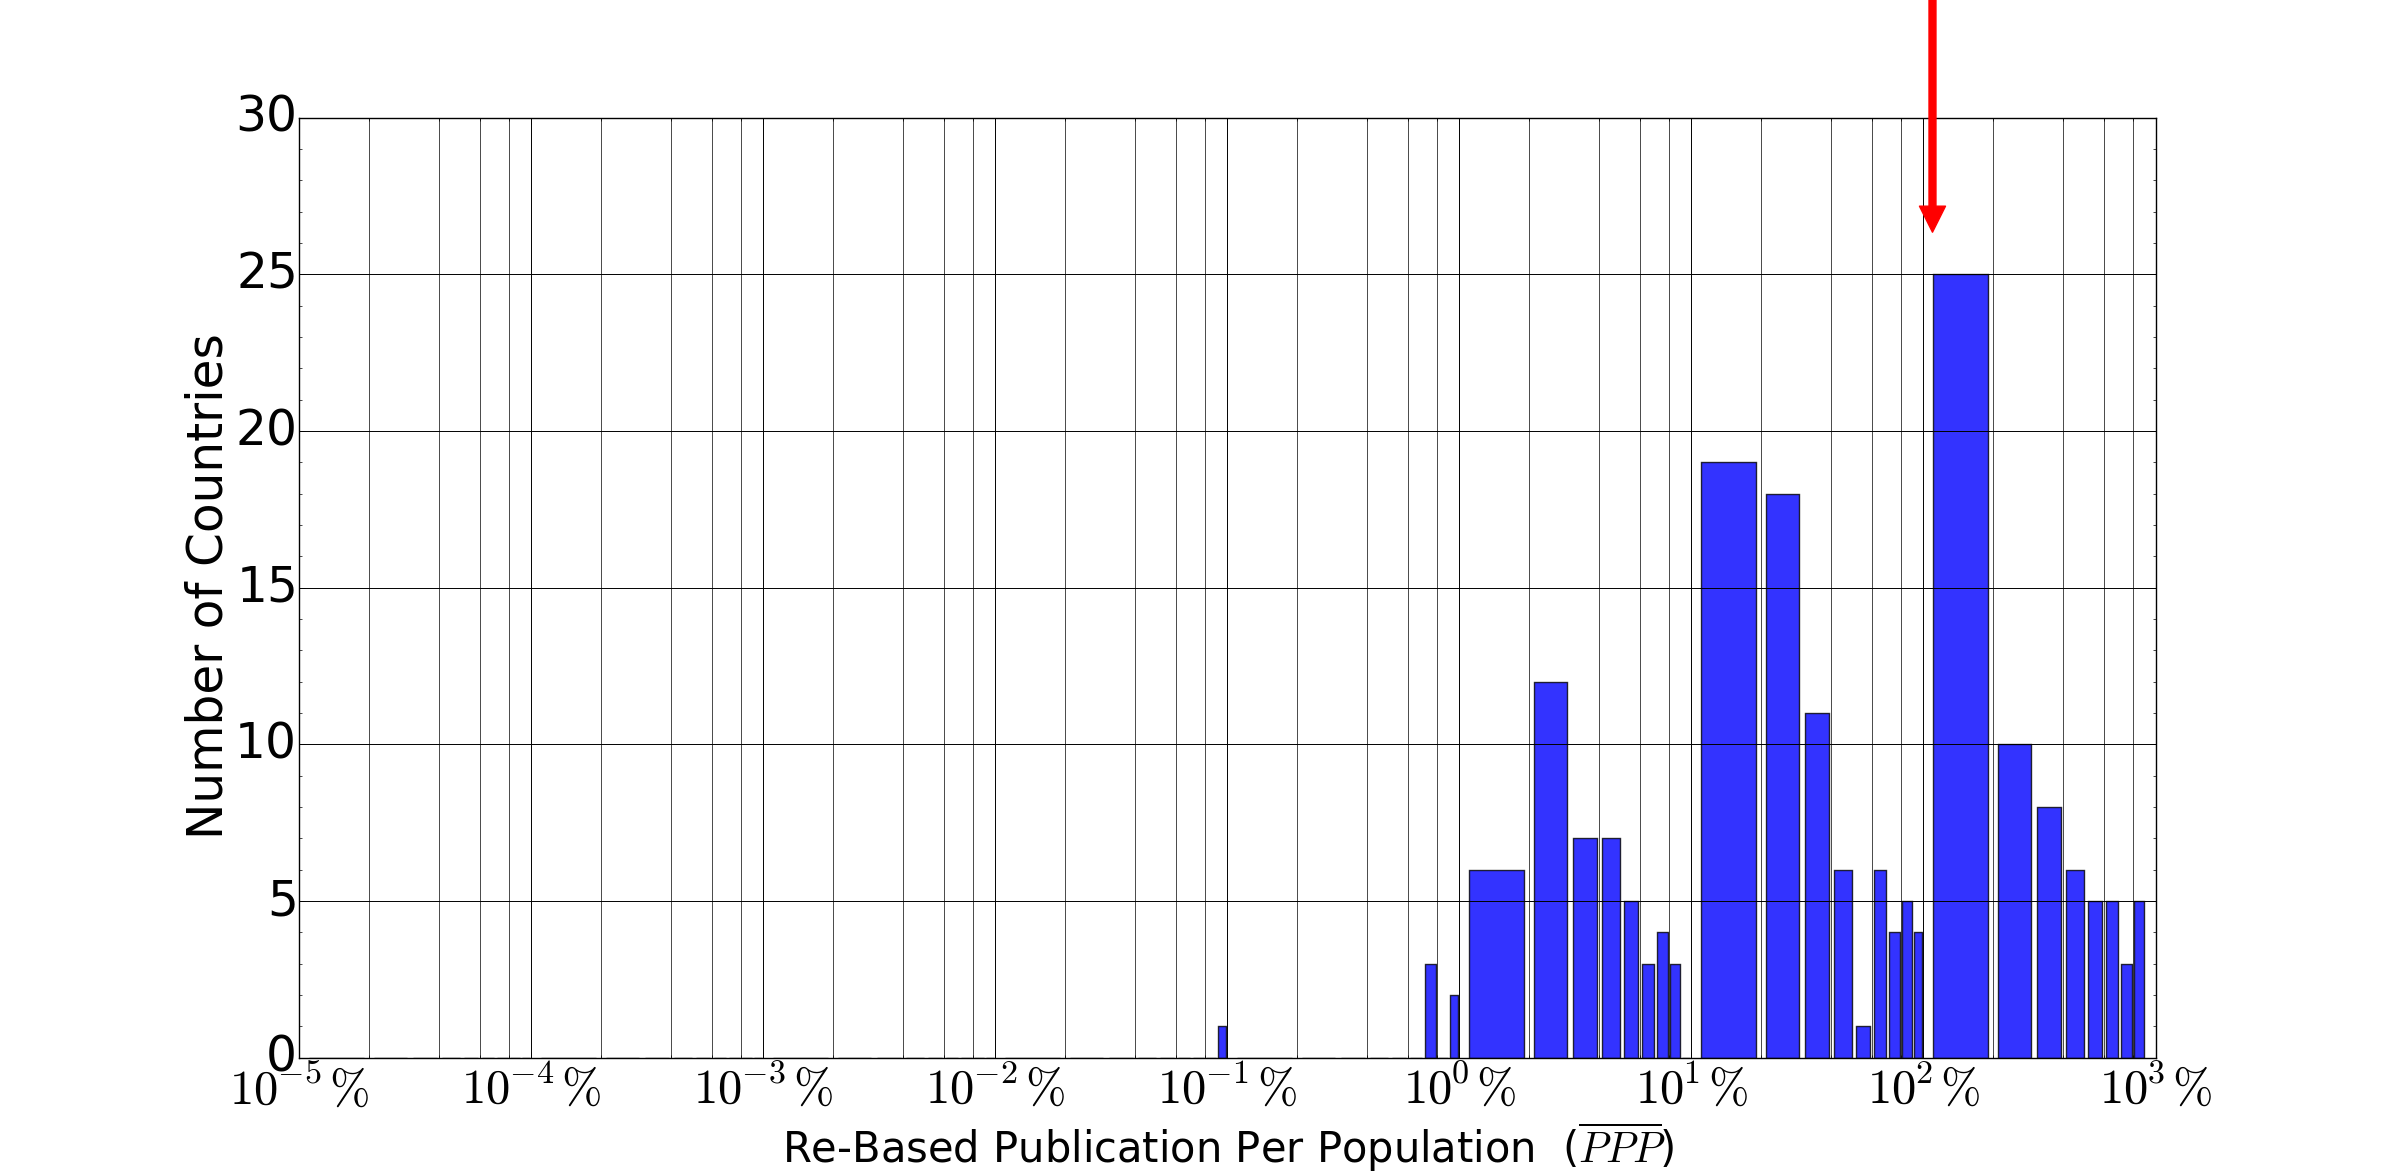
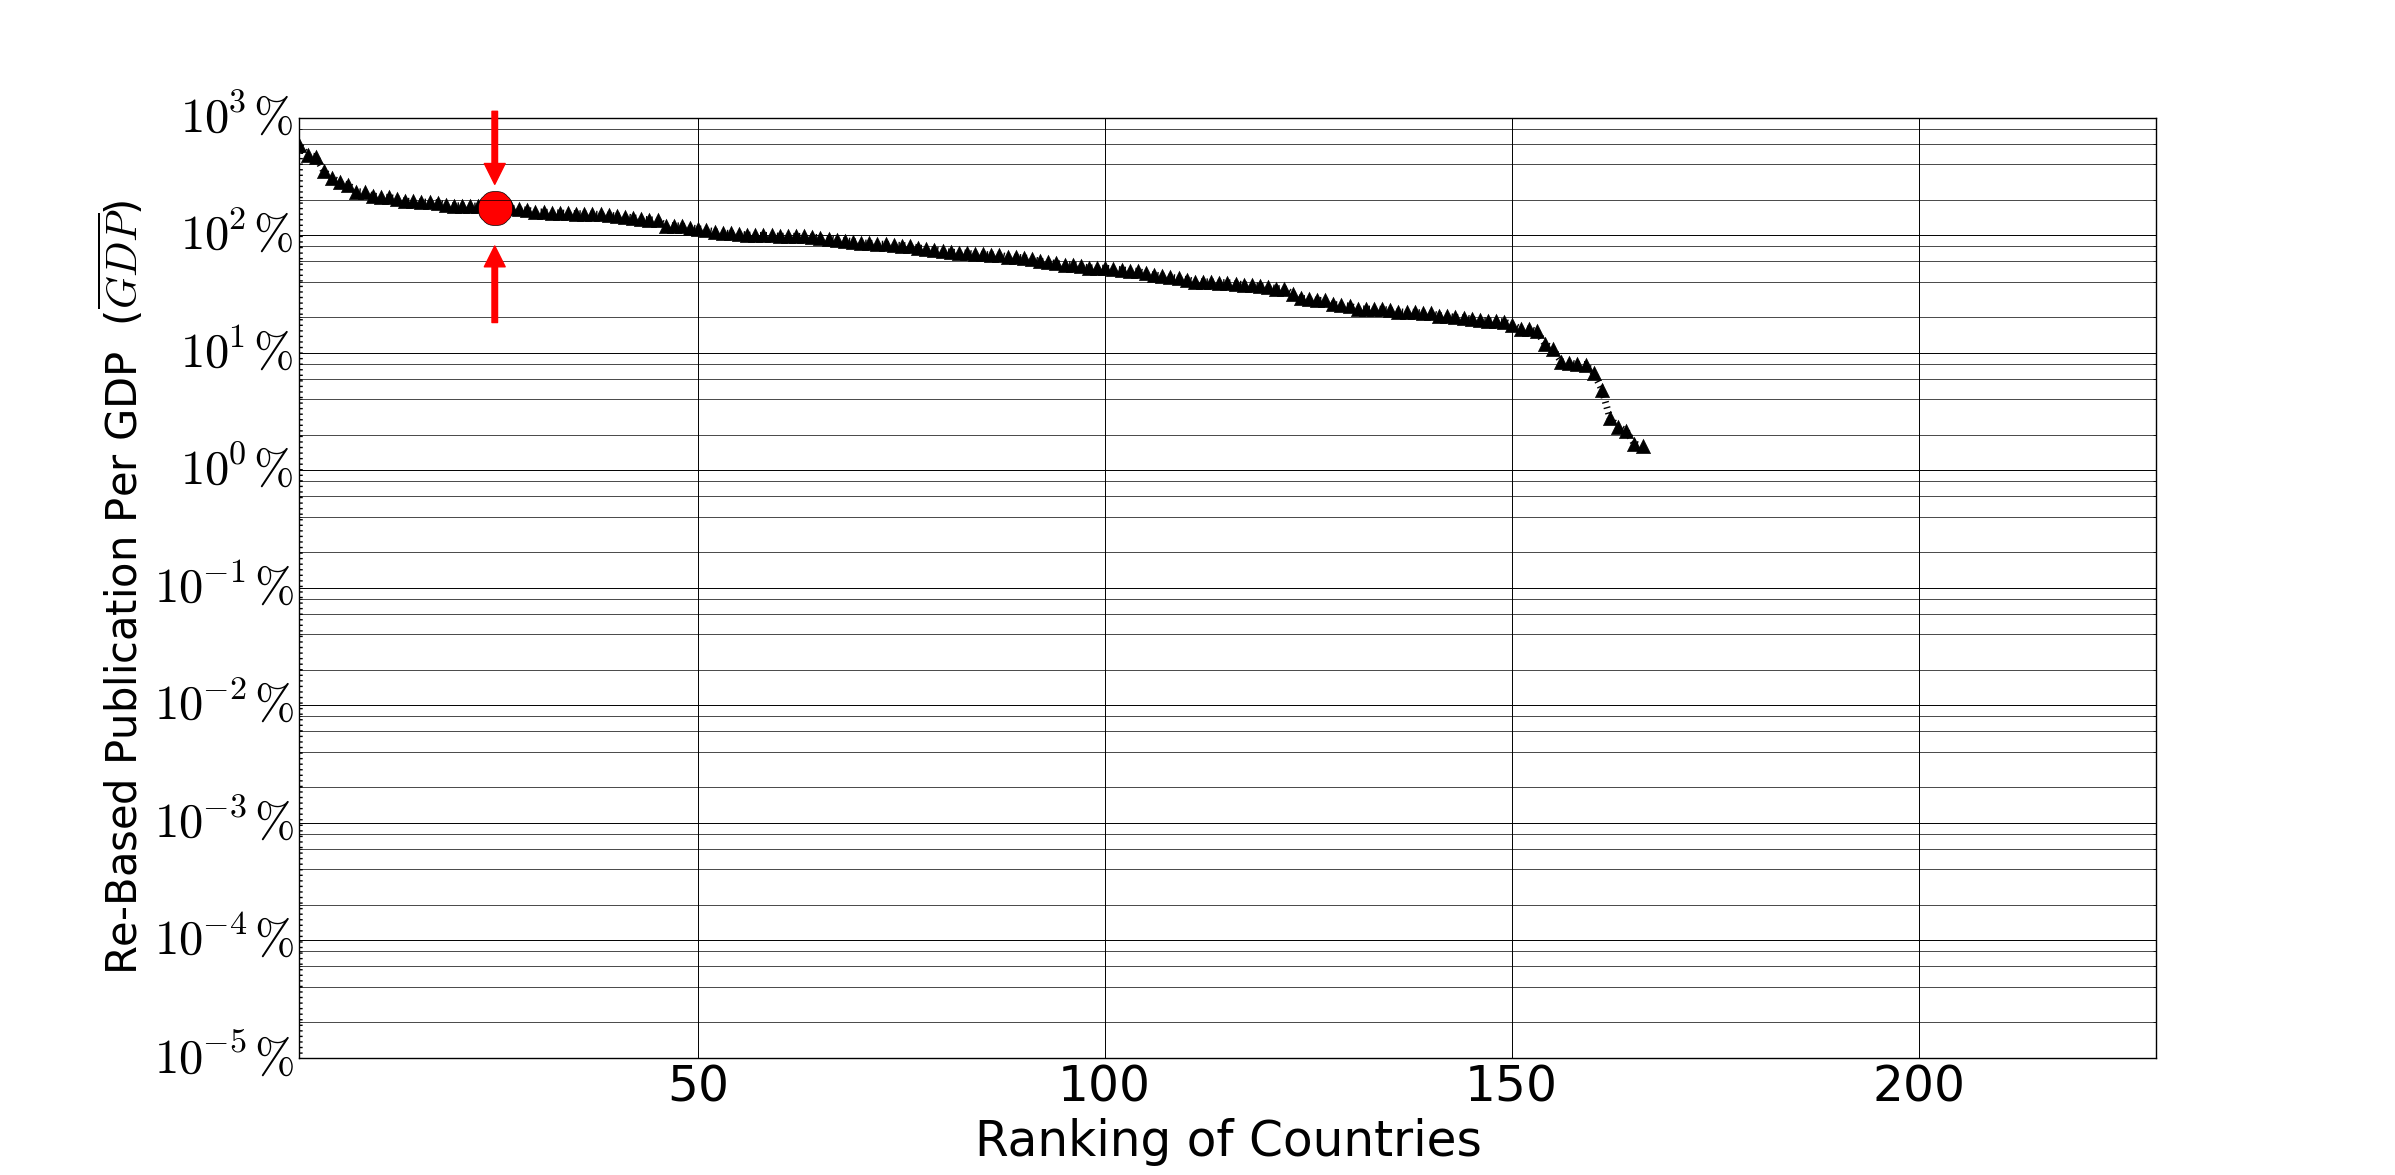
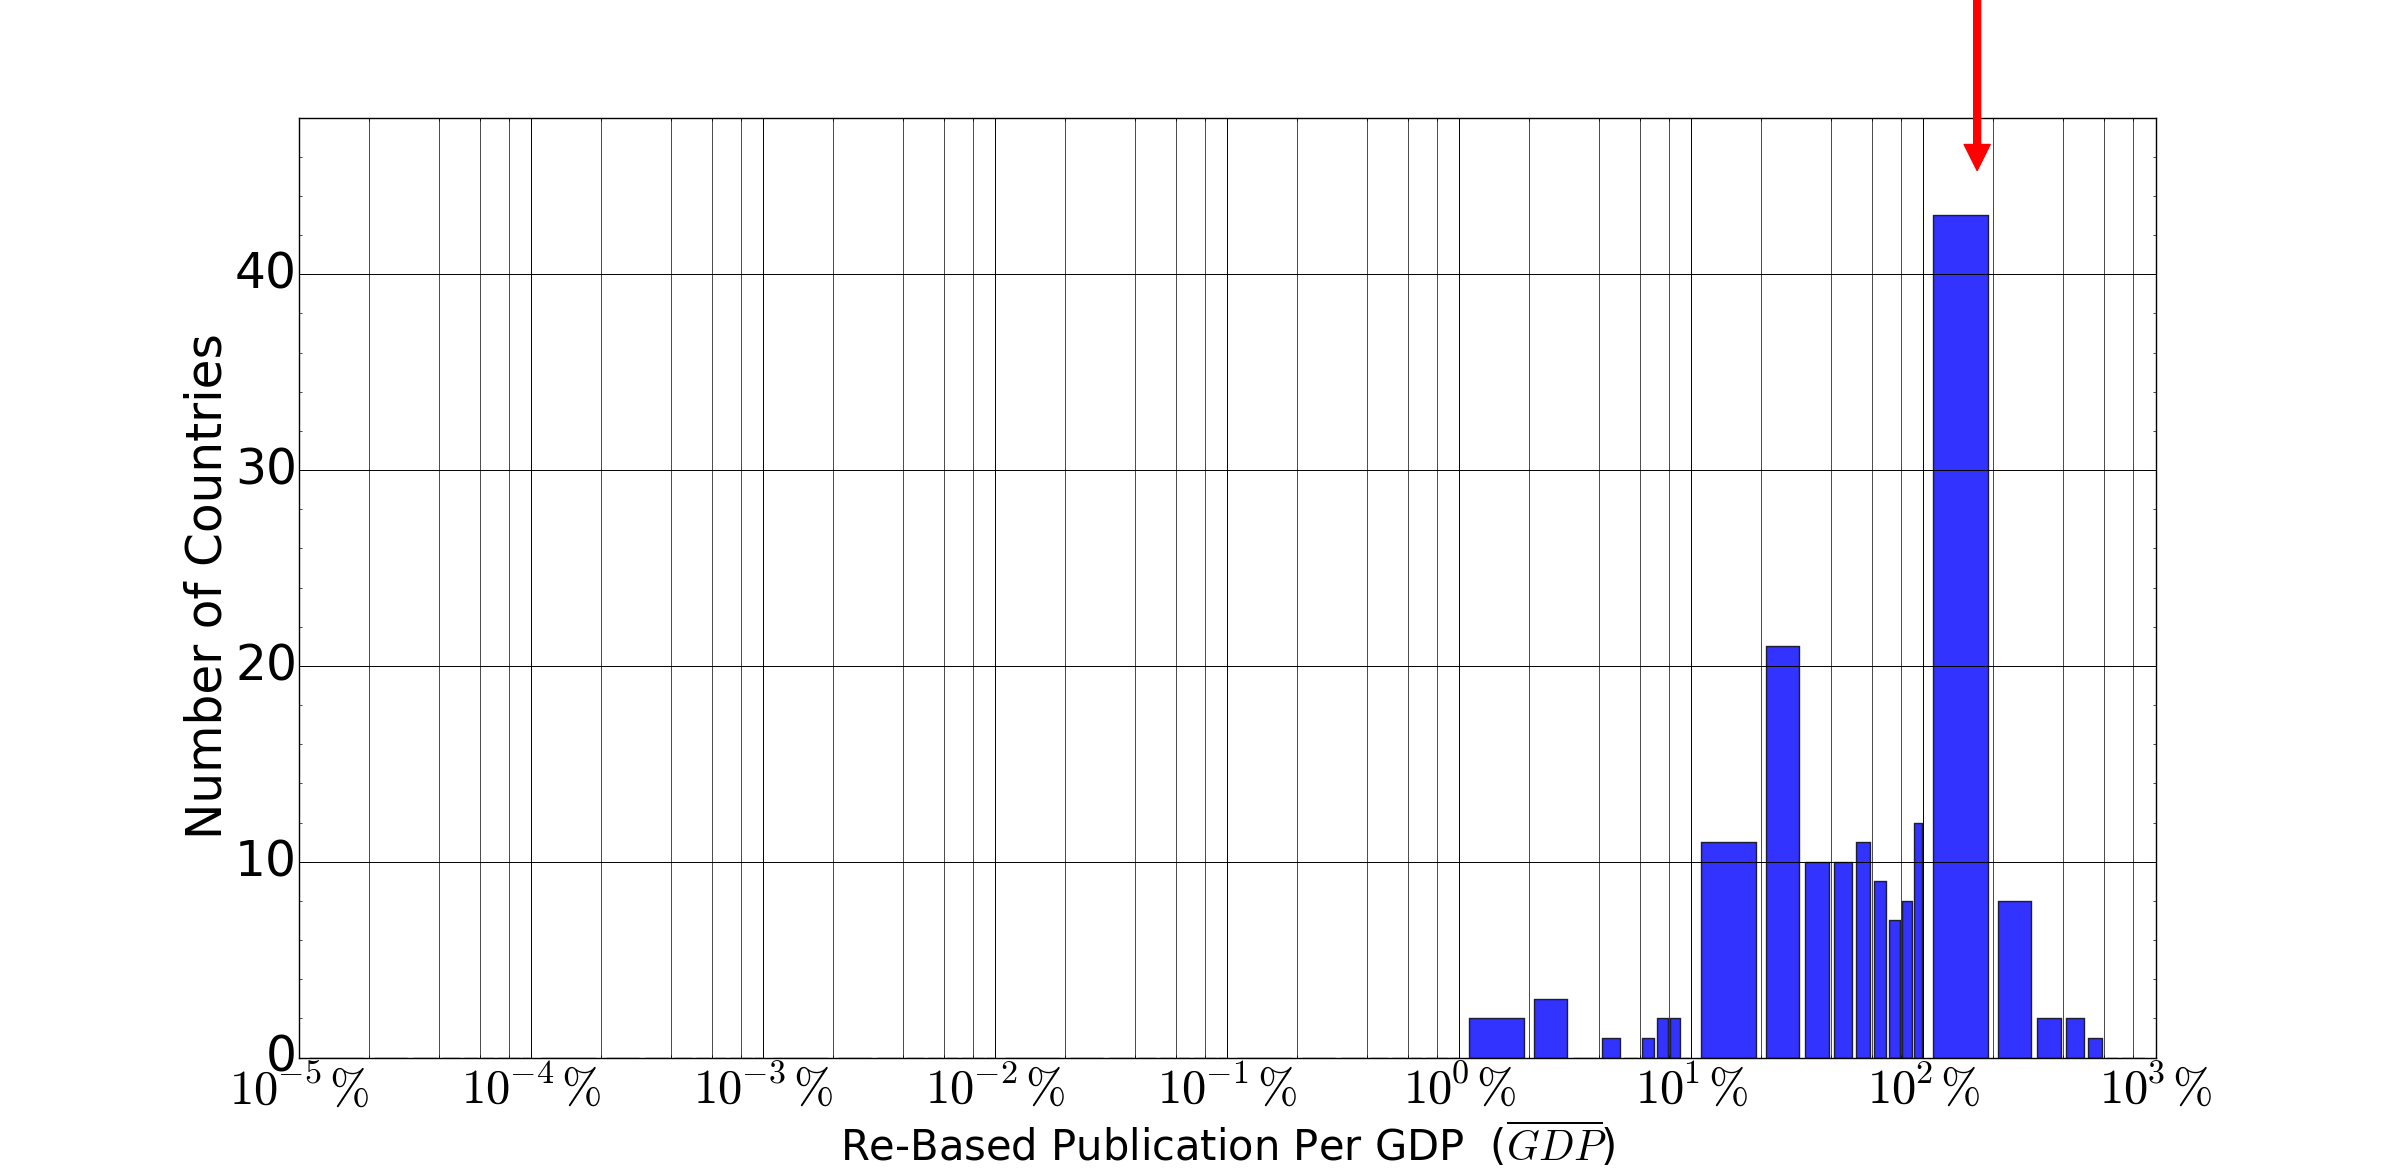
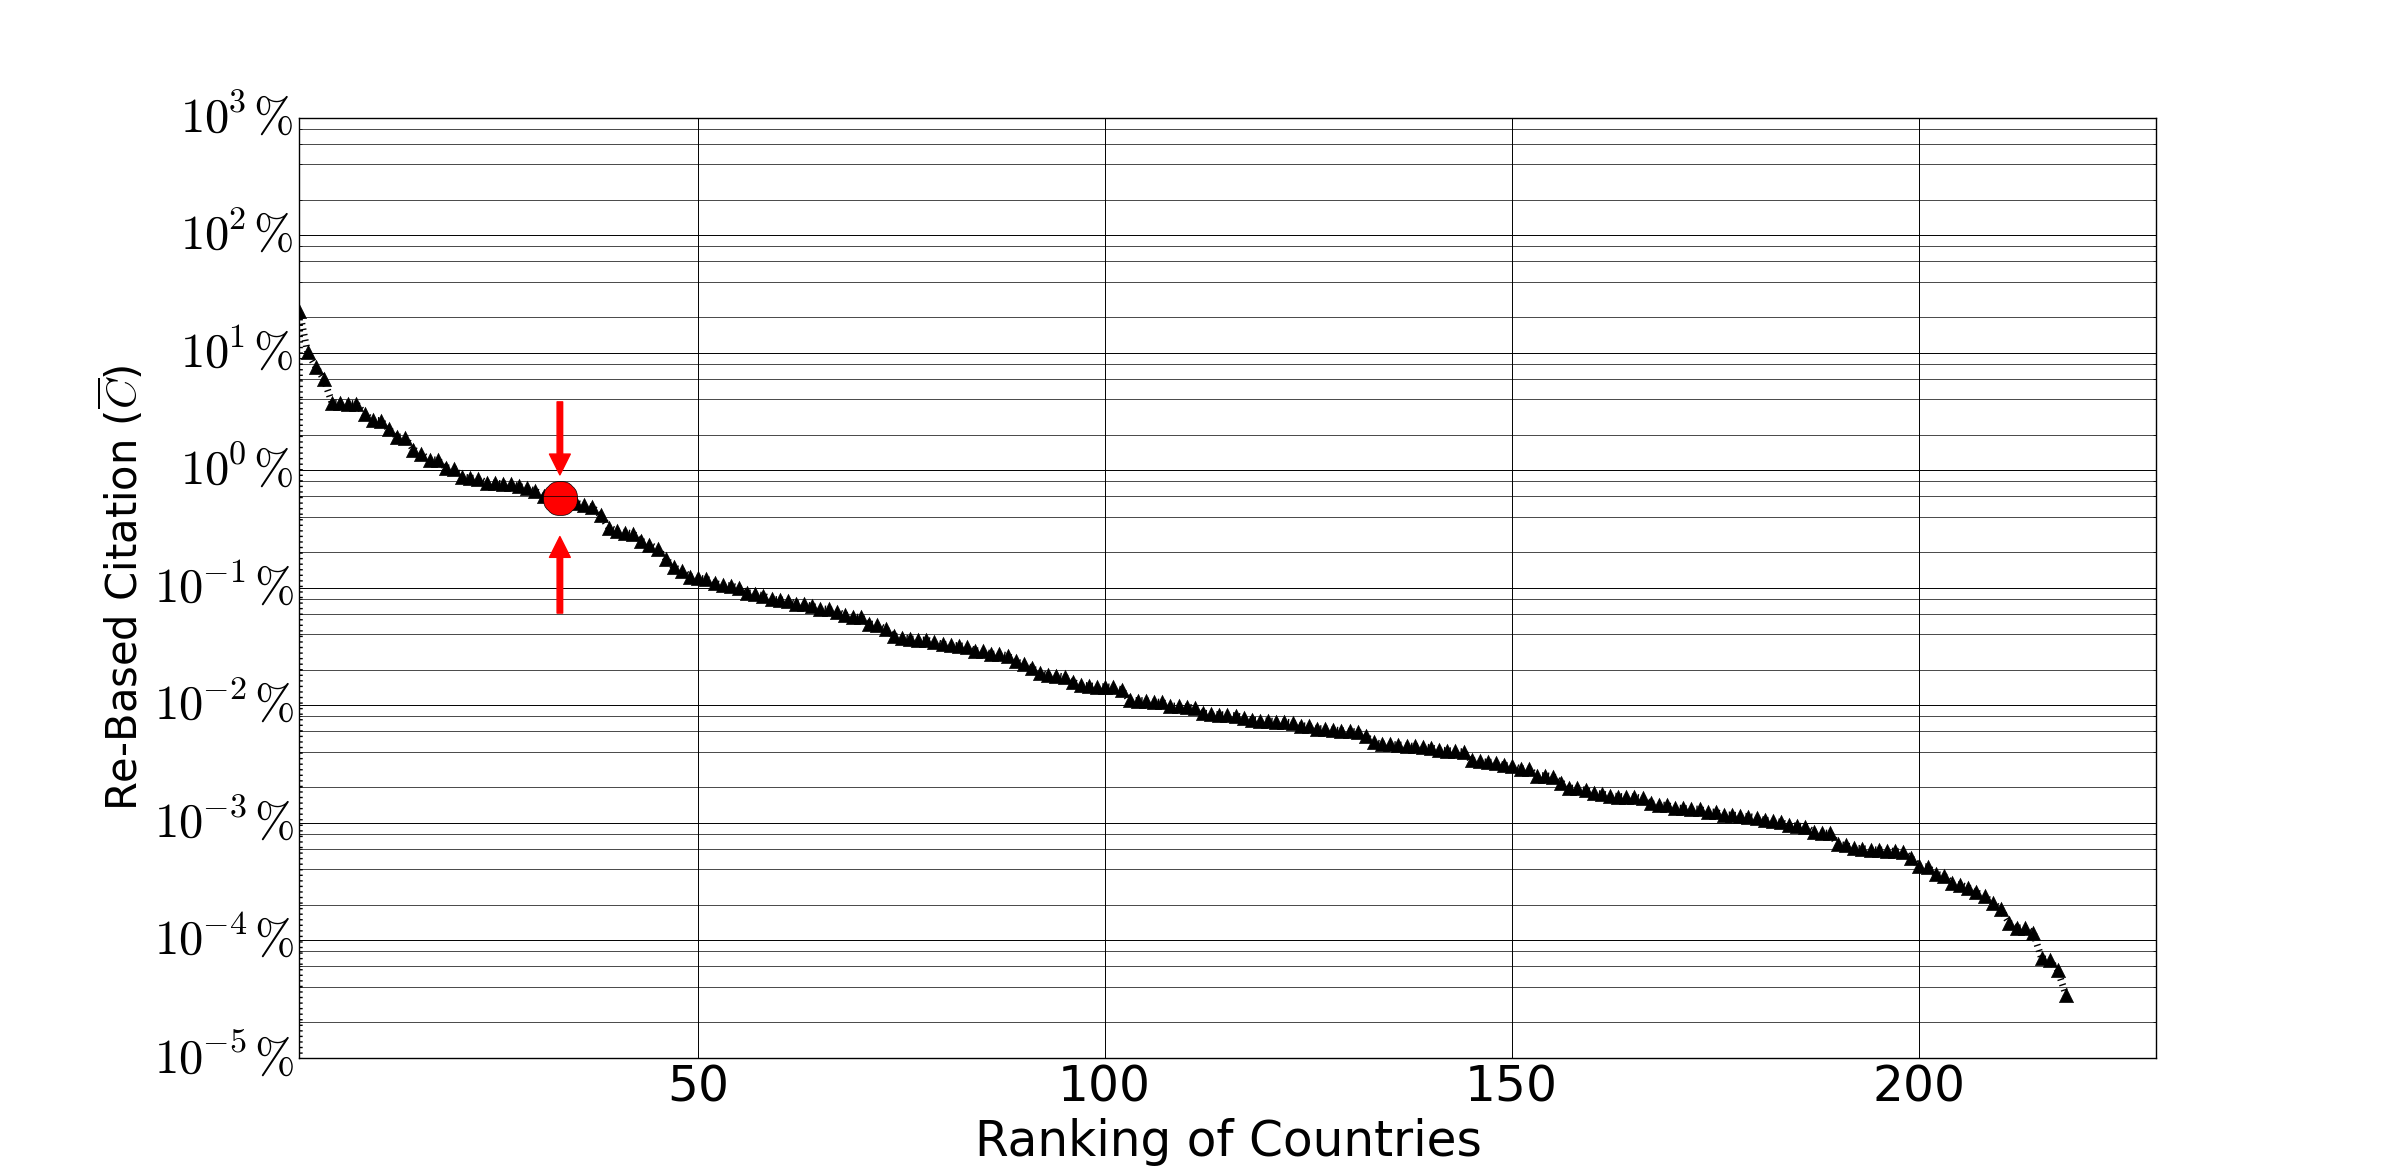
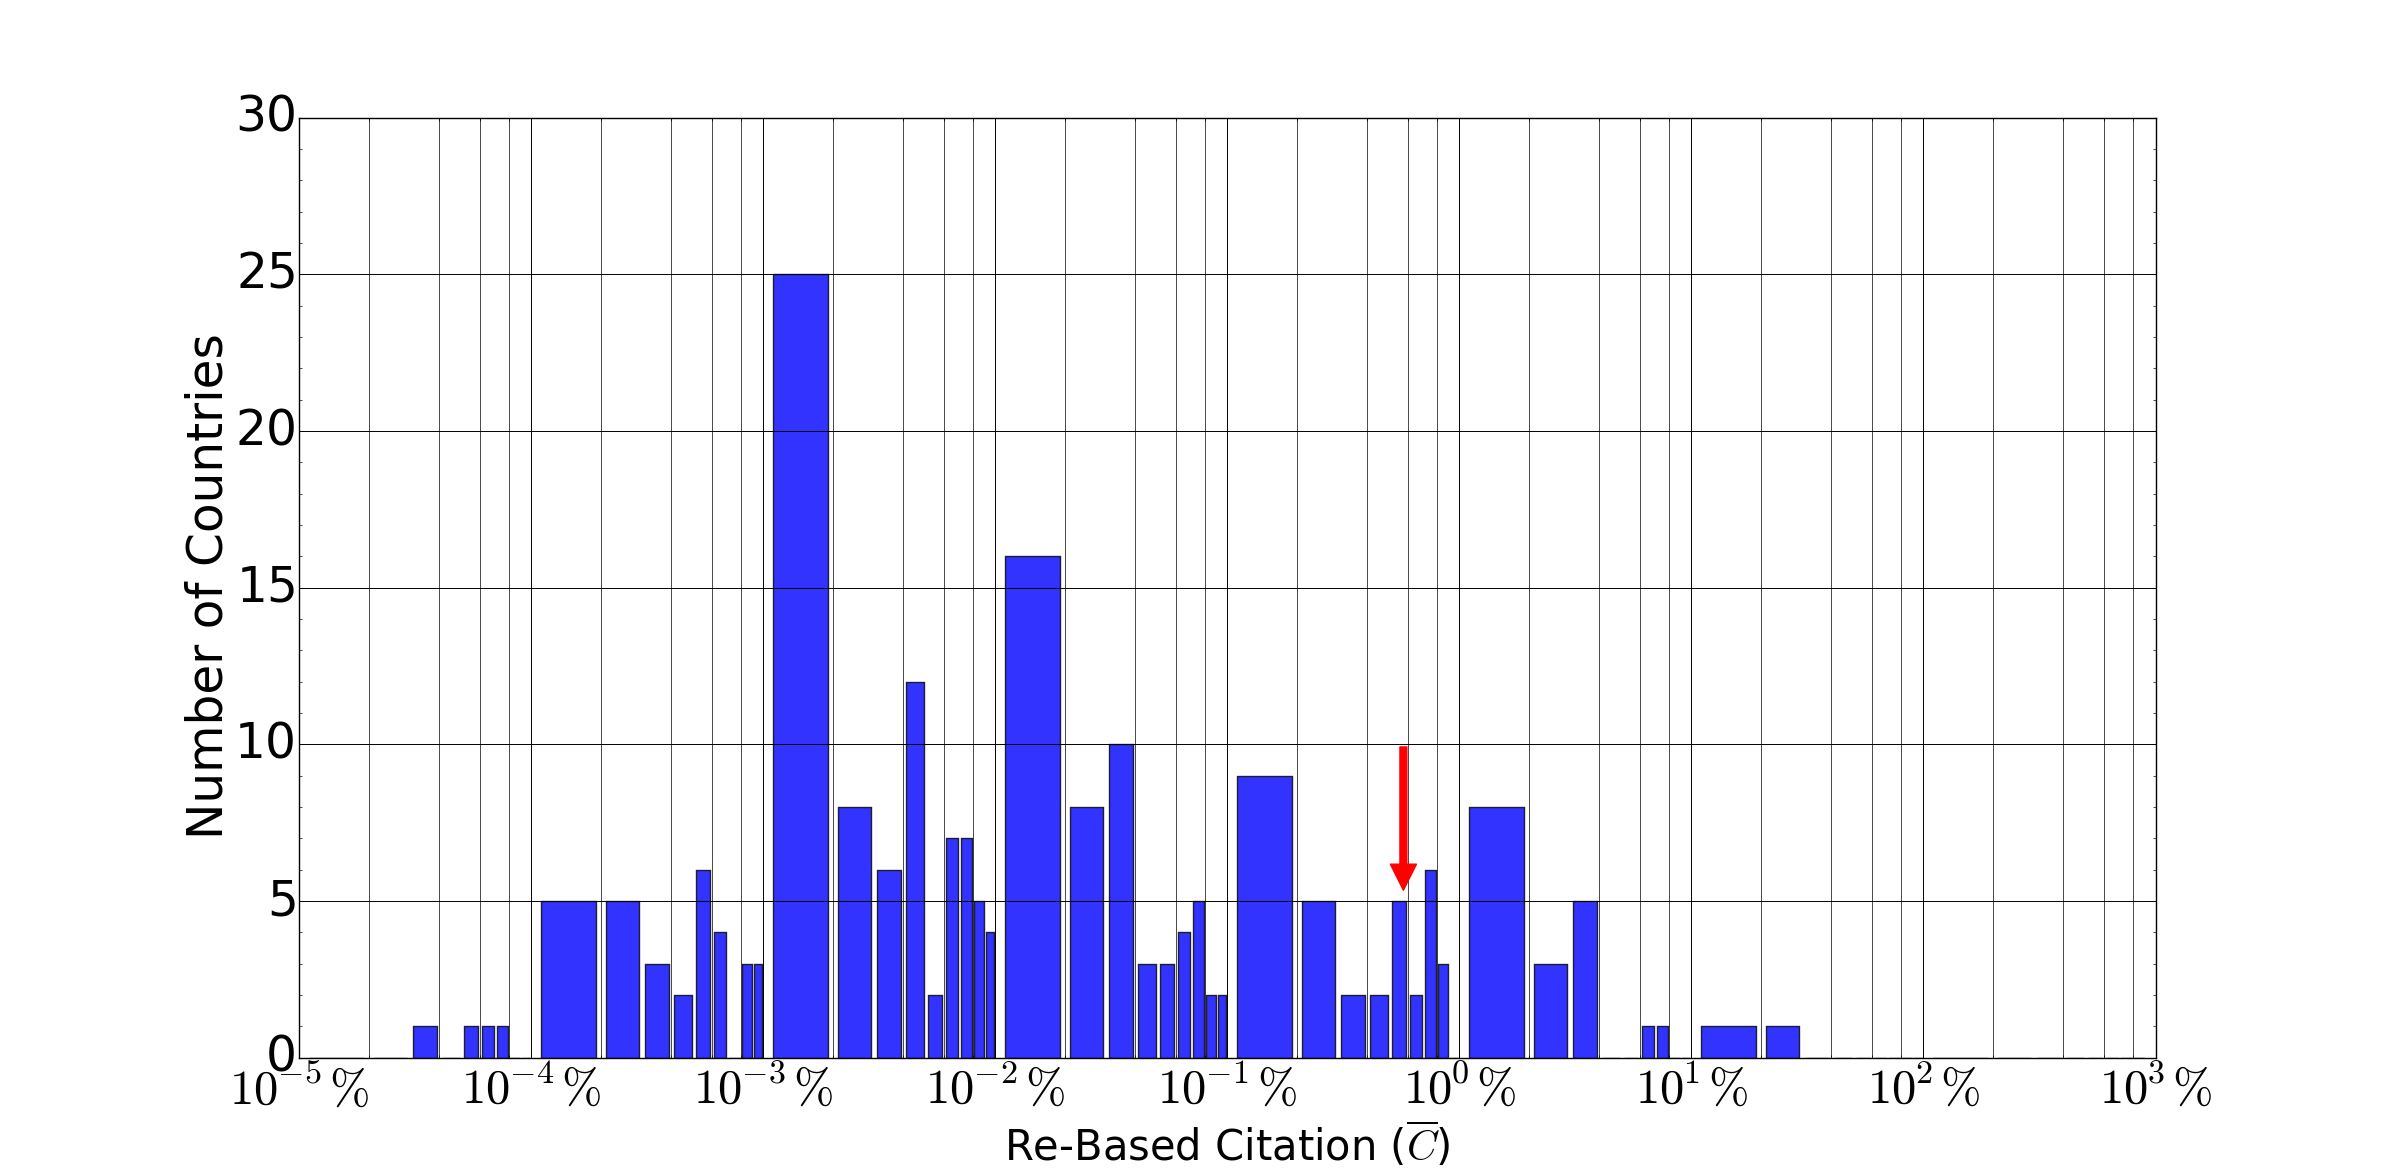
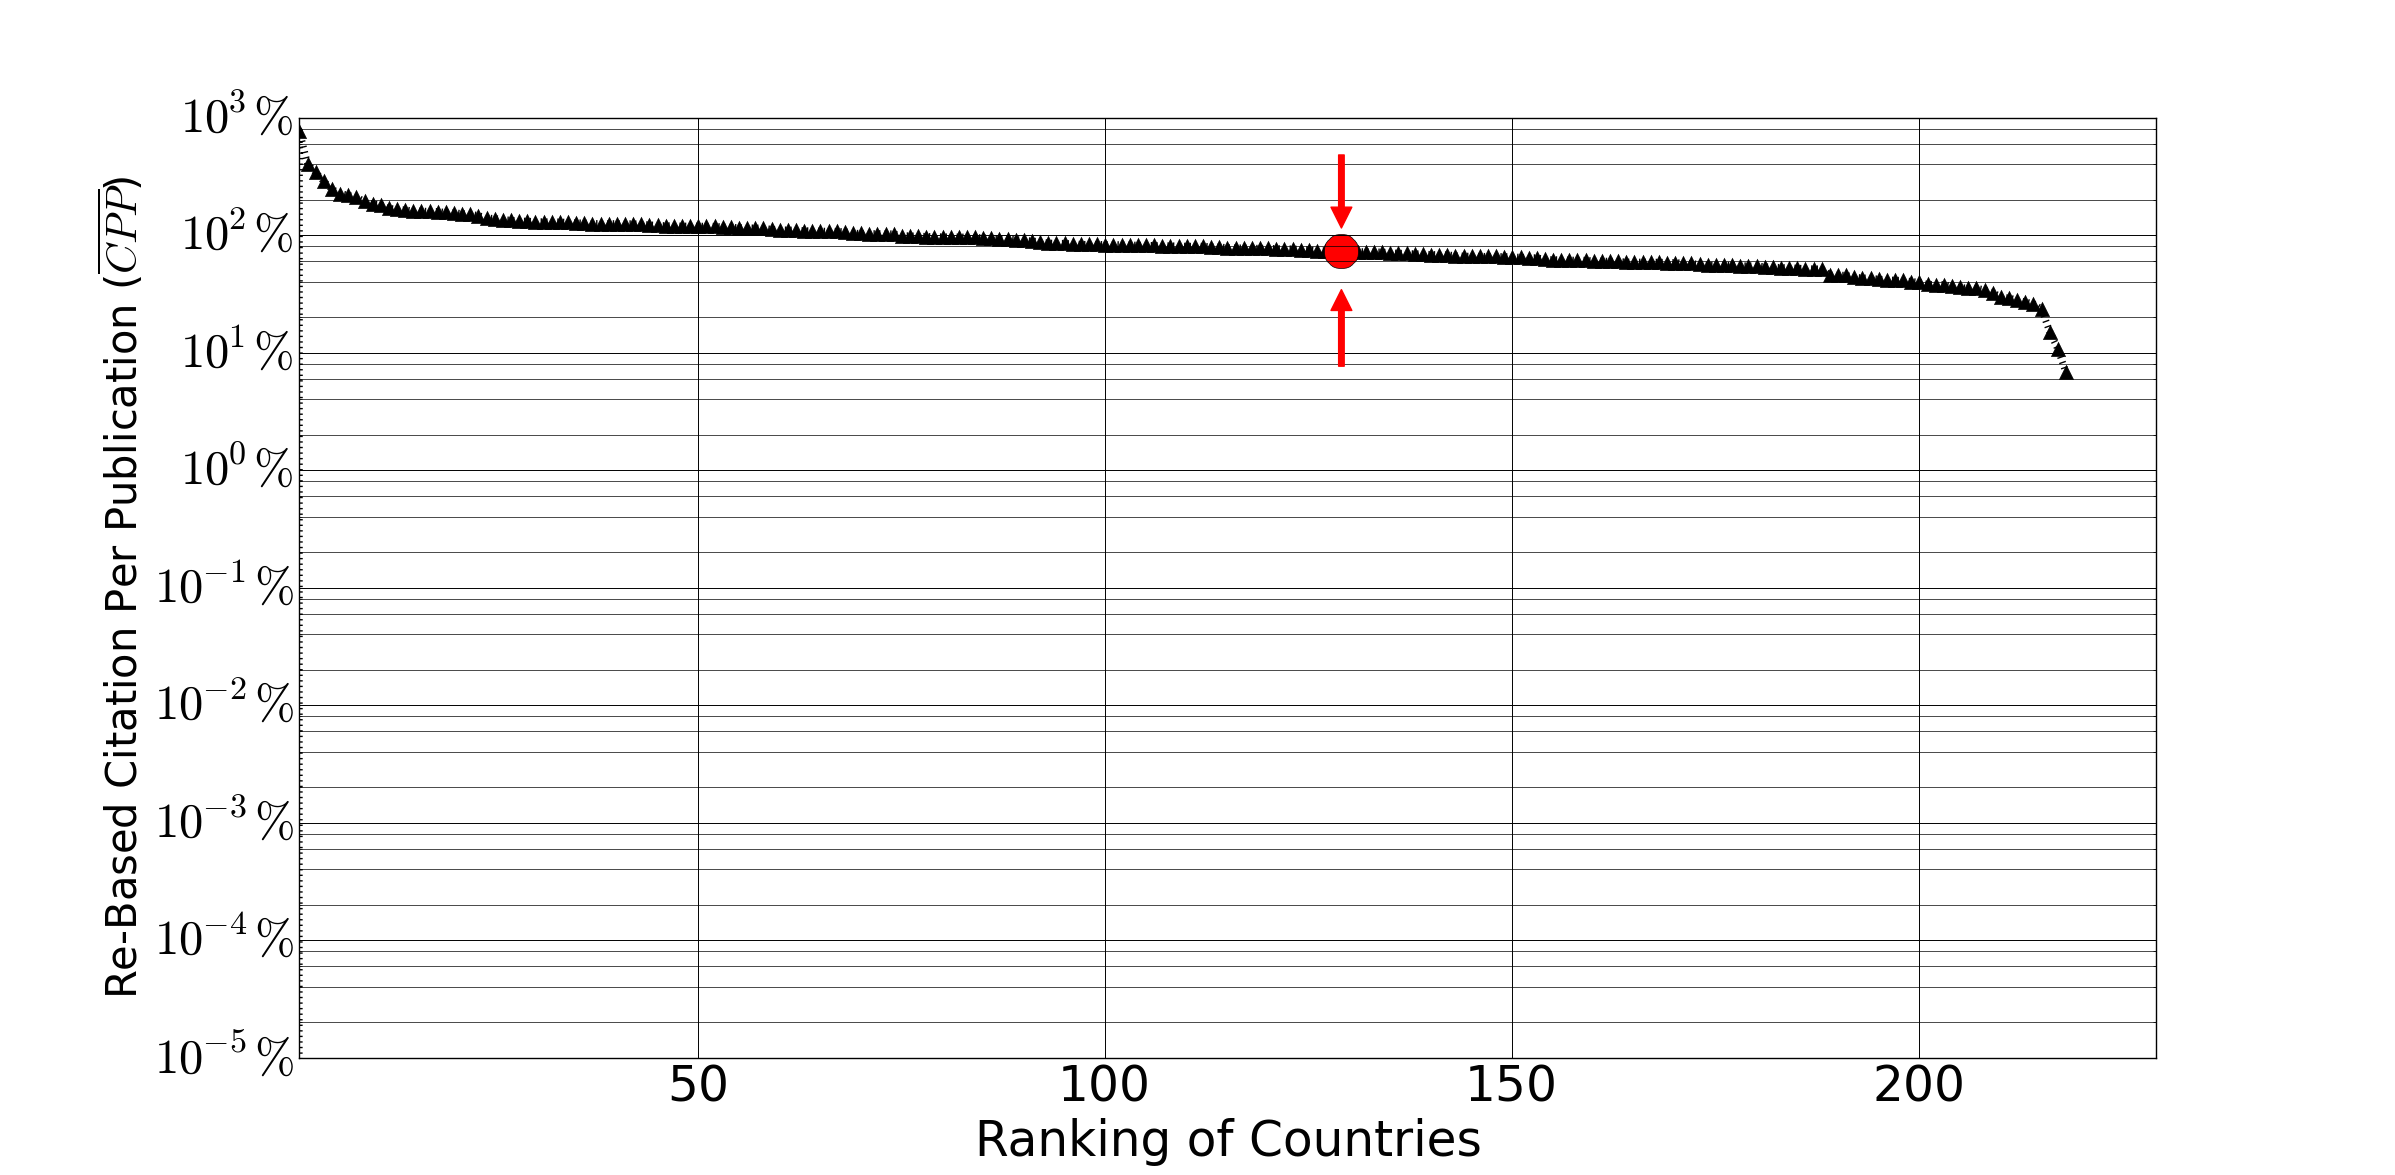
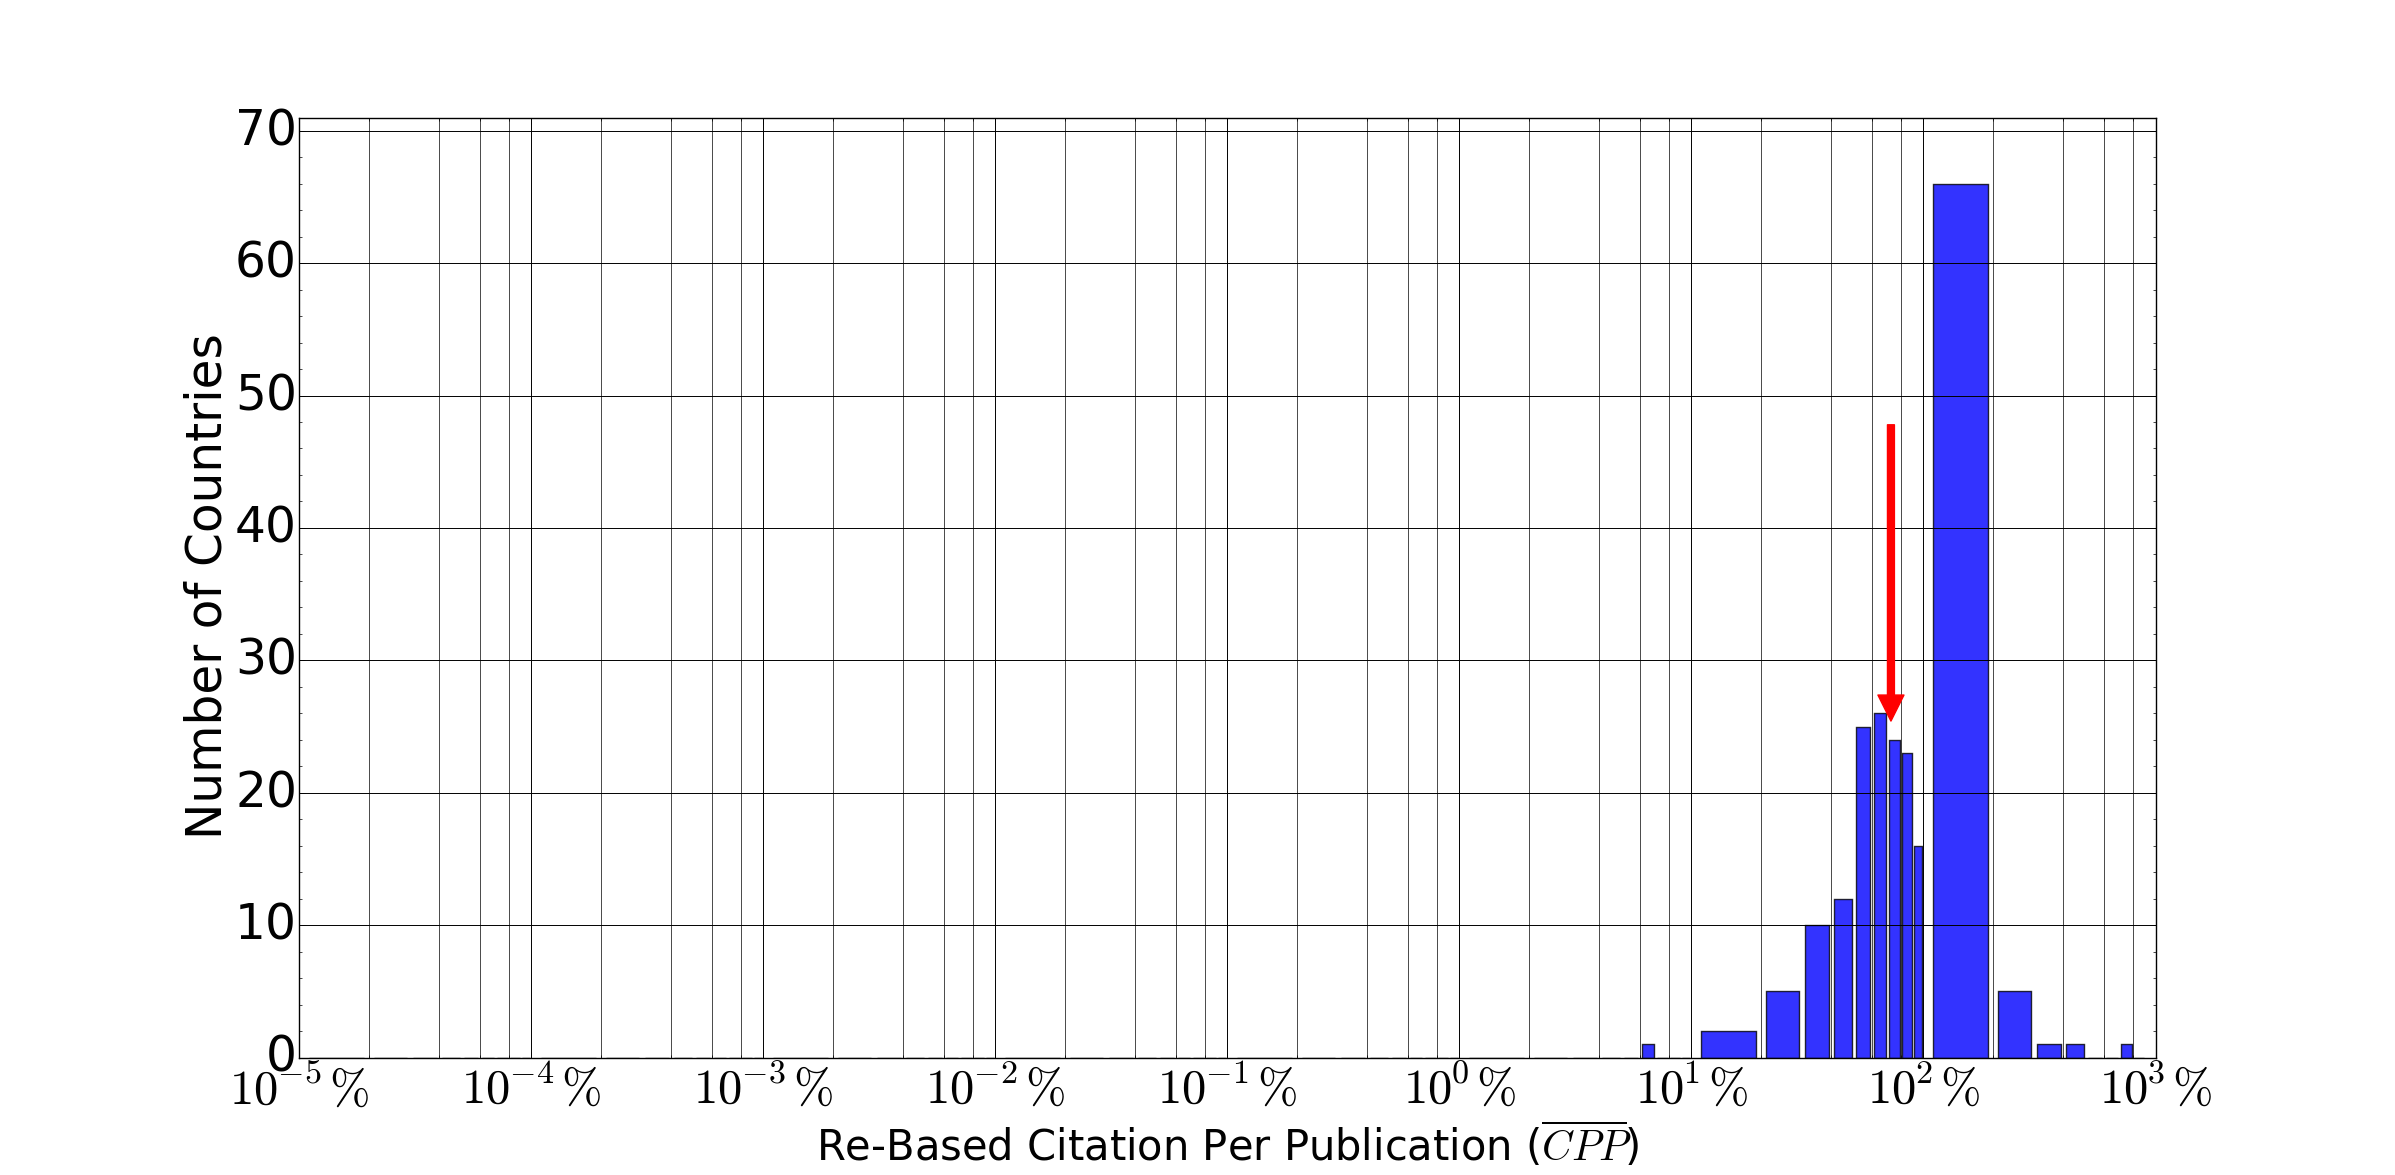
Fig. 6 shows ranking of South Africa among the countries of the world in all the five indicators studied here. Furthermore, the distribution of the number of countries over the value of each indicator is displayed on the right column. Table 1 presents South Africa’s rank in global context which is given for each of the indicators in two different years, i.e. starting and ending years of the studied period.
One can infer from the rankings change and the shape of the distribution function that the wider the distribution, the harder it is to change the ranking for countries. For instance, the width of the distribution of and are and respectively. The shift in South Africa’s ranking in these two indicators are and respectively. The drop in the rank of South Africa in the latter should not be interpreted as a huge failure since the distribution of this indicator is so tight, and a change of rank is much easier to happen. In other words, the ranking should be cautiously interpreted by carefully examining the shape of the distribution of that indicator (more specifically on the width of the distribution).
| South Africa’s rank | ||||
|---|---|---|---|---|
| Name of the indicator | Concept | year 1996 | year 2014 | width of distribution function |
| Re-Based Publication () | Quantity | 29 | 30 | |
| Re-Based Publication Per Population () | Productivity | 53 | 82 | |
| Re-Based Publication Per GDP () | Productivity | 54 | 35 | |
| Re-Based Citation () | Impact | 28 | 30 | |
| Re-Based Citation Per Publication () | Quality | 99 | 154 | |
IV Concluding notes
This study is motivated by the sharp increase in the demand for national level scientometrics, mostly originated from the global shift toward knowledge-based system of economy which emphasizes on science, research and innovation as a driving force. Scientific performance and its four major aspects are focused upon. The ranking and the temporal evolution of South Africa in all the four aspects have been presented.
In conclusion, South Africa has been successful enough to either steady increase or hold its position in the scientific world. However, there are other developing countries, such as China, Turkey, Malaysia and Iran, which enjoyed much higher achievement than South African . South Africa’s transition into a knowledge-based economy is far from being over and other developing countries are going through the same transition, some of them more successful than South Africa.
Acknowledgements.
This work is based upon research supported by the National Research Foundation and Department of Science and Technology. Any opinion, findings and conclusions or recommendations expressed in this material are those of the authors and therefore the NRF and DST do not accept any liability in regard thereto.References
- (1) General distribution OGP. The Knowledge-based Economy. 1996;.
- (2) Griliches Z. Introduction to” R&D and Productivity: The Econometric Evidence”. In: R&D and productivity: The econometric evidence. University of Chicago Press; 1998. p. 1–14.
- (3) Press WH. What’s so special about science (and how much should we spend on it?). Science. 2013;342(6160):817–822.
- (4) of the Cultural Revolution SC. National road-map of science. 2010;.
- (5) Swilling M. Rethinking the science-policy interface in South Africa: experiments in knowledge co-production. South African Journal of Science. 2014;110(5-6):01–07.
- (6) Nye MJ. Scientific decline: Is quantitative evaluation enough? Isis. 1984;75(4):697–708.
- (7) May RM. The scientific wealth of nations. Science. 1997;275(5301):793–796.
- (8) King DA. The scientific impact of nations. Nature. 2004;430(6997):311–316.
- (9) Sørensen MP, Wiborg Schneider J. Studies of national research performance: A case of ‘methodological nationalism’and ‘zombie science’? Science and Public Policy. 2016;44(1):132–145.
- (10) Hagen NT. Contributory inequality alters assessment of academic output gap between comparable countries. Journal of Informetrics. 2015;9(3):629–641.
- (11) Glänzel W, Schubert A. Double effort= double impact? A critical view at international co-authorship in chemistry. Scientometrics. 2001;50(2):199–214.
- (12) Persson O, Glänzel W, Danell R. Inflationary bibliometric values: The role of scientific collaboration and the need for relative indicators in evaluative studies. Scientometrics. 2004;60(3):421–432.
- (13) Van Noorden R. Scientists join journal editors to fight impact-factor abuse. Nature News Blog. 2013;498:7453.
- (14) Bollen J, Van de Sompel H, Hagberg A, Chute R. A principal component analysis of 39 scientific impact measures. PloS one. 2009;4(6):e6022.
- (15) Zahedi Z, Costas R, Wouters P. How well developed are altmetrics? A cross-disciplinary analysis of the presence of ‘alternative metrics’ in scientific publications. Scientometrics. 2014;101(2):1491–1513.
- (16) Gingras Y. Criteria for evaluating indicators. Beyond Bibliometrics: harnessing multidimensional indicators of scholarly impact. 2014;p. 109–125.
- (17) Lazarsfeld PF. Evidence and inference in social research. Daedalus. 1958;87(4):99–130.
- (18) Gevers M. Scientific performance indicators: A critical appraisal and a country-by-country analysis. Bibliometrics: Use and abuse in the review of research performance. 2014;37.
- (19) Schubert A, Braun T. Relative indicators and relational charts for comparative assessment of publication output and citation impact. Scientometrics. 1986;9(5-6):281–291.
- (20) Adams J. Collaborations: The fourth age of research. Nature. 2013;497(7451):557–560.
- (21) Hossain MS. Panel estimation for CO 2 emissions, energy consumption, economic growth, trade openness and urbanization of newly industrialized countries. Energy Policy. 2011;39(11):6991–6999.
- (22) Schubert A, Braun T. Cross-field normalization of scientometric indicators. Scientometrics. 1996;36(3):311–324.
- (23) Garfield E, Merton RK. Citation indexing: Its theory and application in science, technology, and humanities. vol. 8. Wiley New York; 1979.
- (24) Gläser J, Laudel G. The social construction of bibliometric evaluations. The changing governance of the sciences. 2007;p. 101–123.
- (25) Moed HF. Citation analysis in research evaluation. vol. 9. Springer Science & Business Media; 2006.
- (26) MacRoberts MH, MacRoberts BR. Problems of citation analysis: A critical review. Journal of the American Society for information Science. 1989;40(5):342.
- (27) Nicolaisen J. Citation analysis. Annual review of information science and technology. 2007;41(1):609–641.
- (28) MacRoberts MH, MacRoberts BR. Problems of citation analysis: A study of uncited and seldom-cited influences. Journal of the Association for Information Science and Technology. 2010;61(1):1–12.
- (29) Priem J, Groth P, Taraborelli D. The altmetrics collection. PloS one. 2012;7(11):e48753.
- (30) Mohammadi E, Thelwall M. Mendeley readership altmetrics for the social sciences and humanities: Research evaluation and knowledge flows. Journal of the Association for Information Science and Technology. 2014;65(8):1627–1638.
- (31) Kurtz MJ, Bollen J. Usage bibliometrics. Annual review of information science and technology. 2010;44(1):1–64.
- (32) Pouris A. Science in South Africa: The dawn of a renaissance? South African Journal of Science. 2012;108(7-8):83–89.
- (33) Kahn M. A bibliometric analysis of South Africa’s scientific outputs: some trends and implications. South African Journal of Science. 2011;107(1-2):1–6.
- (34) Sooryamoorthy R. Publication productivity and collaboration of researchers in South Africa: New empirical evidence. Scientometrics. 2014;98(1):531–545.
- (35) Mouton J. Patterns of research collaboration in academic science in South Africa. 2000;.
- (36) Sooryamoorthy R, Shrum W. Does the internet promote collaboration and productivity? Evidence from the scientific community in South Africa. Journal of Computer-Mediated Communication. 2007;12(2):733–751.
- (37) Sooryamoorthy R. Transforming science in South Africa: Development, collaboration and productivity. Springer; 2015.