A multiline study of a high-mass young stellar object in the Small Magellanic Cloud with ALMA: The detection of methanol gas at 0.2 solar metallicity
Abstract
We report the results of subparsec-scale submillimeter observations towards an embedded high-mass young stellar object in the Small Magellanic Cloud (SMC) with ALMA. Complementary infrared data obtained with the AKARI satellite and the Gemini South telescope are also presented. The target infrared point source is spatially resolved into two dense molecular cloud cores; one is associated with a high-mass young stellar object (YSO core), while another is not associated with an infrared source (East core). The two cores are dynamically associated but show different chemical characteristics. Emission lines of CS, C33S, H2CS, SO, SO2, CH3OH, H13CO+, H13CN, SiO, and dust continuum are detected from the observed region. Tentative detection of HDS is also reported. The first detection of CH3OH in the SMC has a strong impact on our understanding of the formation of complex organic molecules in metal-poor environments. The gas temperature is estimated to be 10 K based on the rotation analysis of CH3OH lines. The fractional abundance of CH3OH gas in the East core is estimated to be (0.5–1.5) 10-8, which is comparable with or marginally higher than those of similar cold sources in our Galaxy despite a factor of five lower metallicity in the SMC. This work provides observational evidence that an organic molecule like CH3OH, which is largely formed on grain surfaces, can be produced even in a significantly lower metallicity environment compared to the solar neighborhood. A possible origin of cold CH3OH gas in the observed dense core is discussed.
1 Introduction
Interstellar chemistry at low metallicity is crucial to understand chemical processes in past galaxies since cosmic metallicity is increasing in time with the evolution of our universe. Observational studies of dense molecular gas in nearby low-metallicity galaxies play an important role in understanding chemistry in star-forming regions as a function of galactic metallicity. Chemical compositions of molecular cloud cores and protostellar envelopes are particularly interesting for understanding initial chemical conditions of star-formation in metal-poor environments.
Characteristic chemical compositions around high-mass young stellar objects (YSOs) in low metallicity environments are emerging thanks to recent advances in infrared and radio observations towards compact sources in the Large Magellanic Cloud. The abundance of organic molecules such as CH3OH is one of the key issues in recent astrochemical studies toward low metallicity systems. Infrared observations of ices suggest that solid CH3OH around embedded high-mass YSOs in the LMC is less abundant than those of Galactic similar objects (Shimonishi et al., 2016a). In single-dish radio observations, CH3OH lines are detected from two LMC star-forming regions (Heikkilä et al., 1999; Wang et al., 2009). Spectral line surveys and abundance analyses towards seven molecular clouds in the LMC suggest that CH3OH gas is less abundant in the LMC (Nishimura et al., 2016a). Searches for maser emission in star-forming regions reported the lower detection rate of of CH3OH masers in the LMC compared to those in our Galaxy (e.g., Green et al., 2008; Ellingsen et al., 2010). Submillimeter observations with the Atacama Large Millimeter/submillimeter Array (ALMA) reported that gas-phase CH3OH towards a hot molecular core in the LMC is underabundant by 1–3 orders of magnitude compared to those towards Galactic hot cores (Shimonishi et al., 2016b). On the other hand, Sewiło et al. (2018) recently detected CH3OH and other complex organic molecules toward two different hot molecular cores in the LMC. They argue that the abundances of these molecules are scaled by the metallicity of the LMC and comparable to those found at the lower end of the range in Galactic hot cores. Chemical processes of organic molecules in low metallicity environments are still an open question and observational tests for further metal-poor samples are essentially important.
The Small Magellanic Cloud (SMC), the prime target of this paper, is one of the nearest star-forming galaxies to our Galaxy (62.1 2.0 kpc, Graczyk et al., 2014). It is well known that the SMC has a low-metallicity environment, which is about one-fifth of the solar neighborhood (e.g., Dufour, 1984; Russell & Dopita, 1992; Venn, 1999). Relative abundances among heavy elements are also different in the SMC, e.g., the ratio of elemental nitrogen relative to carbon or oxygen is lower in the SMC by a factor of 3 (Russell & Dopita, 1992). A dust-to-gas ratio is also reported to be lower in the SMC than in our Galaxy by a factor of 5 or more (e.g., Leroy et al., 2007; Roman-Duval et al., 2017). A lower abundance of dust grains leads to harsh radiation environment, which results in elevated dust/gas temperatures and more effective photoprocessing of dense interstellar medium (e.g., Aguirre et al., 2003; van Loon et al., 2010). The above environmental differences would affect chemical compositions in molecular clouds in the SMC as in the case of the LMC.
Pioneering works on molecular gas multiline studies for the SMC are presented in Chin et al. (1997, 1998) and Heikkilä et al. (1999) based on observations with the 15-m Swedish-ESO Submillimetre Telescope. These studies reported detection of various molecular species, including CO, CS, SO, C2H, HCO+, HCN, HNC, H2CO, and C3H2 towards active star-forming regions N27 and LIRS 36. Recently, Muraoka et al. (2017) reported high-spatial resolution observations of CO, 13CO, C18O, and CS with ALMA towards a star-forming region, N83C. They revealed subparsec-scale structures and physical properties of molecular clouds in the SMC. High spatial resolution molecular line observations towards the SMC are, however, still limited to a few molecular species, and the chemistry of star-forming cores in the SMC remains to be investigated.
Infrared observations of ices toward embedded high-mass YSOs in the SMC are also reported in the literature (van Loon et al., 2008; Oliveira et al., 2011, 2013). Currently, H2O and CO2 ices are detected in the SMC, while CO ice is not detected. Astrochemical simulations dedicated to the SMC environment suggest that the observed absence of CO ice in the SMC is explained by a combined effect of increased dust temperatures and reduced metal abundances (Acharyya & Herbst, 2016; Pauly & Garrod, 2018).
In this paper, we report the results of subparsec-resolution submillimeter observations towards a high-mass YSO in the SMC with ALMA. Section 2 describes the details of observations and data reduction. The obtained spectra and images are presented in Section 3. Analysis of the spectral data and the derivation of the physical quantities of molecular gas are also described in this section. Section 4 describes physical and chemical properties of the observed source. A particular focus is given to the properties of CH3OH gas in the metal-poor environment of the SMC. The conclusions of this paper are presented in Section 5.
2 Observations and data reduction
2.1 Target
The target is the infrared source IRAS 01042-7215 located in the SMC. It is spectroscopically identified to be an embedded high-mass YSO in previous infrared studies (van Loon et al., 2008; Oliveira et al., 2011, 2013; Shimonishi, 2012; Ruffle et al., 2015). The luminosity of the source is estimated to be 2 104 L☉. More detailed discussion about the YSO’s properties is given in Section 4.
2.2 Observations
Observations were carried out with ALMA in November 2016 as a part of the Cycle 4 program 2016.1.00394.S (PI T. Shimonishi). The telescopes were pointed to RA = 01h05m4932 and Dec = -71∘59484 (J2000), which corresponds to the target’s infrared peak position. The target was observed in Band 6 with four spectral windows covering 241.48–243.36, 243.84-245.71, 256.99–258.87, and 258.85–260.72 GHz in the rest-frame frequency. The frequency resolution is 977 kHz before channel averaging. The total on-source integration time is 39 minutes. We use J2357-5311, J2056-4714, and J0102-7546 as a flux, bandpass, and gain calibrator, respectively. In total 43 antennas are used for the observations with the minimum and maximum baseline length of 19 m and 1.1 km.
2.3 Data reduction
Raw interferometric data are processed using the Common Astronomy Software Applications (CASA) package. The calibration is done with CASA 4.7.0 and the imaging is with CASA 4.7.2. The synthesized beam size is 0.35–0.37 0.22–0.23 with a position angle of -25 degree, which corresponds to 0.11 pc 0.07 pc at the distance of the SMC (62.1 kpc). The primary beam has a full-width at half-maximum (FWHM) of about 25, and the maximum recoverable angular scale is about 3. The primary beam correction is done by using the impbcor task in CASA.
The spectra and continuum flux are extracted from the 0.34 (0.10 pc) diameter region centered at the three positions (Position 1, 2, 3, hereafter P1, P2, P3), where the dust continuum and/or molecular emission lines have a local peak (see Section 3.2). Their coordinates are listed in Table 1. The continuum emission is subtracted from the spectral data using the uvcontsub task in CASA. The velocity resolution of the extracted spectra is 1.5 km s-1.
| Position | R.A. | Decl. | Detected molecules | Note |
|---|---|---|---|---|
| (J2000) | (J2000) | |||
| P1 | 01 05 49.33 | -71 59 48.46 | CS, SO, H13CO+ | Continuum, H13CO+, and infrared peak |
| P2 | 01 05 49.54 | -71 59 48.94 | CS, C33S, H2CS, SO, SO2, (HDS), | C33S, H2CS, and SiO peak |
| CH3OH, H13CN, H13CO+, SiO | ||||
| P3 | 01 05 49.50 | -71 59 49.41 | CS, SO, SO2, CH3OH, H13CO+ | CH3OH peak |
Note. — Tabulated positions are shown in Figure 4. HDS is a tentative detection.
2.4 Complementary infrared data
Complementary infrared datasets are also presented in this work. One contains high spatial resolution mid-infrared imaging data obtained with T-ReCS at the Gemini South telescope (Program ID: S10B-120, PI: T. Shimonishi). The observations were carried out using a broad-band filter in the N-band (7.70–12.97 m, centered at 10.36 m) as well as six narrow-band filters (centered at 7.73, 8.74, 9,69, 10.38, 11.66, and 12.33 m). The spatial resolution of the imaging data is about 0.55 according to the FWHM measurement for a photometric standard star.
Another complementary data set is a near-infrared 2–5 m spectrum obtained with the Infrared Camera (IRC) on board AKARI (Murakami et al., 2007; Onaka et al., 2007). The observations were carried out using the slitless NG spectroscopy mode with the Np point source aperture (R 80) as a part of the AKARI post-helium mission program (Program ID: LMCNG, PI: T. Onaka). The near-infrared spectrum is extracted from the infrared peak position. A typical FWHM of point sources in the AKARI data is approximately 5–8.
3 Results
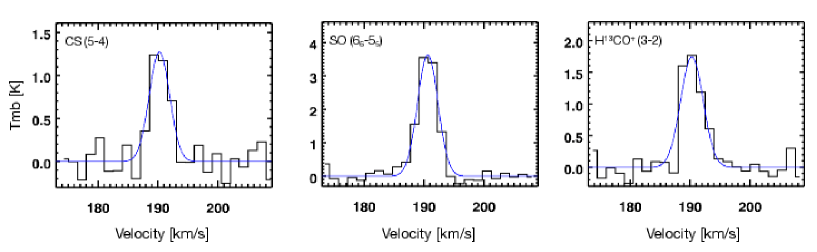
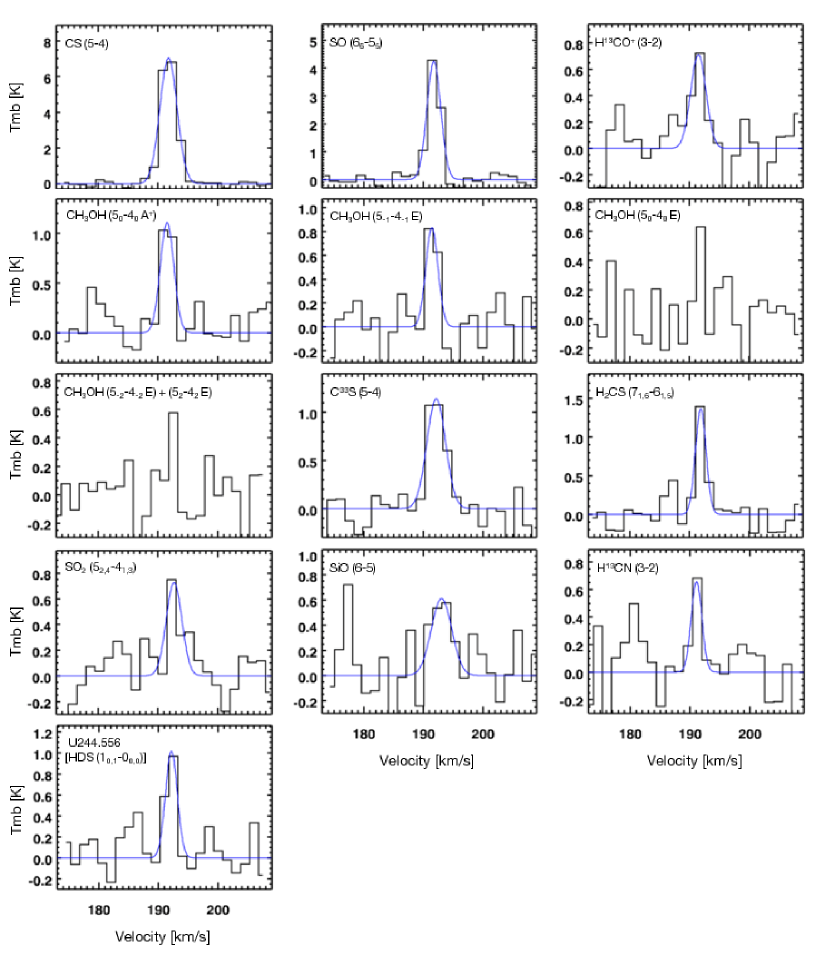
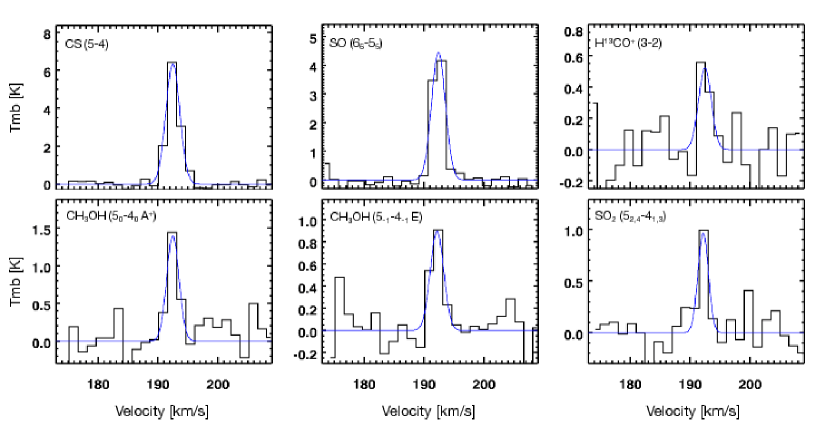
3.1 Spectra
Figures 1–3 show spectra extracted from the three positions described in Section 2.3. Spectral lines are identified with the aid of the Cologne Database for Molecular Spectroscopy111https://www.astro.uni-koeln.de/cdms (CDMS, Müller et al., 2001, 2005). The detection criteria adopted here are the 3 significance level and the velocity coincidence with the systemic velocity of nearby clouds (between 186 km s-1 and 196 km s-1, Israel et al., 1993). Line parameters are measured by fitting a single Gaussian profile to observed lines. In some cases we subtract a local baseline which is estimated from adjacent line-free regions by fitting a polynomial to correct for small baseline ripples. Based on the fitting, we estimate a peak brightness temperature, an FWHM, an LSR velocity, and an integrated intensity for each line. For CH3OH(50–40 E) and (5±2–4±2 E) lines, the integrated intensities are calculated by directly integrating the spectrum between 190 km s-1 and 194 km s-1 because they are too narrow to fit a Gaussian. These two lines are attributed to tentative detections given their low intensity. The results of the spectral fits are shown in Figures 1–3, and the measured line parameters are summarized in Table 2. The table also contains the estimated upper limits on several important non-detection lines.
Molecular emission lines of CS, C33S, H2CS, SO, SO2, CH3OH, H13CO+, H13CN, and SiO are detected from the observed region. Among these species, CH3OH, SO2, H2CS, C33S, and H13CN are for the first time detected in the SMC. Measured line widths are typically 3–4 km s-1. The spectra at P1 show slightly broader line widths compared to those at P2 and P3. An unidentified line is also detected near 244.5556 GHz (hereafter U244.556), which is tentatively attributed to HDS as further discussed in Section 4.4. High-excitation lines (upper-state energy 100 K) are covered in the present frequency settings but not detected. A carbon-chain-related molecule, c-C3H2, is not detected.
| Molecule | Transition | Frequency | RMS | Note | |||||
|---|---|---|---|---|---|---|---|---|---|
| (K) | (GHz) | (K) | (km s-1) | (K km s-1) | (km s-1) | (K) | |||
| Position 1 | |||||||||
| CS | 5–4 | 35 | 244.93556 | 1.27 0.11 | 4.0 | 5.45 1.11 | 190.2 | 0.19 | |
| SO | 66–55 | 57 | 258.25583 | 3.64 0.10 | 4.0 | 15.61 0.97 | 190.6 | 0.18 | |
| H13CO+ | 3–2 | 25 | 260.25533 | 1.75 0.10 | 4.4 | 8.24 1.13 | 190.3 | 0.19 | |
| CH3OH | 50–40 A+ | 35 | 241.79143 | 0.7 | 1.4 | 0.20 | |||
| SO2 | 52,4–41,3 | 24 | 241.61580 | 0.4 | 1.3 | 0.20 | |||
| C33S | 5–4 | 35 | 242.91361 | 0.4 | 1.3 | 0.20 | |||
| 33SO | 67–56 | 47 | 259.28403 | 0.4 | 1.2 | 0.19 | (1) | ||
| c-C3H2 | 32,1–21,2 | 18 | 244.22215 | 0.4 | 1.2 | 0.19 | |||
| Position 2 | |||||||||
| CS | 5–4 | 35 | 244.93556 | 7.05 0.12 | 3.4 | 25.46 0.91 | 191.7 | 0.19 | |
| SO | 66–55 | 57 | 258.25583 | 4.25 0.11 | 2.7 | 12.34 0.77 | 191.7 | 0.19 | |
| H13CO+ | 3–2 | 25 | 260.25533 | 0.71 0.12 | 3.0 | 2.30 0.96 | 191.5 | 0.21 | |
| CH3OH | 50–40 A+ | 35 | 241.79143 | 1.10 0.12 | 2.7 | 3.20 0.75 | 191.5 | 0.19 | |
| CH3OH | 5-1–4-1 E | 40 | 241.76722 | 0.83 0.11 | 2.4 | 2.15 0.62 | 191.4 | 0.19 | |
| CH3OH | 50–40 E | 48 | 241.70022 | 0.63 0.38 | 1.5 | 0.98 0.34 | 191.7 | 0.19 | (2) (3) |
| CH3OH | 51–41 A- | 50 | 243.91583 | 0.4 | 1.2 | 0.19 | |||
| CH3OH | 51–41 E | 56 | 241.87907 | 0.4 | 1.2 | 0.19 | |||
| CH3OH | 5±2–4±2 E | 61 | 241.90416 | 0.58 0.38 | 1.5 | 0.83 0.32 | 192.4 | 0.19 | (2) (3) (4) |
| CH3OH | 52–42 A+ | 73 | 241.88771 | 0.4 | 1.2 | 0.19 | |||
| SO2 | 52,4–41,3 | 24 | 241.61580 | 0.73 0.10 | 3.1 | 2.39 1.48 | 192.7 | 0.19 | |
| C33S | 5–4 | 35 | 242.91361 | 1.14 0.12 | 3.7 | 4.50 1.01 | 192.1 | 0.19 | |
| 33SO | 67–56 | 47 | 259.28403 | 0.4 | 1.3 | 0.21 | (1) | ||
| H2CS | 71,6–61,5 | 60 | 244.04851 | 1.37 0.11 | 2.1 | 3.05 0.64 | 191.9 | 0.19 | |
| SiO | 6–5 | 44 | 260.51800 | 0.61 0.12 | 4.0 | 2.63 1.12 | 193.0 | 0.21 | |
| H13CN | 3–2 | 25 | 259.01181 | 0.66 0.14 | 2.1 | 1.47 0.75 | 191.1 | 0.21 | |
| c-C3H2 | 32,1–21,2 | 18 | 244.22215 | 0.4 | 1.2 | 0.19 | |||
| U244.556 | 244.5556 | 1.02 0.11 | 2.3 | 2.55 0.68 | 192.0 | 0.19 | (5) (6) | ||
| Position 3 | |||||||||
| CS | 5–4 | 35 | 244.93556 | 6.33 0.12 | 2.8 | 18.64 0.83 | 192.5 | 0.18 | |
| SO | 66–55 | 57 | 258.25583 | 4.46 0.14 | 2.7 | 12.93 0.92 | 192.4 | 0.19 | |
| H13CO+ | 3–2 | 25 | 260.25533 | 0.52 0.11 | 2.5 | 1.39 0.63 | 192.4 | 0.19 | |
| CH3OH | 50–40 A+ | 35 | 241.79143 | 1.40 0.13 | 2.4 | 3.62 0.80 | 192.5 | 0.21 | |
| CH3OH | 5-1–4-1 E | 40 | 241.76722 | 0.90 0.13 | 2.6 | 2.52 0.82 | 192.1 | 0.21 | |
| CH3OH | 50–40 E | 48 | 241.70022 | 0.4 | 1.3 | 0.21 | |||
| CH3OH | 51–41 A- | 50 | 243.91583 | 0.4 | 1.2 | 0.18 | |||
| CH3OH | 51–41 E | 56 | 241.87907 | 0.4 | 1.3 | 0.21 | |||
| CH3OH | 5±2–4±2 E | 61 | 241.90416 | 0.4 | 1.3 | 0.21 | (4) | ||
| CH3OH | 52–42 A+ | 73 | 241.88771 | 0.4 | 1.3 | 0.21 | |||
| SO2 | 52,4–41,3 | 24 | 241.61580 | 0.97 0.12 | 2.0 | 2.10 0.72 | 192.2 | 0.21 | |
| C33S | 5–4 | 35 | 242.91361 | 0.4 | 1.3 | 0.21 | |||
| 33SO | 67–56 | 47 | 259.28403 | 0.4 | 1.2 | 0.19 | (1) | ||
| c-C3H2 | 32,1–21,2 | 18 | 244.22215 | 0.4 | 1.2 | 0.18 |
Note. — Uncertainties and upper limits are of the 2 level and do not include systematic errors due to baseline subtraction. Upper limits are estimated assuming = 3 km s-1. Notes: (1) Two hyperfine components (F = 15/2–13/2 and F = 17/2–15/2) are blended. (2) Tentative detection. (3) The integrated intensity is calculated by directly integrating the spectrum between 190 km s-1 and 194 km s-1. (4) Two CH3OH lines (5-2–4-2 E and 52–42 E) are blended. (5) Tentatively attributed to HDS () (see Section 4.4). (6) Assuming = 192.0 km s-1.
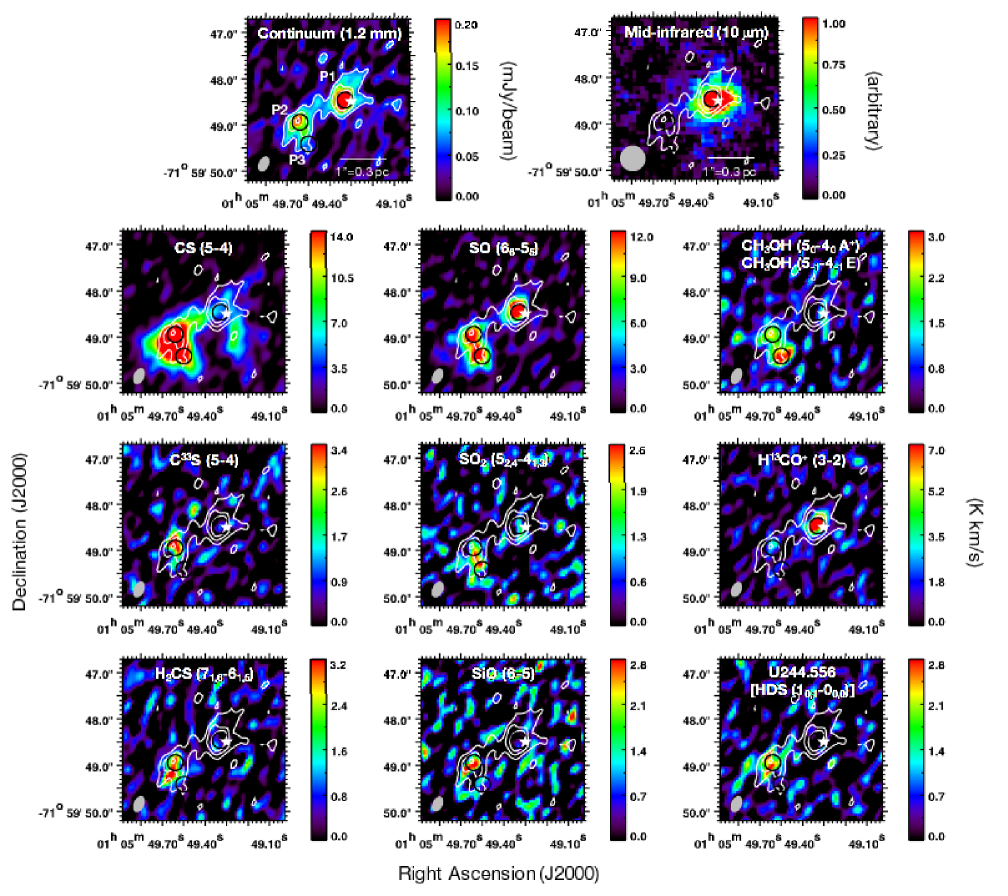
3.2 Synthesized images
Figure 4 shows synthesized images of continuum and molecular emission lines observed toward the target region. The images are constructed by integrating spectral data in the velocity range where the emission is seen. For CH3OH, two lines with similar spectroscopic parameters (50–40 A+ and 5-1–4-1 E) are added together to increase the signal-to-noise ratio (S/N). The H13CN map is not shown here because the line is too weak to derive the distribution. In addition to the submillimeter data, a high spatial resolution mid-infrared 10 m image obtained with Gemini/T-ReCS is shown in the figure.
The distribution of continuum emission shows two peaks; one is associated with an embedded high-mass YSO (P1), and another is located at the east side of the YSO (P2) separated by about 1 (0.3 pc). The latter is not seen in the mid-infrared image. The near-infrared image presented in Ward et al. (2017) shows compact emission centered around P1, which is similar to our mid-infrared image. Note that the criterion for the continuum detection is the 3 significance level, and the S/Ns at P1, P2, and P3 are 14, 8, and 3, respectively. It seems that the YSO’s position is slightly offset from the center of P1, but the separation is smaller than half of the beam size, and the positional accuracy of the infrared source is about 0.3, thus we regard that the YSO and P1 are spatially coincident within the accuracy of the present dataset. Hereafter, the molecular cloud core at the YSO’s position is referred to as the YSO core and the one on the east side as the East core. The size of the continuum emission region (FWHM of a two-dimensional Gaussian fit) is about 0.5–0.6 (0.15–0.18 pc) at both P1 and P2, which are slightly larger than the beam size. P3 is located almost at the edge of the continuum emitting region in the East core.
Molecular gas shows different distributions depending on species. SO is seen at all the positions (P1, P2, P3), while CS is concentrated in the East core (P2, P3) and the emission is weak at the YSO core. The distribution of CS is more extended compared with other lines and continuum, and the size of the emission region is about 0.8 (0.24 pc) centered near P2. The CS emission is relatively weak at P1 and a peculiar structure elongated in the north-south direction is seen at the right side of P1. In contrast to CS, H13CO+ is concentrated at the YSO core and the source size is comparable to the beam size. CH3OH is distributed at both P2 and P3, but the emission is slightly stronger at P3. The size of the CH3OH emission region around P3 is about 0.4 (0.12 pc), which is almost the same as the beam size. SO2 is seen at both P2 and P3 although the S/N is not very good. The distribution of H2CS seems to be slightly elongated toward the southeast direction from P2. Other lines, including C33S, SiO, and U244.556, are distributed around P2. Note that all of the detected emission distributions are compact as compared to the maximum recoverable angular scale of the present observations (3), and thus the compact emission from the observed region is almost covered with the present array configuration.
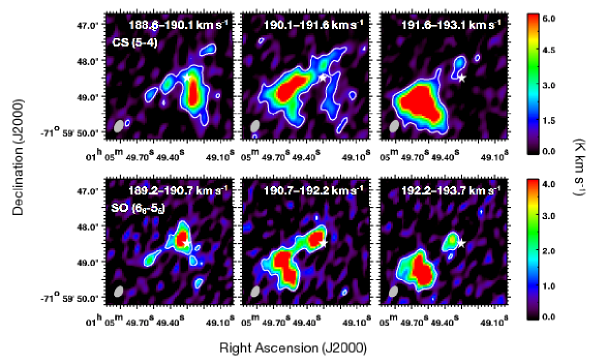
A bridge-like structure, which connects the YSO core and the East core, is seen in the continuum, CS, and SO images. Figure 5 shows channel maps for the CS and SO emission lines. A velocity gradient is clearly seen in the figure; the YSO core is relatively blue-shifted while the East core is red-shifted, and the bridge region shows an intermediate velocity. The velocity difference among those cores is at most 4 km s-1. The continuous velocity structure from the YSO core to the bridge, and to the East core, suggests that these regions are dynamically associated.
3.3 Column densities, gas temperatures, and molecular abundances
3.3.1 Rotation diagram analysis for CH3OH
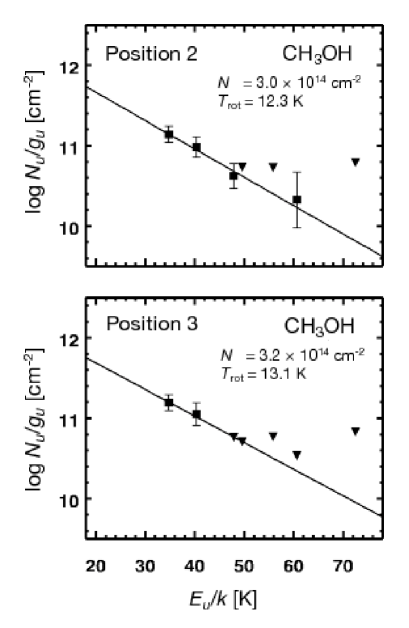
We perform the rotation diagram analysis for CH3OH because we detect multiple lines with different excitation energies (Figure 6). An optically thin condition and the local thermodynamic equilibrium (LTE) are assumed here. We use the following formulae based on the standard treatment of the rotation diagram analysis (e.g., Sutton et al., 1995; Goldsmith & Langer, 1999):
| (1) |
and
| (2) |
where is a column density of molecules in the upper energy level, is the degeneracy of the upper level, is the Boltzmann constant, is the integrated intensity as estimated from the observations, is the transition frequency, is the line strength, is the dipole moment, is the rotational temperature, is the upper state energy, is a total column density, and is the partition function at . All the spectroscopic parameters required in the analysis are extracted from the CDMS database.
Derived column densities and rotational temperatures are = (3.0 ) 1014 cm-2 and = 12.3 K for Position 2, and = (3.2 ) 1014 cm-2 and = 13.1 K for Position 3 (2 uncertainties). Note that the measured intensity of the CH3OH line at 241.90416 GHz is divided by two, because it is a blend of two components (5-2–4-2 E and 52–42 E) with similar spectroscopic properties.
In the above analysis, the data points for two marginal CH3OH detections (50–40 E and 5±2–4±2 E, = 48 K and 61 K) are included in the straight-line fit for P2. For P3, two upper limit points for CH3OH(50–40 E) and (51–41 A-) ( = 50 K) are included in the fit. If we neglect these marginal detections or upper limits in the fit, we obtain higher temperatures and slightly lower column densities; for P2, = 15.6 K and = 2.5 1014 cm-2, and for P3, = 17.3 K and = 2.8 1014 cm-2. However, these fits are incompatible with upper limits, and the fitted line deviates upward from the points. Thus, we take account of the above two detections in P2 and the two upper limit data in P3 to better fit the observation data.
Note that the presence of warm gas components (50 K) within the core can not be ruled out from the limited frequency coverage of the present observations. Future observations in higher frequency regions are thus desirable.
3.3.2 Column density of H2, dust extinction, and mass
A column density of molecular hydrogen () is estimated from the dust continuum data obtained in this work. The measured continuum brightnesses are 0.30 mJy/beam for P1, 0.16 mJy/beam for P2, and 0.06 mJy/beam for P3. The following equation is used to calculate based on the standard treatment of optically thin dust emission (e.g., Shimonishi et al., 2016b):
| (3) |
where is the continuum flux density per beam solid angle as estimated from the observations, is the mass absorption coefficient of dust grains coated by thin ice mantles as taken from Ossenkopf & Henning (1994, here we use 1.1 cm2 g-1), is the dust temperature, is the Planck function, is the dust-to-gas mass ratio, is the mean atomic mass per hydrogen (1.41, according to Cox, 2000), and is the hydrogen mass. We assume that the dust-to-gas mass ratio in the SMC is lower than the typical Galactic value of 0.008 by a factor of five according to the metallicity. This assumption would be valid in a high density regime although dust-to-gas mass ratios in SMC diffuse clouds are higher than the value adopted here (e.g., Roman-Duval et al., 2017).
The dust temperature at P2 and P3 is assumed to be 12 K and 13 K according to the rotation temperatures of CH3OH under the assumption of the LTE. In sub-thermal conditions, however, the kinetic temperature of gas is often higher than excitation temperatures. If we assume a slightly elevated dust temperature, i.e. = 20 K, the derived H2 column densities decrease by a factor of two, and thus fractional molecular abundances are doubled. We should keep in mind that derived molecular abundances entail the systematic uncertainty depending on the assumption of dust temperatures. The dust temperature at P1 is unknown. We thus vary the dust temperature from 10 K to 20 K to derive the range of possible H2 column densities. Assumption of higher dust temperatures ( 23 K) for P1 leads to a low value ( 8 mag), which is unrealistic as extinction towards a deeply embedded high-mass YSO, and also inconsistent with the previous estimate described below.
The derived H2 column densities are shown in Table 3 and used to calculate fractional abundances of other molecular species. The total gas mass contained in each core is estimated to be about 80 M☉ for the YSO core and about 50 M☉ for the East core (assuming = 10 K for both cores).
We also estimate visual extinction () using an / conversion factor. Martin et al. (1989) reported / = 4.6 1022 cm-2 mag-1 for the SMC. Using / 4 for dense clouds (Whittet et al., 2001), we obtain / = 5.8 1021 cm-2 mag-1, where all the hydrogen atoms are assumed to be in H2. A similar ratio is obtained when the Galactic canonical / value (= 1.9 1021 cm-2 mag-1) is scaled by the metallicity of the SMC. Using the above / ratio, we estimate 10–30 mag at P1, 10 mag at P2, and 4 mag at P3. Ward et al. (2017) estimate = 16 8 mag for the YSO at P1 using the ratio of near-infrared H2 emission lines; the value agrees with our estimate that is based on the submillimeter continuum. Note that these are rough estimates since the / ratio is highly uncertain for dense clouds in the SMC.
3.3.3 Column densities of other molecules
Column densities of molecular species other than CH3OH and H2 are estimated by solving Equation 2 for . As well as the dust continuum analysis described in Section 3.3.2, the gas temperature at P2 and P3 is assumed to be 12 K and 13 K, while the gas temperature at P1 is varied between 10 K and 20 K.
The CS(5–4) and SO(66–55) lines are often optically thick in star-forming regions. For CS at P1 and P3, we use the C32S data to derive a lower limit and the C33S non-detection data for an upper limit to estimate a possible range of column densities. At P2, the CS column density is derived only from the C33S line. Similarly, for SO, we use the 32SO data to derive a lower limit and the 33SO non-detection data for an upper limit to estimate a possible range of column densities at all positions. We here assume 32S/33S = 40, based on the 33SO2 observations towards a hot core in the LMC (Shimonishi et al., 2016b). Column densities of HCO+ and HCN are estimated from H13CO+ and H13CN data, respectively. We here assume 12C/13C = 50 according to HCO+/H13CO+ observations of the N27 region in the SMC (Heikkilä et al., 1999).
Estimated column densities and fractional abundances at each position are summarized in Table 3.
| Position 1aafootnotemark: | Position 2bbfootnotemark: | Position 3bbfootnotemark: | ||||
|---|---|---|---|---|---|---|
| Molecule | / | / | / | |||
| (cm-2) | (cm-2) | (cm-2) | ||||
| H2ccfootnotemark: | (0.6–1.6) 1023 | 6.3 1022 | 2.1 1022 | |||
| CH3OHddfootnotemark: | (1.1–1.8) 1014 | 2 10-9 | (3.0 ) 1014 | (4.7 ) 10-9 | (3.2 ) 1014 | (1.5) 10-8 |
| CSeefootnotemark: | (0.2–5.4) 1014 | (1.8 1.5) 10-9 | (1.3 0.3) 1015 | (2.0 0.4) 10-8 | (1.1–3.3) 1014 | (1.0 0.5) 10-8 |
| SOfffootnotemark: | (0.5–6.4) 1015 | (2.4 1.6) 10-8 | (1.4–4.0) 1015 | (4.3 2.1) 10-8 | (1.1–3.0) 1015 | (9.5 4.5) 10-8 |
| SO2 | (5.2–6.0) 1013 | 9 10-10 | (9.9 6.1) 1013 | (1.6 1.0) 10-9 | (8.4 2.9) 1013 | (4.0 1.4) 10-9 |
| H2CS | (0.3–1.8) 1014 | 1 10-9 | (2.4 0.5) 1014 | (3.8 0.8) 10-9 | 6.9 1013 | 3 10-9 |
| HCNggfootnotemark: | (5.1–9.1) 1013 | 9 10-10 | (9.6 4.4) 1013 | (1.4 0.7) 10-9 | 6.5 1013 | 3 10-9 |
| HCO+ggfootnotemark: | (1.7–4.1) 1014 | (2.9 1.0) 10-9 | (7.9 3.3) 1013 | (1.3 0.5) 10-9 | (4.4 2.0) 1013 | (2.1 1.0) 10-9 |
| c-C3H2 | (5.5–6.3) 1013 | 1 10-9 | 5.3 1013 | 9 10-10 | 5.1 1013 | 2 10-9 |
| SiO | (0.2–1.1) 1013 | 7 10-11 | (1.3 0.6) 1013 | (2.1 0.9) 10-10 | 7.9 1012 | 4 10-10 |
Note. — Uncertainties and upper limits are of the 2 level and do not include systematic errors due to adopted spectroscopic constants. a varied between 10 K and 20 K. b assumed to be 12 K for P2 and 13 K for P3 based on the rotation analysis of CH3OH lines. cEstimated from dust continuum. dEstimated based on the rotation analysis. eThe lower limit and the upper limit are estimated from the CS and C33S data (assuming 32S/33S = 40). For Position 2, only the C33S data are used. fThe lower limit and the upper limit are estimated from the SO and 33SO data using the above isotope ratio. gEstimated from the isotopologue assuming 12C/13C = 50. See Section 3.3 for details.
4 Discussion
4.1 Physical properties of two dense cores
The present ALMA observations resolved a single infrared source into two molecular cloud cores (the YSO core and the East core). They are physically associated but show different chemical properties. We first discuss physical properties of these cores in the following section.
4.1.1 The YSO core
The molecular cloud core including Position 1 is associated with an embedded high-mass YSO that is bright in infrared and radio continuum. A spectral energy distribution (SED) of the YSO is shown in Figure 7 (data are collected from available databases and literatures, including Skrutskie et al., 2006; Meixner et al., 2006, 2013; Kemper et al., 2010). The photometric point at 1200 m is estimated from the present ALMA data. The 2–5 m spectrum is based on our AKARI data, and the five narrow-band photometric points around 10 m are based on our Gemini/T-ReCS data (see Section 2.4 for details of these data). The YSO’s SED peaks in the far-infrared region (50-70 m), suggesting that the source is at an early evolutionary stage. The bolometric luminosity of the YSO is estimated to be 2 104 L☉ by integrating the SED from 1 m to 1200 m. Oliveira et al. (2013) reported a luminosity of 2.3 104 L☉ for the YSO, with which our estimate is consistent. The high luminosity is consistent with the presence of a high-mass YSO.
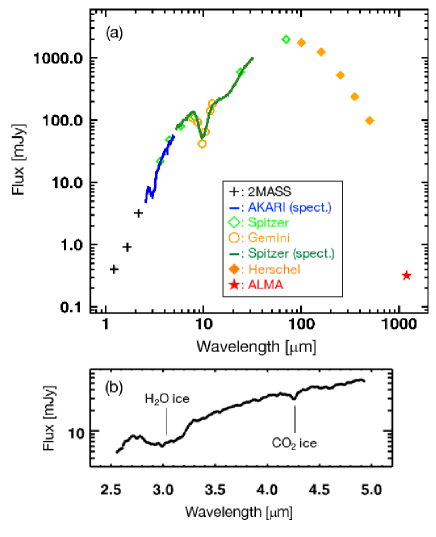
Absorption bands due to the H2O ice, the CO2 ice, and the silicate dust are seen in the 2–20 m spectrum of the YSO (Fig. 7), as previously reported in Oliveira et al. (2011, 2013). The beam size of the AKARI data, which shows the ice absorption bands, is much larger than those of ALMA and Gemini data. However, because ices are observed with absorption spectroscopy, the absence of an infrared continuum source at P2 and P3 as shown in the infrared image indicates that the observed ice absorption bands originate mainly from the infrared point source associated with P1. Further analysis on ice absorption bands is described in Section 4.2. Previous studies detected compact emission due to hydrogen recombination lines and shocked H2 lines associated with the YSO (Oliveira et al., 2013; Ward et al., 2017). On the other hand, emission features due to fine-structure lines from ionized metals and polycyclic aromatic hydrocarbon (PAH) bands are absent or weak in the infrared spectrum of the YSO. The above spectral characteristics suggest that the YSO is still embedded in cold dust and ices, and a prominent H II region is not formed yet.
A number density of molecular hydrogen at P1 is estimated to be 3–8 105 cm-3 (assuming a source diameter of 0.1 pc and a spherical distribution of gas) and the in the line of sight is 10–30 mag. This suggests that the YSO core contains dense molecular gas that is well shielded from the external radiation field. Given the embedded nature of the source and the absence of a prominent H II region, the radiation from the central protostar would only have a limited effect on the bulk of molecular gas within the core.
4.1.2 The East core
The molecular cloud core including Position 2 and 3 is not associated with an infrared source. The gas density (assuming the source diameter of 0.1 pc and the spherical distribution) and the dust extinction are estimated to be = 3 105 cm-3 and 10 mag at P2, while = 1 105 cm-3 and 4 mag at P3. The temperature of molecular gas is 10 K as estimated from CH3OH lines (see Section 3.3.1). These properties suggest that the East core contains cold and dense molecular gas.
The lack of infrared sources suggests that a high-mass YSO is not present in the East core except for extremely young and cold ones that are elusive even in infrared. However, the possible presence of low-mass YSOs in the East core cannot be ruled out from the current infrared data because of the sensitivity limit. A single low-mass YSO would be too faint to be detected by the present submillimeter observations since the size of a protostellar core is usually small (0.01 pc, e.g., van Dishoeck et al., 1995), but an unresolved cluster of low-mass YSOs may produce a detectable amount of molecular line emission. A massive starless cloud such as an infrared dark cloud is also a possible candidate for the East core.
The low temperature of CH3OH gas, as well as the lack of a bright infrared source in the East core, suggests that the presence of a prominent hot core would be less likely. Cold CH3OH gas (5 K) has been detected in Galactic low-mass starless cores, but the observed line width is typically 0.1–0.5 km s-1, which is much narrower than the line width measured for the East core (Tafalla et al., 2006; Soma et al., 2015).
The above discussion suggests that the East core would harbor (i) a massive starless core, or (ii) an embedded high-mass YSO(s) before the emergence of infrared emission, or (iii) a cluster of low-mass embedded YSOs.
4.2 Chemical differentiation
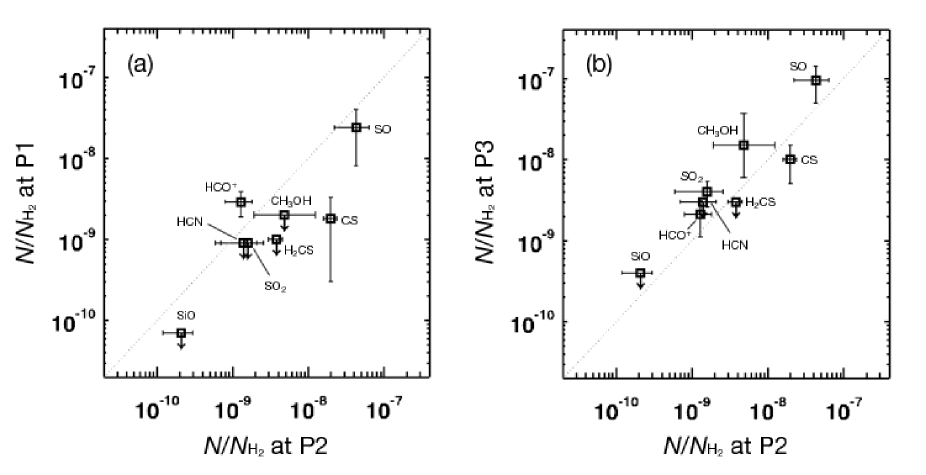
Chemical compositions of the YSO core and the East core, which are separated by about 0.3 pc, show different characteristics. Figure 8 compares molecular abundances at P1, P2, and P3. The P1–P2 comparison shows that only HCO+ is more abundant at P1, while CS, H2CS, and SiO are significantly underabundant at P1. On the other hand, the P2–P3 comparison shows generally similar molecular abundances between P2 and P3. Note that CH3OH and SO2 are slightly overabundant at P3 compared to P2. The correlation coefficient for abundances of molecular species that are detected in both P2 and P3 (CH3OH, CS, SO, SO2, and HCO+) is 0.89. The good correlation suggests a similar molecular abundances within the East core. These results imply a chemical differentiation between the YSO core and the East core.
One possible interpretation of this chemical differentiation is the different degree of the adsorption of gas-phase species onto grain surfaces. As shown in Figure 7(b), absorption bands due to the H2O and CO2 ices are detected in the line of sight toward the YSO located at P1. The estimated high toward P1 (10–30 mag) is actually sufficient for the formation of ice mantles. Using the AKARI spectrum shown in the figure, ice column densities are estimated to be (H2O ice) = (17 5) 1017 cm-2 and (CO2 ice) = (1.1 0.2) 1017 cm-2 for the absorption bands at 3.05 m and 4.27 m (derivation is based on the method presented in Shimonishi et al., 2016a). For the CH3OH and CO ices, upper limits of (CH3OH ice) 4 1017 cm-2 and (CO ice) 2 1017 cm-2 (2) are estimated for the absorption bands at 3.53 m and 4.67 m, respectively. Oliveira et al. (2011, 2013) have estimated ice column densities of the YSO to be (H2O ice) = (16.6 0.7) 1017 cm-2, (CO2 ice) = (1.0 0.2) 1017 cm-2, and (CO ice) 0.45 1017 cm-2 using ground-based L-/M-band spectra and a Spitzer mid-infrared spectrum. The present results of the AKARI spectroscopy agree with their measurements.
The total fractional abundance of elemental oxygen (w.r.t. H) in solid H2O and CO2 at P1 is estimated to be 1 10-5, where we use the H2 column density shown in Table 3. Similarly, that for elemental carbon in ice mantles is estimated to be 6 10-7. Elemental abundances of gas-phase oxygen and carbon in the SMC, after considering the depletion into dust grain material, are expected to be 3.7 10-5 for oxygen and 1.5 10-5 for carbon, according to the the SMC low-metal model of Acharyya & Herbst (2016). Although the gas-phase counterparts of H2O and CO2 are not observed in this work, the above discussion suggests that a non-negligible fraction of heavy elements, especially oxygen, are frozen in ice mantles at P1.
Shock chemistry is another possible cause of the chemical differentiation between the YSO core and the East core. The detection of shock tracers such as SO2 and SiO at P2/P3 implies a possible contribution of shock chemistry on the chemical compositions. Ward et al. (2017) detected collisionally-excited near-infrared H2 emission lines in IRAS 01042-7215, which suggests the presence of shocked gas in this region. The effect of shocks on the chemical compositions of the East core will be further discussed in Section 4.3.2.
Finally, we note that future high-sensitivity observations for ices in the East core will be important to further investigate the chemical differentiation in the observed region, since the estimated at P2 and P3 (4–10 mag) is still plausible for the ice formation.
4.3 Organic molecules in a low metallicity environment
The detection of CH3OH in the SMC has a strong impact on our understanding of the formation of organic molecules in metal-poor environments. We here discuss abundances and possible origins of cold CH3OH gas in the East core.
4.3.1 Abundance of CH3OH
The fractional abundance of CH3OH gas in the East core is (4.7 ) 10-9 at P2 and 1.5 10-8 at P3. As discussed in Section 4.1.2, a possible Galactic counterpart for the East core will be cold and embedded sources such as infrared dark clouds or early-stage YSOs without a hot core region. Thus, the CH3OH gas abundances estimated in this work should be compared with those of such Galactic sources. Typical abundances of CH3OH gas in Galactic infrared dark clouds are reported to be several 10-9 (see, e.g., Fig.3 in Gerner et al., 2014). Similar abundances are reported for Galactic embedded YSOs without hot cores/corinos (e.g., van der Tak et al., 2000; Watanabe et al., 2012; Gerner et al., 2014). Despite a factor of five lower metallicity in the SMC, the CH3OH gas abundance at P2 is comparable to those of Galactic counterparts, and that of P3 is marginally higher than the typical Galactic value. If the CH3OH gas abundance is simply regulated by the elemental abundances of carbon and oxygen, then the decreased CH3OH abundance according to the SMC’s metallicity is expected, but this is not observed in the present data. This would indicate an enhanced production or a suppressed destruction of gas-phase CH3OH in the East core compared to Galactic similar sources.
The CH3OH gas abundance in the East core is comparable to those of two LMC hot cores reported in Sewiło et al. (2018), although the excitation temperature of CH3OH in the East core is much lower than those of the two hot cores. Currently, a hot core is not yet detected in the SMC, thus future search for SMC hot cores will be important to further understand low-metallicity organic chemistry in warm and dense gas around a protostar.
4.3.2 Possible origin of CH3OH in the East core
It is believed that CH3OH is mainly formed on dust grains. Hydrogenation of CO on grain surfaces or energetic processes by photolysis/radiolysis of ice mantles are believed to be responsible for the formation of solid CH3OH (e.g., Gerakines et al., 2001; Watanabe et al., 2007). The gas-phase CH3OH is thus produced by desorption of solid CH3OH from ices.
The desorption mechanisms include (i) sublimation by heating, (ii) photodesorption by UV photons, (iii) sputtering by shocks (e.g., Aota et al., 2015), and (iv) reactive desorption222Desorption triggered by liberation of reaction energy (e.g., Garrod et al., 2007). The low gas temperature at P2 and P3 suggests that (i) would be less dominant in the East core, since the sublimation temperature of the CH3OH ice is higher than 80 K (e.g., Tielens, 2005). A major source of the UV radiation in the East core would be the cosmic-ray-induced UV photons owing to the high . However, the average cosmic-ray density in the SMC is reported to be lower than the solar neighborhood by a factor of 7 (Abdo et al., 2010). This may lower the efficiency of (ii) compared to the Galactic dense clouds. Note that P3 is located close to the edge of the East core and that the estimated column density and extinction are lower than those at P1 and P2. Thus, the photodesorption of CH3OH from ices could be enhanced at P3 compared to P1 and P2 owing to the less attenuated interstellar radiation field. Such a physical condition similar to photodissociation regions may contribute to the high abundance of CH3OH gas at P3.
A common shock tracer, SiO, is marginally detected at P2, and its line width is possibly broader than those of other emission lines observed in the East core. This suggests a possible contribution of the mechanism (iii) to the production of gas-phase CH3OH. The energy source(s) responsible for triggering the shock chemistry are unknown; possible candidates are outflows from the high-mass YSO located at P1 or outflows from hidden embedded YSO(s) in the East core. Given the small velocity difference between the East core and the YSO core (4 km/s, see Fig. 5), the collision between the two cores and subsequent shock sputtering of ice mantles are less likely for the production of CH3OH gas in the present source (see shock sputtering models in Aota et al., 2015; Miura et al., 2017). The presence of the dynamically continuous bridge-like structure seen in the continuum, CS, and SO lines would support the physical interaction between the YSO core and the East core (Section 3.2). Further observations of intense shock/outflow tracers will help test the contribution of the mechanism (iii). Finally, the mechanism (iv) will be also possible, but its relative contribution should be carefully evaluated with the aid of astrochemical models.
Note that the CH3OH ice absorption band at 3.53 m is not detected in the infrared spectrum of the YSO at P1. However, this does not necessarily mean the absence of solid CH3OH in the YSO core, because the spectral resolution and sensitivity of the present infrared data are not sufficient to detect a weak absorption band of the CH3OH ice.
4.3.3 Comparison with observations of the LMC and the relevant chemical model
In the LMC, a low abundance of CH3OH, compared to similar Galactic objects, is suggested for ices around embedded high-mass YSOs (Seale et al., 2011; Shimonishi et al., 2016a), warm and dense gas around a hot molecular core (Shimonishi et al., 2016b), and cold diffuse gas in molecular clouds (Nishimura et al., 2016b). The low CH3OH abundance is also suggested for molecular clouds in another nearby low-metallicity galaxy, IC10 (Nishimura et al., 2016a). Shimonishi et al. (2016a) proposed the warm ice chemistry hypothesis to interpret the low abundance of CH3OH in the LMC. The hypothesis argues that warm dust temperatures inhibit the hydrogenation of CO in LMC dense clouds, which contributes to the low CH3OH abundances in both solid and gas phase. Astrochemical simulations on gas-ice chemistry dedicated to the LMC environment quantitatively characterize such temperature effects (Acharyya & Herbst, 2015; Pauly & Garrod, 2018). On the other hand, Sewiło et al. (2018) recently detected CH3OH gas and its possible daughter species (CH3OCH3 and CH3OCHO) from two hot cores in the LMC. They argue that abundances of these molecular species simply scale with the metallicity of the LMC. The results would suggest the large chemical variation among star-forming cores in the LMC and that the suppression of the CH3OH production due to warm ice chemistry does not always dominate the organic chemistry at low metallicity.
In the SMC, the metallicity is even lower than the LMC, and the interstellar radiation field is expected to be less attenuated. This would possibly raise dust temperatures in dense clouds, and the CH3OH production could be suppressed if the dust temperature has a dominant effect on grain surface chemistry. However, the CH3OH gas abundance in the East core is comparable with those of similar Galactic objects as shown in Section 4.3.1. A decrease of the CH3OH abundance, as expected from the inhibition of CO hydrogenation at elevated dust temperatures, is not seen in the present SMC source.
Shimonishi et al. (2016a) argue that a high CO2/H2O ice column density ratio is another observational indicator of warm ice chemistry, because mobile CO on warm dust surfaces would efficiently react with OH to form CO2. Previous observations reported that CO2/H2O ice ratios are about a factor of two larger in envelopes of high-mass YSOs in the LMC (30, Shimonishi et al., 2008, 2010, 2016a; Oliveira et al., 2009; Seale et al., 2011) as compared with those in Galactic high-mass YSOs (17, Gerakines et al., 1999). The CO2/H2O ice ratio of the high-mass YSO at P1 is estimated to be 7 (Section 4.2), which is lower than the typical ratios for Galactic and LMC high-mass YSOs. Ice abundances in P2/P3 are currently unknown, but at least in P1, the observations suggest that the enhanced CO2 ice abundance as observed in LMC YSOs is not clearly seen. The lack of the CO2/H2O ratio enhancement in the SMC is also suggested for a larger sample of embedded high-mass YSOs in the SMC (Oliveira et al., 2013). Oliveira et al. (2011) state that enhanced photodesorption of H2O ice in the outer envelope of YSOs can explain the observed characteristics of the CO2/H2O ratios in the LMC/SMC, rather than the grain temperature effect mentioned above.
The above discussions suggest that the chemical properties of dense cores in IRAS 01042-7215 show different characteristics compared with previously observed LMC sources, although statistical properties of dense cloud chemistry at the LMC’s and SMC’s metallicity are yet to be investigated.
Numerical simulations of gas-ice chemistry dedicated to the SMC and further metal-poor environments are presented in the literature (Acharyya & Herbst, 2016; Pauly & Garrod, 2018; Ceccarelli et al., 2018). Acharyya & Herbst (2016) show that low grain temperatures (lower than at least 20 K) and well-shielded conditions ( larger than at least 5 mag) are necessary to attain a CH3OH gas abundance higher than 10-9 in SMC dense clouds (see their Fig. 3). The present observational results suggest that a cold, dense, and well-shielded region that is necessary for the production of CH3OH actually exists even at the decreased metallicity of the SMC. Interestingly, the astrochemical simulations in Pauly & Garrod (2018) suggest the enhancement of the CH3OH ice abundance relative to the CO ice in their low-metallicity models (particularly in their SMC models). According to their explanation, higher grain temperatures decrease the efficiency of the CO hydrogenation, because more CO is converted to CO2 and less CH3OH is produced, as expected from the warm ice chemistry hypothesis. On the other hand, they also argue that lower metallicities result in slower accretion rates of gaseous heavy elements, which relatively increases the efficiency of the CO hydrogenation, because this allows CO to reside on the surface for a longer time for the successive hydrogenation to form CH3OH, before being embedded in the mantle phase and/or reacting with other heavy surface reactants such as OH. It is likely that the balance between the dust temperature and the abundance of heavy elements is one of the important determinants of the CO hydrogenation efficiency on grain surfaces. Since neither the CO ice nor the CH3OH ice is detected towards the East core and other embedded sources in the SMC, future high-sensitivity observations need to statistically quantify abundances of solid CO and CH3OH in the SMC. This may shed light on the reason for the abundant CH3OH gas in the low-metallicity dense core observed in this work.
We emphasize that it is still unclear whether the chemical composition observed in the East core of IRAS 01042-7215 represents common characteristics of cold and dense molecular clouds in metal-poor environments. Theoretical studies argue that chemical compositions of dense molecular clouds show a complex dependence on various local environmental factors, notably for species that are mainly produced on grain surfaces such as CH3OH (Acharyya & Herbst, 2015, 2016; Pauly & Garrod, 2018). It may be possible that patchy distributions of the interstellar medium in an irregular galaxy cause localized and variable radiation environments, which can lead to diverse physical and chemical conditions of molecular clouds compared to our Galaxy. We obviously need to increase the relevant astrochemical data in future observations.
4.4 Tentative Detection of HDS
An unidentified line is detected at the rest-frame frequency of 244.5556 GHz (assuming = 192.0 km s-1) in the spectrum of Position 2. The spatial distribution of the emission is similar to those of C33S, H2CS, and SiO. The line width is consistent with the other lines detected in the East core.
A possible candidate for the line is HDS (), which is located at 244.55558 GHz and has the upper-state energy of 11.7 K according to the CDMS catalogue. The low upper-state energy suggests that this transition can be excited even in the low-temperature condition at P2. If the line is due to HDS (), then the observed line strength corresponds to (HDS) = (5 1.3) 1013 cm-2 and (HDS)/ = 8 10-10 (assuming = 12 K). Abundances of HDS in Galactic star-forming cores are typically in the range of 10-11–10-10 according to Vastel et al. (2003). The estimated HDS abundance at the East core is comparable to typical Galactic values despite the lower elemental abundances in the SMC. Further observations of other transitions and related molecular species are highly required to understand deuterium chemistry in low-metallicity environments.
5 Summary
We report the results of 0.1 pc scale submillimeter observations towards a high-mass young stellar object (IRAS 01042-7215) in the Small Magellanic Cloud with ALMA. Complementary infrared data obtained with AKARI and the Gemini South telescope are also presented. The following conclusions are obtained in this work:
-
1.
Emission lines of CS, C33S, H2CS, SO, SO2, CH3OH, H13CO+, H13CN, SiO, and dust continuum are detected. Among these species, CH3OH, SO2, H2CS, C33S, and H13CN are for the first time detected in the SMC. Tentative detection of HDS is also reported.
-
2.
The target source is spatially resolved into two dense molecular cloud cores, named the YSO core and the East core. The YSO core is very dense ( 106 cm-3) and well shielded ( 10–30 mag), and is associated with an embedded high-mass YSO. The East core is also dense ( 105 cm-3) and shielded ( 4–10 mag), but is not associated with an infrared source. A gas temperature in the East core is estimated to be 10 K based on the rotation analysis of CH3OH lines. A possible Galactic counterpart for the East core would be a massive starless core, an embedded high-mass YSO(s) before the emergence of infrared emission, or a cluster of low-mass embedded YSOs.
-
3.
The above two dense cores, which are separated by 0.3 pc, show different chemical characteristics. The chemical composition of the YSO core is characterized by the low abundance of molecular gas and the presence of ices. In contrast, the East core is characterized by relatively rich molecular lines, and the species except for CS, SO, and H13CO+ are detected only in the East core. Ices are not detected toward the East core in the current data owing to the lack of a bright infrared continuum source. We speculate that the effect of shock chemistry and/or the different degree of the adsorption of gas-phase species onto dust may contribute to the chemical differentiation.
-
4.
The fractional abundance of CH3OH gas in the East core is estimated to be (0.5–1.5) 10-8, which is comparable with or marginally higher than those of similar cold sources in our Galaxy despite a factor of five lower metallicity in the SMC. This would indicate an enhanced production or a suppressed destruction of gas-phase CH3OH in the present SMC source compared to Galactic analogues. Although it is still unclear whether the observed source represents common characteristics of cold and dense molecular gas in the SMC, this work provides observational evidence that an organic molecule like CH3OH, which is largely formed on grain surfaces, can be produced even in a significantly lower metallicity environment compared to the solar neighborhood. A possible origin of cold CH3OH gas in the East core is discussed.
References
- Abdo et al. (2010) Abdo, A. A., Ackermann, M., Ajello, M., et al. 2010, A&A, 523, A46
- Acharyya & Herbst (2015) Acharyya, K., & Herbst, E. 2015, ApJ, 812, 142
- Acharyya & Herbst (2016) —. 2016, ApJ, 822, 105
- Aguirre et al. (2003) Aguirre, J. E., Bezaire, J. J., Cheng, E. S., et al. 2003, ApJ, 596, 273
- Aota et al. (2015) Aota, T., Inoue, T., & Aikawa, Y. 2015, ApJ, 799, 141
- Ceccarelli et al. (2018) Ceccarelli, C., Viti, S., Balucani, N., & Taquet, V. 2018, MNRAS, 476, 1371
- Chin et al. (1998) Chin, Y.-N., Henkel, C., Millar, T. J., Whiteoak, J. B., & Marx-Zimmer, M. 1998, A&A, 330, 901
- Chin et al. (1997) Chin, Y.-N., Henkel, C., Whiteoak, J. B., et al. 1997, A&A, 317, 548
- Cox (2000) Cox, A. N. 2000, Allen’s astrophysical quantities (Springer)
- Dufour (1984) Dufour, R. J. 1984, in IAU Symposium, Vol. 108, Structure and Evolution of the Magellanic Clouds, ed. S. van den Bergh & K. S. D. de Boer, 353–360
- Ellingsen et al. (2010) Ellingsen, S. P., Breen, S. L., Caswell, J. L., Quinn, L. J., & Fuller, G. A. 2010, MNRAS, 404, 779
- Garrod et al. (2007) Garrod, R. T., Wakelam, V., & Herbst, E. 2007, A&A, 467, 1103
- Gerakines et al. (2001) Gerakines, P. A., Moore, M. H., & Hudson, R. L. 2001, J. Geophys. Res., 106, 33381
- Gerakines et al. (1999) Gerakines, P. A., Whittet, D. C. B., Ehrenfreund, P., et al. 1999, ApJ, 522, 357
- Gerner et al. (2014) Gerner, T., Beuther, H., Semenov, D., et al. 2014, A&A, 563, A97
- Goldsmith & Langer (1999) Goldsmith, P. F., & Langer, W. D. 1999, ApJ, 517, 209
- Graczyk et al. (2014) Graczyk, D., Pietrzyński, G., Thompson, I. B., et al. 2014, ApJ, 780, 59
- Green et al. (2008) Green, J. A., Caswell, J. L., Fuller, G. A., et al. 2008, MNRAS, 385, 948
- Heikkilä et al. (1999) Heikkilä, A., Johansson, L. E. B., & Olofsson, H. 1999, A&A, 344, 817
- Israel et al. (1993) Israel, F. P., Johansson, L. E. B., Lequeux, J., et al. 1993, A&A, 276, 25
- Kemper et al. (2010) Kemper, F., Woods, P. M., Antoniou, V., et al. 2010, PASP, 122, 683
- Leroy et al. (2007) Leroy, A., Bolatto, A., Stanimirovic, S., et al. 2007, ApJ, 658, 1027
- Martin et al. (1989) Martin, N., Maurice, E., & Lequeux, J. 1989, A&A, 215, 219
- Meixner et al. (2006) Meixner, M., Gordon, K. D., Indebetouw, R., et al. 2006, AJ, 132, 2268
- Meixner et al. (2013) Meixner, M., Panuzzo, P., Roman-Duval, J., et al. 2013, AJ, 146, 62
- Miura et al. (2017) Miura, H., Yamamoto, T., Nomura, H., et al. 2017, ApJ, 839, 47
- Müller et al. (2005) Müller, H. S. P., Schlöder, F., Stutzki, J., & Winnewisser, G. 2005, Journal of Molecular Structure, 742, 215
- Müller et al. (2001) Müller, H. S. P., Thorwirth, S., Roth, D. A., & Winnewisser, G. 2001, A&A, 370, L49
- Murakami et al. (2007) Murakami, H., Baba, H., Barthel, P., et al. 2007, PASJ, 59, 369
- Muraoka et al. (2017) Muraoka, K., Homma, A., Onishi, T., et al. 2017, ApJ, 844, 98
- Nishimura et al. (2016a) Nishimura, Y., Shimonishi, T., Watanabe, Y., et al. 2016a, ApJ, 829, 94
- Nishimura et al. (2016b) —. 2016b, ApJ, 818, 161
- Oliveira et al. (2009) Oliveira, J. M., van Loon, J. T., Chen, C., et al. 2009, ApJ, 707, 1269
- Oliveira et al. (2011) Oliveira, J. M., van Loon, J. T., Sloan, G. C., et al. 2011, MNRAS, 411, L36
- Oliveira et al. (2013) —. 2013, MNRAS, 428, 3001
- Onaka et al. (2007) Onaka, T., Matsuhara, H., Wada, T., et al. 2007, PASJ, 59, 401
- Ossenkopf & Henning (1994) Ossenkopf, V., & Henning, T. 1994, A&A, 291, 943
- Pauly & Garrod (2018) Pauly, T., & Garrod, R. T. 2018, ApJ, 854, 13
- Roman-Duval et al. (2017) Roman-Duval, J., Bot, C., Chastenet, J., & Gordon, K. 2017, ApJ, 841, 72
- Ruffle et al. (2015) Ruffle, P. M. E., Kemper, F., Jones, O. C., et al. 2015, MNRAS, 451, 3504
- Russell & Dopita (1992) Russell, S. C., & Dopita, M. A. 1992, ApJ, 384, 508
- Seale et al. (2011) Seale, J. P., Looney, L. W., Chen, C.-H. R., Chu, Y.-H., & Gruendl, R. A. 2011, ApJ, 727, 36
- Sewiło et al. (2018) Sewiło, M., Indebetouw, R., Charnley, S. B., et al. 2018, ApJ, 853, L19
- Shimonishi (2012) Shimonishi, T. 2012, PhD thesis, The University of Tokyo
- Shimonishi et al. (2016a) Shimonishi, T., Dartois, E., Onaka, T., & Boulanger, F. 2016a, A&A, 585, A107
- Shimonishi et al. (2008) Shimonishi, T., Onaka, T., Kato, D., et al. 2008, ApJ, 686, L99
- Shimonishi et al. (2010) —. 2010, A&A, 514, A12
- Shimonishi et al. (2016b) Shimonishi, T., Onaka, T., Kawamura, A., & Aikawa, Y. 2016b, ApJ, 827, 72
- Skrutskie et al. (2006) Skrutskie, M. F., Cutri, R. M., Stiening, R., et al. 2006, AJ, 131, 1163
- Soma et al. (2015) Soma, T., Sakai, N., Watanabe, Y., & Yamamoto, S. 2015, ApJ, 802, 74
- Sutton et al. (1995) Sutton, E. C., Peng, R., Danchi, W. C., et al. 1995, ApJS, 97, 455
- Tafalla et al. (2006) Tafalla, M., Santiago-García, J., Myers, P. C., et al. 2006, A&A, 455, 577
- Tielens (2005) Tielens, A. G. G. M. 2005, The Physics and Chemistry of the Interstellar Medium
- van der Tak et al. (2000) van der Tak, F. F. S., van Dishoeck, E. F., & Caselli, P. 2000, A&A, 361, 327
- van Dishoeck et al. (1995) van Dishoeck, E. F., Blake, G. A., Jansen, D. J., & Groesbeck, T. D. 1995, ApJ, 447, 760
- van Loon et al. (2008) van Loon, J. T., Cohen, M., Oliveira, J. M., et al. 2008, A&A, 487, 1055
- van Loon et al. (2010) van Loon, J. T., Oliveira, J. M., Gordon, K. D., Sloan, G. C., & Engelbracht, C. W. 2010, AJ, 139, 1553
- Vastel et al. (2003) Vastel, C., Phillips, T. G., Ceccarelli, C., & Pearson, J. 2003, ApJ, 593, L97
- Venn (1999) Venn, K. A. 1999, ApJ, 518, 405
- Wang et al. (2009) Wang, M., Chin, Y.-N., Henkel, C., Whiteoak, J. B., & Cunningham, M. 2009, ApJ, 690, 580
- Ward et al. (2017) Ward, J. L., Oliveira, J. M., van Loon, J. T., & Sewiło, M. 2017, MNRAS, 464, 1512
- Watanabe et al. (2007) Watanabe, N., Mouri, O., Nagaoka, A., et al. 2007, ApJ, 668, 1001
- Watanabe et al. (2012) Watanabe, Y., Sakai, N., Lindberg, J. E., et al. 2012, ApJ, 745, 126
- Whittet et al. (2001) Whittet, D. C. B., Gerakines, P. A., Hough, J. H., & Shenoy, S. S. 2001, ApJ, 547, 872